Quality of life: analyzing the impact of factors related to health, based on system and mathematical models

Author: Ilyasov Baryi Galeevich, Martynov Vitalii Vladimirovich, Gerasimova Ilmira Baryevna, Makarova Elena Anatolevna, Zakieva Elena Shavkatovna
Journal: Economic and Social Changes: Facts, Trends, Forecast @volnc-esc-en
Section: Economics and sociology of public health and healthcare
Article in issue: 3 (51) т.10, 2017.
Free access
The paper considers the formation of the structure of the indicator of the quality of health as a major factor that has the greatest impact on the quality of life. The paper also analyzes the properties of the proposed structure and main approaches to assessing and measuring the quality of life and quality of health. It is established that the integral indicator of health quality has a complex structure that belongs to the class of hierarchical structures. The paper studies properties of hierarchical structures with the help of systematic approach, according to which the integral indicator of health quality was broken down and three components (system indicators) were identified. They are as follows: quality of care, quality of environment and quality of health. Each component, in turn, was broken down and presented as a triad of interrelated objective and subjective indicators of lower level (partial indicators). The proposed system model for assessing the integral indicator of health quality is a spatial structure of this indicator, which takes into account the links between system indicators at the median level and the links between partial indicators at the lower level...
Quality of life, quality of health, integral indicator, system model
Short address: https://sciup.org/147223944
IDR: 147223944 | UDC: [614:316.728]:007 | DOI: 10.15838/esc.2017.3.51.10
Text of the scientific article Quality of life: analyzing the impact of factors related to health, based on system and mathematical models
Currently, the category of “quality of life” is widely used in economic, sociological, and medical research and is quite often found in political speeches and media publications.
The need to improve the quality of life of Russian citizens is indicated in the Decree of the President of the Russian Federation as one of the most significant in the sphere of ensuring national security [19]. On the approved list of state programs, the first place in terms of funding belongs to the set of programs “New quality of life” [15].
There are many theoretical concepts of the quality of life, which highlight various aspects of life (happiness, health, decent life, etc.), but there is no single and universal definition of this category. And this is obvious, since, when talking about the quality of life, we should take into consideration a wide range of spheres of human life and its environment, as well as the diversity (time and space) of mental attitudes of people in the interpretation of this concept [1].
A variety of definitions of the quality of life is accompanied by a considerable number of methods for its measurement. There are two main methodological approaches to the assessment and measurement of the quality of life: the macro approach (or the objectivist approach) based on the analysis and compression of statistical indicators, and the micro approach (or the subjectivist approach) based on the analysis and processing of the results of special questionnaire surveys [1].
Criteria for objective assessment of the quality of life can be found in the existing standards of the needs and interests of the people, in relation to which we can objectively assess the degree of satisfaction of these needs and interests [3]. In such a case the financial position of individuals (the standard of living), the state of their health, living conditions, marital status and others. From the subjective viewpoint, the “quality of life” means that every person acquires their own life experience, and therefore, different people assess the quality of their lives in different ways. At that, the concept of the “quality of life” is often associated with the concepts of “happiness” and “satisfaction with life” as a whole or with its individual aspects [7].
At the same time, foreign and local scientists agree that the use of only the objectivist or the subjectivist approach cannot give a fully adequate assessment of the quality of life and reflects only partial aspects of the assessment [16, 23]. Thus, research interests are shifting toward a combined approach that allows for considering not only the objective indicators of the quality of life, but also the subjective psychological and social components of how the people perceive the quality of life [21, 27]. Sociological research methods allow us to evaluate important aspects of people’s self-rated well-being (e.g., self-reported health, relationships with other people, values, etc.) that complement and compensate for objective indicators of the quality of life [3]. “A model of the quality of human life must combine objective indicators that can be measured fairly accurately and subjective indicators that can be determined either by expert evaluations or opinion polls” [5].
Thus, the indicator of the quality of life has a complex structure, therefore, it should be regarded from the standpoint of the system approach, taking into consideration the relationship between all its components. The works [4, 17] consider the quality of life as a complex system that has basic system properties such as integrity, hierarchy, and integration. The works [9, 10] suggest models for the formation and assessment of the quality of life that are developed on the basis of the system approach.
According to opinion polls, health is a major factor influencing the quality of life of Russians [2]. In recent years, the government has been paying great attention to the health of the nation, including both physical and spiritual health in this concept. Public health is one of the main factors in the successful functioning of society. Creating conditions for preservation and improvement of public health is a priority task for any state [20]. A state program “Healthcare development” was adopted and it is included in the “New quality of life” block of programs [15]. The priority national project “Health” was adopted and it aims to promote care for human health and develop sustainable beliefs of the need to adhere to a healthy lifestyle in public consciousness.
Obviously, the quality of life concept should be recognized as closely related to the definition of health according to the World Health Organization (WHO): “Health is a state of complete physical, social and mental well-being and not merely the absence of disease” [30]. In modern medicine, terms such as “health-related quality of life” and similar ones have become widespread and they help select parameters that describe health status, healthcare and the quality of medical care, from the overall concept of the quality of life. According to a contemporary paradigm of clinical medicine, health-related quality of life is at the basis of understanding of disease and determining the effectiveness of its treatment. Health-related quality of life evaluates components of this quality that are both related and not related to a disease, and allows for determining the impact of a disease and treatment on a patient’s condition [18]. International practice considers research on the quality of life to be highly informative, sensitive and economical technique to assessing health status in the population as a whole and in individual social groups [13].
Depending on the directions of research, there are several classifications of questionnaires that assess the quality of life in medicine [24]. The questionnaires can be general and specific. There are also questionnaires designed to address a particular condition or disease like asthma, rheumatoid arthritis or coronary heart disease. Unlike specific questionnaires, general ones help assess the quality of life of both the healthy and the ill regardless of the presence of a particular disease. One of the most widely used general questionnaires for assessing the quality of life is the Short Form (36) Health Survey (SF-36) [25, 28]. It includes 36 items grouped into eight scales: physical functioning, physical role functioning, bodily pain, general health perceptions, vitality, social role functioning, emotional role functioning, and mental health. The indicators in each scale vary between 0 and 100, where 100 is equivalent to no disability. The scales are grouped into two indicators: “physical health” and “mental health”.
In accordance with the above definition of health, the WHO defines quality of life as “individuals’ perception of their position in life in the context of the culture and value systems in which they live and in relation to their goals, expectations, standards and concerns” [29]. As can be seen, complexity and the subjectivity of assessments are fundamental properties of the quality of life [22].
The present article considers the formation of the structure of health quality as the most important component of the quality of life and analyzes the properties of the proposed structure. We suggest a solution to this problem by developing systematic and dynamic models for shaping and assessing health quality indicator, as well as analyzing the impact of various factors. We understand health quality as an integral characteristic of population health that combines both objective indicators (quality of medical care and the natural and social environmental factors) and subjective indicators (individual approach to health, health concerns).
A system hierarchical model for assessing health quality
Health quality indicator, as well as quality of life indicator, has a complicated structure that belongs to the class of hierarchical structures. In order to measure and assess this indicator it is necessary to determine what components it includes. Having analyzed the
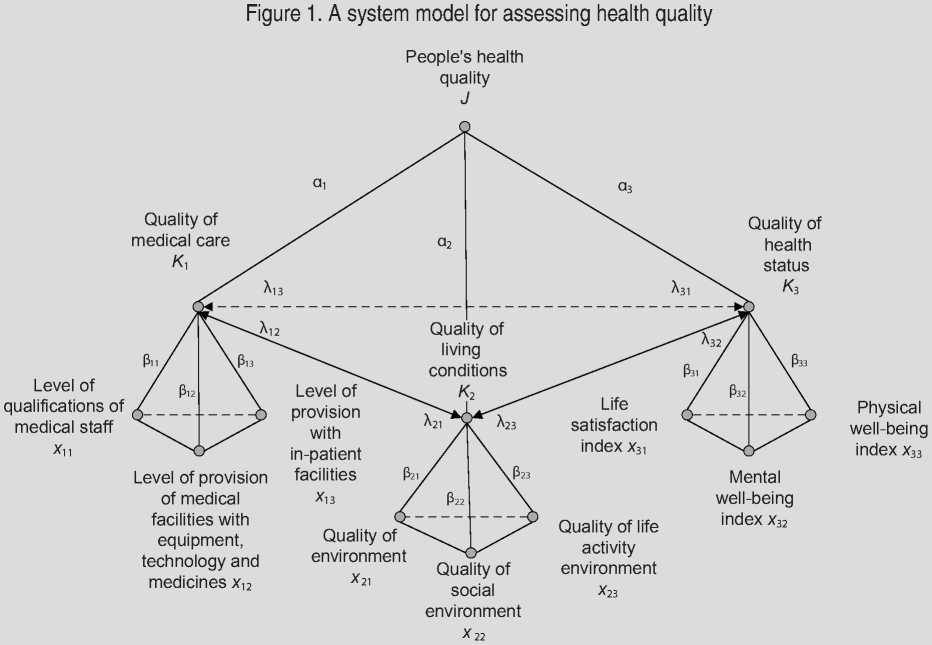
works of domestic and foreign researchers [12, 14, 20, 26], the data of the Federal State Statistics Service and findings of sociological surveys [6, 8, 11] we identified three interrelated components (system indicators) within the structure of the integrated indicator of health quality ( J ). these components are quality of medical care ( K 1), quality of living conditions (K2) and health quality ( K 3) ( Fig. 1 ).
Each component in turn can be decomposed and presented as triads of interrelated objective and subjective indicators of the lower level (specific indicators). Specific indicators can be identified on the basis of official statistical data and on the basis of sociological surveys conducted, for example, by the Russian Public Opinion Research Center (VTsIOM).
The system indicator “quality of medical care” ( K 1) has three specific indicators: “qualifications of medical staff” ( x 11), “provision of medical institutions with equipment and medicines” ( x 12) and “number of in-patient facilities” ( x 13). The system indicator “quality of living conditions” is formed by specific indicators such as “quality of environment” ( x 21), “quality of social environment” ( x 22) and “quality of life activity environment” ( x 23); the system indicator “quality of health status” consists of specific indicators such as “life satisfaction index” ( x 31), “mental wellbeing index” ( x 32) and “physical well-being index” ( x 33).
The integral index of health quality J can be calculated as the weighted sum of its components (system parameters):
where K 1 is the quality of medical care;
K 2 is the quality of living conditions;
K 3 is the quality of health status;
« 1 , « 2 , « 3 — weight coefficients that characterize the significance of component Ki and defined by experts, in this case ^3=1« = 1 .
The change in integral index J is described by the following differential equation:
dj
— = -J + « 1 K 1 + a2K2 + a3K3. (2)
dt
Here and in the future it is expected to change the parameters according to the exponential law, which allows us to generate a state space of these parameters and to evaluate with the help of known methods the stability of the parameters in this space under the influence of external factors.
In order to calculate system indicators Ki we solve the system of equations:
(Ki = A i2 K 2 + A 13 K 3 + K i0 , j K2 = A21K1 + A23K3 + K20 , (3)
I K3 = A31K1 + A32K2 + K30, where Ki0, i = 1,3 — initial values of Ki defined by private parameters;
A fy , i + j — weight coefficients characterizing the mutual influence of the components of Ki and defined by experts. We believe that A i =0,05, then the effect is weak, A i. =0,1, then the effect is strong.
Taking into account the dynamics of the interaction of the system indicators Ki can be recorded in the following way:
Г К1 = -К1 + ^12^2 + ^-13^3 + К10, j К = -^2 + ^21^1 + ^23^3 + ^20, (4) IКз = -Кз + Лз1^1 + Лз2^2 + ^30, where К =---- is the rate of change in the
1 dt i-th system indicator.
The initial value Ki 0 can be computed as the weighted sum of respective specific indicators xi 1, xi 2, xi 3:
К о = РцХц + P 12 X 12 + P i3 X i3 , (5)
where P— weight coefficients characterizing the relative importance of specific indicators xi 1 , xi 2 , xi 3 and defined by experts, in this case iWu = 1 .
In order to calculate specific indicators xi 1, xi 2, xi 3 we solve the system of equations:
(Xu = k12Xt2 + k13Xt3 + X^, j Xt2 = k21Xt1 + k23Xt3 + X02, (6)
(Xt3 = k31Xn + k32Xt2 + X^, where k^j, i ^ j — weight coefficients characterizing the mutual influence of indicators xi1, xi2, xi3 , the numerical values of which are determined by experts;
X t0i , X t 0 2 , X t 0 3 — the initial values of indicators xi 1, xi 2, xi 3 at a given point in time.
The interaction dynamics of the specific indicators is described by the following differential equations:
Г Xu = -Xn + k 12 Xt 2 + k 13 Xt 3 + X 01 , j Xi2 = -Xi2 + k21XH + k23Xi3 + X °2 , (7) к Xi3 = -Xi3 + k31Xi1 + k32Xi2 + X i03 -
The interaction between specific indicators of individual components of the integral indicator of health quality can be represented in the form of a cognitive model in which private indicators are concepts and the mutual influence of indicators is reflected in the relations with weight coefficients that characterize the degree (strength) of influence. Let us consider the dynamics of interaction between specific indicators of component (system parameter) K 1 – “quality of medical care”.
Modern medicine cannot do without high technology and skilled personnel able to effectively use the achievements of modern medical science and technological progress. Therefore, major factors determining the quality of medical care are, first, the qualifications of medical personnel that is to provide timely and effective assistance, and second, the provision of public medical institutions with equipment and medicines; third, how timely and fully medical assistance is provided, which is reflected primarily in the presence of a sufficient number of in-patient facilities.
The interaction between these factors determining the “quality of medical care” component is presented in the form of a cognitive model, the concepts of which are presented by specific indicators: “qualifications of medical staff” (x11), provision of medical institutions with equipment and medicines” (x12) and “number of in-patient facilities” (x13); and the mutual influence of these indicators is presented in the form of links with relevant weight coefficients that characterize the degree (strength) of influence (Fig. 2). For example, the use of modern medical equipment and technology requires an appropriate level of qualification on the part of medical staff (coefficient ). The opposite effect is reflected in the relationship with coefficient k21.
Figure 2. Cognitive model of interaction between specific indicators of component K 1 – “quality of medical care”
Quality of medical care
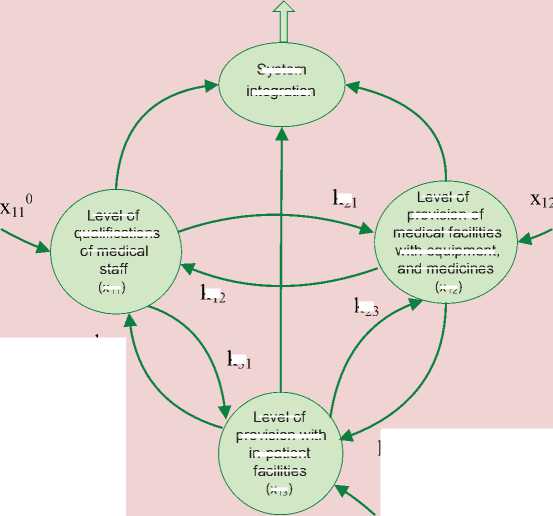
к21
к12
к23
к31
System integration
Level of provision with in-patient facilities
(x 13 )
Level of qualifications of medical staff
(x 11 )
Level of provision of medical facilities with equipment, and medicines
(x 12 )
к13
к32
0 х130
Mathematical model of interaction between indicators in this component is presented as a system of differential equations.
The equation describing the rate of increase of the level of qualification of medical staff ( x 11) depending on the level of provision of medical institutions with equipment and medicines ( x 12), the level of provision with in-patient facilities ( x 13) and initial level of skills ( хЦ ), is as follows:
x11
-Хц
+ k12x
+ k i 3x
+ xii .
The equation describing the rate of increase of the level of provision of medical institutions with equipment and medicines ( x 12), depending on the qualifications of medical staff ( x 11), the level of provision with in-patient facilities ( x 13) and the initial level of provision with equipment ( x 22 ) is as follows:
Х 12 = ^ 21 Х 11 - Х 12 + ^ 23 Х 13 + Х 22 .
The equation describing the rate of increase of the level of provision with inpatient facilities ( x 13) depending on the qualifications of medical staff ( x 11), the level of provision of medical institutions with equipment and medicines ( x 12) and the initial level of provision with in-patient facilities ( x f3 ) is as follows:
x13
— ^ 31x11 + к32Х12 x13 + x13 .
The dynamics of interaction between specific indicators of components of K 2 – “quality of living conditions” and K 3 – “quality of health status” that are included in the integrated indicator of health-related quality of life are described similarly to the dynamics of the interaction between specific indicators of component K 1 – “quality of medical care”.
Thus, we have developed a system hierarchical dynamic model for assessing people’s health quality. The advantage of the proposed model is the spatial structure of the integral indicator of health quality, which takes into account the links between system indicators at the median level and between specific indicators at the lower level. The dynamic model allows for assessing the stability of movement of indicators of the system under the influence of external factors.
Evaluation of the integral indicator of people’s health quality
When calculating the integral indicator, the following assumptions were made.
1. The values of weight coefficients characterizing the significance of system indicators K i , coefficients p i. describing the importance of specific indicators xi 1, xi 2, xi 3, coefficients XM characterizing the mutual influence of system indicators and coefficients ki j describing the mutual influence of specific indicators are defined by experts and do not change.
-
2. The initial values of specific indicators are defined by experts, because the valuation of initial statistics or data of sociological surveys is a separate issue and is not considered in the present work.
-
3. When evaluating an integral indicator of quality of health in these situations we did not take into account the dynamics of change in specific and system indicators, but took into account their static values. We used the method of cognitive analysis.
Let us take « 1 =0.2, « 2 =0.3, « 3 =0.5, i.e. in order to calculate the integral index, we assume the indicator “quality of health status” ( K 3) to be most important, the indicators “quality of living conditions” ( K 2) and “quality of medical care” ( K 1) – less important.
Let us take the values of weight coefficients characterizing the mutual influence of system indicators as equal to: X 12=0.01, X 21=0.01, X 13=0.01, X 31=0.05, X 23=0.01, X 32=0.05, i.e. we assume that the quality of health status is influenced by the quality of living conditions and by the quality of medical care, as fore other relationships between system indicators, we shall consider them as weak.
The weight coefficients that characterize the significance of specific indicators in the system parameter K1 are taken equal to: 311=0.4, p12=0.3, p13=0.3, i.e. the indicator “qualifications of medical staff” is more important for the quality of medical care than “the level of provision of medical institutions with equipment and medicines” and “the level of provision with in-patient facilities”.
Weight coefficients that characterize the significance of specific indicators in the system parameter K 2 are taken equal to 3 21 =0.5, 3 22 =0.2, 3 23 =0.3, i.e. the quality of the environment is the most important indicator for the indicator of the quality of living conditions in comparison to the indicators of the quality of social environment and life activity environment.
Weight coefficients that characterize the significance of specific indicators in the system parameter K 3 are taken equal to P 31=0.6, 3 32 =0.2, p 33=0.2, i.e. life satisfaction index is more important for the indicator of the quality of health status, as for mental and physical well-being indicators, they are less important.
Coefficients of the mutual influence of specific indicators within system indicators K 1 – “quality of medical care”, K 2 – “quality of living conditions”, K 3 – “quality of health status” are assumed as equal to k 12=0.05, k 13=0.05, k 21=0.05, k 23=0.05, k 31=0.05, k 32=0.05.
Let us evaluate integral index J “health quality” for different situations.
Situation 1 – low level of health quality. This situation is characterized by low values of specific indicators: low level of qualifications of medical staff, poor provision of medical facilities with equipment and medicines, poor provision with in-patient facilities, poor environmental conditions, low quality of social environment, low quality of life activity environment, low indices of life satisfaction, physical and mental wellbeing. The set of current values of specific indicators M1={(0.05,0.1,0.15),(0.1,0.15,0.1), (0.1,0.15,0.1)} corresponds to this situation, i.e. x101 =0.05, x102 =0.1, x103 =0.15, x201 =0.1, x202 =0.15, x203 =0.1, x301 =0.1, x302 =0.15, x303 =0.1.
Let us calculate the values of specific indicators according to the formula (7) and the current values of system indicators according to the formula (5):
x 11=0.06, x 12=0.11, x 13=0.16, K 10=0.1. x 21=0.11, x 22=0.16, x 23=0.11, K 20=0.12. x 31=0.11, x 32=0.16, x 33=0.11, K 30=0.12.
Let us calculate the values of system indicators using the formula (4):
K 1=0.11, K 2=0.13, K 3=0.14.
Then the value of the integral indicator calculated by the formula (1) will be equal to J =0.13.
Situation 2 – high level of health quality. This situation is characterized by high values of specific indicators: high level of qualifications of medical staff, adequate provision of medical institutions with equipment and medicines, adequate provision with in-patient facilities, healthy environment, high quality of social environment, high quality of life activity environment, high indices of satisfaction with life and physical and mental wellbeing. The set of current values of specific indicators M2={(0.9,0.85,0.8),(0.8,0.85, 0.9),(0.9,0.85,0.8)}, i.e. x101 =0.9, x102 =0.85, x103=0.8, x201=0.8, x202=0.85, x203=0.9, x301=0.9, x302 =0.85, x303 =0.8.
In this situation, the values of specific indicators and the current values of system indicators will be as follows:
x 11=1, x 12=0.94, x 13=0.9, K 10=0.95. x 21=0.9, x 22=0.94, x 23=1, K 20=0.93. x 31=1, x 32=0.94, x 33=0.9, K 30=0.96.
K 1=0.97, K 2=0.96, K 3=1.1.
Then the value of the integral indicator will be equal to J =1.0.
We note that the situations described above define a “corridor” of values of the integral indicator, which the rest of the situations “fit in”. Under the given parameter values, the lower value of the integral indicator is equal to J min=0.13, the upper value – to J max=1.0. This “corridor” can be divided into zones corresponding to the levels of the integral indicator “health quality”. For example, let us select the following zones: “high level”, which corresponds to the values J =0.9^1.0;; “satisfactory level”, which corresponds to the values J =0.7^0.9; “median level”, which corresponds to the values J =0.5-0.?;
“low level”, which corresponds to the values J =0.3^0.5; “unsatisfactory level”, which corresponds to the values J =0.13^0.3.
Let us consider the dynamics of the changes of specific indicators, system indicators and the integral indicator.
Situation 3 is characterized by the increase in the value of specific indicators in comparison with Situation 1 on average by 20%, i.e. Δ av=0.2. The set of values of specific indicators for this situation is as follows:
M 3={(0.25,0.3,0.35),(0.3,0.35,0.3), (0.3,0.35,0.3)}.
In this case, the value of the integral indicator is equal to J =0.36, it increased almost in three times and got into the “low” zone.
Situation 4 is characterized by the increase in the value of specific indicators in comparison with Situation 1 on average by 40%, i.e., Δ av=0.4. The set of values of specific indicators for this situation is as follows:
M 4={(0.45,0.5,0.55),(0.5,0.55,0.5), (0.5,0.55,0.5)}.
In this case, the value of the integral indicator is equal to J =0.6, it increased in almost five times and got into the “median” zone.
Situation 5 is characterized by the increase in the value of specific indicators in comparison with Situation 1 on average by
60%, i.e., Δ av=0.6. The set of values of specific indicators for this situation is as follows:
M 5={(0.65,0.7,0.75),(0.7,0.75,0.7), (0.7,0.75,0.7)}.
In this case, the value of the integral indicator is equal to J =0.8, it increased in more than six times and got into the “satisfactory” zone.
Situation 6 is characterized by a sharp drop in the values of specific indicators of the system parameter K 3 – “quality of health status”, i.e., Δ av=-0.65, which is connected, for example, with the occurrence of any epidemic disease. The set of values of specific indicators for this situation is as follows:
M 6={(0.65,0.7,0.75),(0.7,0.75,0.7), (0.05,0.1,0.05)}.
In this case, the value of the integral indicator is equal to J =0.47, it decreased almost in two times compared to the previous level, and got into the “low” zone.
Situation 7 is characterized by an increase in the values of specific indicators in the system indicator K 1 – “quality of medical care” that describes the efforts to eliminate the epidemic. The set of values of specific indicators for this situation is as follows:
M 7={(0.8,0.9,0.9),(0.7,0.75,0.7),
(0.05,0.1,0.05)}.
1,2
Figure 3. Dynamics of change of the integral indicator J – health quality
0,8
0,6
0,4
0,2
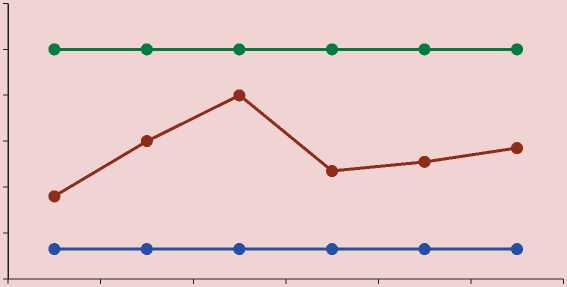
I • Jmin • J • Jmax
In this case, the value of the integral indicator is equal to J =0.51, it increased by 8.5% compared to the previous level, and fell into the “median” zone.
Situation 8 is characterized by a slight increase in the values of specific indicators in the system indicator K 3 – “health quality”, i.e., Δ av =0.1, which describes the restoration of people’s health after the epidemic. The set of values of specific indicators for this situation is as follows:
M 8={(0.65,0.7,0.75),(0.7,0.75,0.7), (0.15,0.2,0.15)}.
In this case, the value of the integral indicator increased to J =0.57.
The dynamics of change of the integral indicator for the sets of values of specific indicators characterizing the situations considered above is represented in Figure 3.
Thus, we studied the influence of changes in particular indicators on the dynamics of the integral indicator of the quality of life under the influence of various factors; that is, the trend of the integral indicator was determined. This approach can be used in practice when evaluating the effectiveness of control factors that are formed by supervising structures.
Conclusion
The system hierarchical dynamic model for assessing people’s health quality was developed. A specific feature of the proposed model is the spatial structure of the integral indicator, which allows for taking into consideration the links between system indicators at the median level and between specific indicators at the lower level.
The calculations of the integral indicator of health quality were made; they helped identify the range of variation of the integral indicator and the zones corresponding to different levels of the indicator. Studying the influence of change in particular indicators on the integral indicator of health quality under the impact of various factors allowed us to reveal trends in its changes. In this case, we can distinguish the impact of control factors, which is very important in assessing the effectiveness of decisions taken by relevant authorities.
Further studies can aim, first, to analyze the impact of an extended list of indicators on assessing the integral indicator of health quality; second, to analyze possibilities of applying statistical analysis of specific indicators to quantify the strength of linkages between them; third, to use the model for assessing the integral indicator of health quality as a dynamic object of management to make efficient management decisions.
References Quality of life: analyzing the impact of factors related to health, based on system and mathematical models
- Aivazyan S.A. Analiz kachestva i obraza zhizni naseleniya . Moscow: Nauka, 2012. 432 p..
- "Baier Barometr": rossiyane o kachestve zhizni . Available at: https://wciom.ru/fileadmin/file/reports_conferences/2014/2014-04-17-kachestvo-zhizni.pdf..
- Barsukov V.N., Kalachikova O.N. Issledovanie kachestva zhizni starshego pokoleniya: regional'nyi opyt Ekonomicheskie i sotsial'nye peremeny: fakty, tendentsii, prognoz , 2016, no. 4 (46), pp. 88-107. DOI: 10.15838/esc/2016.4.46.5
- Boitsov B.V., Kryanev O.V., Kuznetsov M.A. Kachestvo zhizni . Moscow: Izd-vo MAI, 2004. 268 p..
- Denisov N.A. Kachestvo zhizni naseleniya razlichnykh regionov Rossii . Uroven' zhizni naseleniya regionov Rossii , 2002, no. 2, pp. 23-35..
- Dostupnost' i kachestvo rossiiskogo zdravookhraneniya: otsenki patsientov . Available at: https://wciom.ru/fileadmin/file/reports_conferences/2015/2015-09-02-zdravoohranenie.pdf..
- Zarakovskii G.M. Kachestvo zhizni naseleniya Rossii: psikhologicheskie sostavlyayushchie . Moscow: Smysl, 2009. 319 p..
- Zdravookhranenie v Rossii -2015 . Available at: http://www.gks.ru/bgd/regl/b15_34/Main.htm..
- Il'yasov B.G., Gerasimova I.B., Zakieva E.Sh. Sistemnyi podkhod k postroeniyu kognitivnoi modeli kachestva zhizni . Voprosy sovremennoi nauki i praktiki , 2013, no. 3 (47), pp. 214-221..
- Il'yasov B.G., Gerasimova I.B., Makarova E.A., Zakieva E.Sh. Ob"ektivno-sub"ektivnyi podkhod k otsenke kachestva zhizni . Kachestvo. Innovatsii. Obrazovanie , 2016, no. 2 (129), pp. 47-57..
- Itogi kompleksnogo nablyudeniya uslovii zhizni naseleniya Respubliki Bashkortostan v 2014 godu . Available at: http://bashstat.gks.ru/wps/wcm/connect/rosstat_ts/bashstat/resources/9572f5804e7bc103bb5afb0d534aab22/kouzh.html..
- Malanicheva N.A. Zdorov'e naseleniya krupnogo goroda: tendentsii i riski . Ekonomicheskie i sotsial'nye peremeny: fakty, tendentsii, prognoz , 2011, no. 5 (17), pp. 147-153..
- Novik A.A., Ionova T.I. Rukovodstvo po issledovaniyu kachestva zhizni v meditsine . Moscow, 2007. 320 p..
- Prokhorov B.B., Gorshkova I.V., Tarasova E.V. Usloviya zhizni naseleniya i obshchestvennoe zdorov'e . Problemy prognozirovaniya , 2003, no. 5, pp.127-139..
- Rasporyazhenie Pravitel'stva RF ot 11.11.2010 № 1950-r (red. ot 13.10.2016) "Ob utverzhdenii perechnya gosudarstvennykh programm Rossiiskoi Federatsii" . Available at: http://www.consultant.ru/document/cons_doc_LAW_106979/..
- Rossoshanskii A.I., Chekmareva E.A. Sovremennoe sostoyanie i razvitie teorii i metodologii issledovaniya kachestva zhizni naseleniya . Problemy razvitiya territorii , 2016, no. 1 (81), pp. 145-159...
- Subetto A.I. Kachestvo zhizni: grani problemy . Kostroma, 2004. 256 p..
- Surmach M.Yu. Kachestvo zhizni, svyazannoe so zdorov'em, kak predmet izucheniya sotsiologii meditsiny . Sotsiologiya , 2011, no. 2, pp. 100-104..
- Ukaz Prezidenta Rossiiskoi Federatsii ot 31.12.2015 g. № 683 "O Strategii natsional'noi bezopasnosti Rossiiskoi Federatsii" . Available at: http://kremlin.ru/acts/bank/40391/page/1..
- Shabunova A.A., Fakhradova L.N. Prichiny i faktory rasprostraneniya serdechno-sosudistykh zabolevanii v Vologodskoi oblasti (po dannym issledovaniya ESSE-RF) Ekonomicheskie i sotsial'nye peremeny: fakty, tendentsii, prognoz , 2015, no. 1 (37), pp. 134-149. DOI: 10.15838/esc/2015.1.37.9
- Better Life Index. Available at: http://www.oecdbetterlifeindex.org/ru/countries/russian-federation-ru
- Cella D.F. Quality of Life: concepts and definition. Journal of Pain and Symptom Management, 1994, vol. 9, no. 3, pp. 186-192.
- Hicks S. New approaches to the measurement of Quality of Life. Available at: https://www.destatis.de/EN/AboutUs/Events/DGINS/Document_PaperONS_UK.pdf? blob=publicationFile
- McDowell I. Measuring Health: A Guide to Rating Scales and Questionnaires. Oxford University Press, 2006. 768 p.
- Jenkinson С., Coulter A., Wright L. Short form 36 (SF-36) health survey questionnaire: normative data for adults of working age. BMJ, 1993, vol. 306, pp. 1437-1440.
- Noll H.H., Zapf W. Social indicators research: Societal monitoring and social reporting. Trends and Perspectives in Empirical Social Research. Berlin; New York, 1994. Pp. 1-16.
- Quality of life index: The Economist Intelligence Unit`s quality of life index. Available at: http://www.economist.com/media/pdf/QUALITY_OF_LIFE.pdf
- Ware J.E., Kosinski M., Keller S.D. SF-36 Physical and Mental Health Summary Scales: A User`s Manual. The Health Institute, New England Medical Center. Boston, Mass. 1994.
- WHOQOL Group. The development of the WHO quality of life assessment instruments (the WHOQOL). In: Orley J, Kuyken W. (Eds.). Quality of life assessment: international perspectives. Berlin, 1994. Рp. 41-57.
- World Health Organization. Cancer pain relief. Geneva: WHO, 1986. Pp. 5-26.
