Quantitative Analysis of Socio-Economic Determinants of Adult Income Using Machine Learning Techniques

Author: Sabrina Akter, Sadia Enam, Md. Moshiur Rahman, Fahmida Ahmed Antara
Journal: International Journal of Information Engineering and Electronic Business @ijieeb
Article in issue: 6 vol.17, 2025.
Free access
Income inequality is a persistent issue in both developed and developing economies, influenced by complex socio-economic factors such as education, occupation, and gender. This study addresses a critical gap by applying advanced machine learning techniques to analyze the socio-economic determinants of income in Bangladesh and global contexts. The primary objectives were to identify the most influential factors affecting income and assess the effectiveness of various machine learning models in predicting income levels. Using datasets from Bangladesh and global sources, this study employed Random Forest, Gradient Boosting, Logistic Regression, and Support Vector Machines to predict income and assess feature importance. Key findings showed that education, occupation, gender and hours worked per week were the most significant predictors of income. The Bangladeshi dataset highlighted limited access to higher education and pronounced gender disparities, while the global dataset reflected gender pay gaps and more equitable educational access. Random Forest Classifier appeared as the most effective model, achieving 100% accuracy in Bangladesh and 96% accuracy globally. These findings underscore the need for targeted policies to improve educational access, promote vocational training, and address gender inequality to reduce income disparities. Additionally, the study demonstrates the potential of machine learning to uncover non-linear relationships in socio-economic data, providing valuable insights for evidence-based policymaking. This research highlights the importance of integrating advanced data-driven methods to address the socio-economic drivers of income inequality and promote inclusive economic growth.
Socioeconomic, Income Prediction, Exploratory Data Analysis, Economic Inequality, Gender Disparities
Short address: https://sciup.org/15020067
IDR: 15020067 | DOI: 10.5815/ijieeb.2025.06.01
Text of the scientific article Quantitative Analysis of Socio-Economic Determinants of Adult Income Using Machine Learning Techniques
Published Online on December 8, 2025 by MECS Press
In both developed and developing countries, income disparity has been a recurring problem, with socioeconomic factors significantly influencing people's incomes. The literature has extensively documented how schooling affects income levels. Individuals with greater levels of education typically earn more money overall and throughout their lives, according to numerous studies [1]. According to [2], women and racial minorities experience systemic discrimination in the workplace, which leads to lower salaries than their male and white colleagues. This is another example of how gender and race continue to be important determinants of income. However, regional variations in income disparity and its causes can be substantial. In contrast to research conducted in industrialized nations, which concentrate on characteristics like education, occupation, and technological innovation, income disparity in developing nations like Bangladesh may be influenced by a variety of factors, including gender norms, rural-urban migration, and educational access [3].
Researching the connections between these socioeconomic characteristics and income has become easier because of developments in data science, especially machine learning (ML) [4]. Machine learning approaches can demonstrate better accuracy, robustness, and adaptability than conventional econometric models. Forecasting accuracy is frequently assessed using metrics like Mean Absolute Error (MAE), Mean Squared Error (MSE), and Root Mean Squared Error (RMSE), with machine learning models frequently producing lower error numbers [5]. Machine learning algorithms can successfully identify complicated non-linear relationships in macroeconomic data, in contrast to traditional models like ARIMA and VAR, which may overlook such relationships [6]. By more effectively adjusting to structural changes, they also show increased resilience in a range of economic situations, including recessions and expansions. For predicting income levels, techniques such as support vector machines, decision trees, and random forests have proven particularly effective because they look at multiple aspects at once [7]. These methods not only increase forecast accuracy but also provide a more in-depth understanding of the causes of income inequality. Comprehensive studies utilizing modern machine learning techniques to analyze the combined impact of multiple socioeconomic factors on income remain scarce in Bangladesh. Considering the socio-economic scenario of Bangladesh associated with gender discrimination, rural-urban divides and uneven facilities regrading education, machine learning can be an effective tool to statistical techniques [8]. As ML techniques are suitable for revealing hidden patterns in heterogenous data, they are perfect for analyzing different aspects of income determinants in Bangladesh. This research aims to bridge this gap by applying machine learning methods to two datasets representing distinct geographic and socioeconomic contexts—Bangladesh and global data. The study's specific objectives are outlined below.
• To determine the socioeconomic factors that influence adult income in Bangladesh and globally by utilizing machine learning techniques to examine characteristics including education, age, gender, and employment hours.
• To find the machine learning model that predicts income the best by applying and contrasting several models (such as logistic regression, gradient boosting, random forests, and support vector machines).
• To assess how socioeconomic factors and income levels relate to one another and investigate the ways in which these factors work together to predict income.
2. Literature Review
This study examines the socioeconomic determinants of income in Bangladesh and a worldwide setting, shedding light on the distinct and similar elements that affect income.
For Bangladesh, this study provides insights into how education, occupation, gender, and other socio-economic variables affect income in a developing country. Given the country’s ongoing economic development and sociopolitical challenges, understanding these factors can help inform policies aimed at reducing poverty and increasing economic mobility. Research on the global dataset can reveal trends that are applicable to other economies, bringing to light global challenges and patterns like the gender pay gap and income disparity based on educational attainment.
One of the most important determinants of income is frequently thought to be education. Higher educational attainment is often associated with higher salaries and better career possibilities, according to numerous studies. According to [1], nations that invest in education frequently see higher rates of economic growth and less wealth inequality, making education a key factor in economic development. This aligns with [9], who discovered that in Cameroon, there was a consistent positive correlation between educational attainment and salary differences, with those with more education earning more money. According to [10], there are notable socioeconomic disparities in Bangladesh's access to high-quality education, which restricts people in less developed areas' ability to move up the income scale. In Bangladesh and around the world, education is still a major factor in determining wealth, but the differences in access to education between developed and developing nations can make income inequality worse.
High technical or management skill professions provide much greater income returns, especially in developed economies where these roles are in high demand, according to [11]. A sizable section of Bangladesh's workforce works in low-paying informal industries or in agriculture. In his examination of the Adult Income dataset, although they are still relatively rare in Bangladesh, jobs in the industrial and service sectors have greater potential for income growth than those in agriculture [7]. Occupation and skill specialization are thus crucial factors in income determination, but regional disparities make it harder for individuals in developing countries like Bangladesh to access high-paying jobs.
Around the world, there is still gender disparity in pay, with women frequently receiving lower salaries than males for equivalent training and positions This topic has been extensively researched; [12] demonstrate that academic women continue to earn much less than men, even after controlling for factors like degree and experience. In Bangladesh, women face even greater barriers to economic participation, especially in rural areas. [2] observed that women in Bangladesh are often concentrated in informal, low-paying sectors with fewer opportunities for career advancement.
In developed economies, economic discrepancies by race and ethnicity are more noticeable. Systemic racial discrimination, particularly in the workplace, where minority groups are frequently underrepresented in higher-paying industries and leadership roles, exacerbates wealth inequality, as [13] explains. Indigenous groups and other ethnic minorities in Bangladesh experience comparable difficulties, as prejudice and restricted access to jobs and education hinder their ability to advance economically. These communities frequently miss out on the advantages of industrialization, which leaves them with little opportunities for economic advancement and lower-paying work in the informal sector [14].
Income prediction problems have seen extensive use of machine learning, especially in datasets containing a variety of socioeconomic characteristics. For instance, the authors of [5] showed how well decision trees and random forests predict income levels depending on socioeconomic characteristics such as occupation, hours worked, and education. To improve prediction accuracy, random forests—which combine several decision trees—are especially good at capturing intricate relationships between elements. For classification tasks, the objective is to predict whether an individual earns more than or less a specific income level (e.g., $50,000), support vector machines (SVM) and gradient boosting machines (GBM) are also frequently utilized. These approaches, which frequently outperform more straightforward models like logistic regression, have demonstrated great potential in capturing the non-linear correlations between socioeconomic variables and income [15].
Income prediction problems have seen extensive use of machine learning, especially in datasets containing a variety of socioeconomic characteristics. Machine learning models is used to study how educational attainment impacts poverty reduction across different racial groups in the U.S., finding that the returns on education were lower for certain minority groups [16]. Similarly, the authors in [10] used machine learning to identify how systemic discrimination in the U.S. labor market disproportionately affects racial minorities.
Most studies focus on income inequality within specific countries or regions, particularly in developed economies. There is a dearth of research comparing income inequality in developed and developing nations which mainly concentrate on the developed world (such as the United States) [9, 10]. This research work closes this gap by comparing income determinants in Bangladesh, a developing nation, and global datasets.
Research that combines machine learning techniques to compare regional income disparities is lacking, even though machine learning has been successfully used in global income studies (e.g.,[5]). Traditional methods have often been used to study socio-economic factors in isolation, without leveraging the full potential of machine learning algorithms to analyze complex, non-linear interactions between variables. In order to uncover important factors influencing income in Bangladesh and compare them to worldwide trends, this study uses machine learning models including Logistic regression, random forests, and gradient boosting.
Much research looks at how individual socioeconomic characteristics (e.g., education, gender, occupation) affect income [6, 7]. Nevertheless, not much research examines how these elements interact, particularly in various geographic contexts. For instance, Bangladesh may not have the same relationship between education, gender, and occupation as Western nations. The way these elements interact and affect income levels is examined in this proposed work.
There has been limited use of machine learning techniques on data specific to Bangladesh, despite their applicability to global datasets (e.g.,[12]). To forecast income and examine the socioeconomic elements unique to Bangladesh's labor market, this study will employ machine learning techniques on data from that country. More precise and contextually relevant insights will be possible because of this geographical focus.
Existing research on race and gender income inequality has mostly concentrated on developed economies, especially the US and Europe [2]. As a developing nation, Bangladesh offers a singular example of how issues of access to education, rural-urban migration, and gender and ethnic inequality intersect. Our research work looks at these differences in Bangladesh and contrasts them with data from around the world.
Income and socioeconomic data are frequently lacking or inaccurate in many places, including Bangladesh. There is offered a popular global adult income dataset, however there aren't many comprehensive statistics that are comparable for Bangladesh [5]. By utilizing existing datasets and meticulously preparing the data to guarantee accuracy and completeness, this work seeks to get around this restriction.
3. Methodology
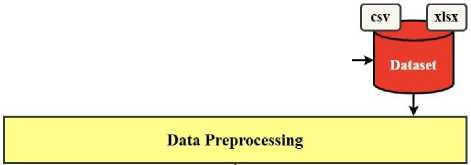
In this section, we outline the methodological framework for our Quantitative Analysis of Socio-Economic Determinants of Adult Income Using Machine Learning Techniques. Our approach involves data preprocessing, feature selection, model selection, and performance evaluation to identify the key socio-economic factors influencing adult income. We employ various machine learning algorithms to analyze patterns and predict income levels based on demographic, educational, occupational, and financial attributes. The methodology ensures robustness by incorporating data cleaning, normalization, and rigorous validation techniques. The subsequent subsections detail each step of the process, from data acquisition to model evaluation. Fig. 1 shows the overall framework of our proposed quantitative analysis of socio-economic factors influencing adult income.
The study analyzes the socioeconomic elements that affect adult income levels using a quantitative methodology and machine learning approaches. Our specific goals are to anticipate income levels using a variety of machine learning models and determine which socioeconomic factors—such as education, age, occupation, gender, race, etc. —have the most effects on income. This study makes use of two different datasets:
Dataset 1: This dataset, which includes socioeconomic characteristics including education, occupation, age, gender, and income levels, was gathered from Bangladesh using a Google survey.
Dataset 2: Contains a comparable collection of attributes but from a global perspective, this dataset is the Adult Income dataset from Kaggle [5]. These datasets comparison will provide light on how socioeconomic factors affect income in Bangladesh differently than they do globally.
-
3.1 Dataset Collection
-
3.1.1 Dataset 1: Bangladeshi Data
Dataset 1 was collected from January 2024 to March 2024 through a Google survey aimed at adults in Bangladesh. The questionnaire was created using trusted frameworks for socioeconomic and demographic surveys. It focused on key factors like education, occupation, age, gender, and income level, which were chosen based on earlier studies about income inequality, such as the work by [5]. The questions were written clearly and fairly, following standard survey design rules.
-
Public Domain
Public
Survey
V
Fetch Sample
* Remove Null values f—
Remove Duplicate
Model Evaluation
F1 Score
Feature Engineering (TF IDF)
Dataset Balancing by SMOTE г Split Dataset

Accuracy

Precision


Confusion Matrix
Fig. 1. The overall framework of our proposed quantitative analysis of socio-economic factors influencing adult income
The design was also guided by similar studies on predicting income and understanding socioeconomic factors, including the Adult Income dataset from Kaggle and national labor force surveys.
-
3.1.2 Dataset 2: Global Data from Kaggle
-
3.2 Data Preprocessing
Dataset 2 comes from Kaggle’s Adult Income dataset [5], which contains data from multiple countries but primarily from the United States. This dataset contains similar socio-economic features and income classification. In Table 1, it represents the overview of the dataset’s features.
Table 1. Overview of Datasets Feature
|
Feature |
Description |
Dataset 1 (Bangladesh) |
Dataset 2 (Global) |
|
Age |
Age of the individual |
✓ |
✓ |
|
Education |
Education level (e.g., High School, Bachelors) |
✓ |
✓ |
|
Occupation |
Occupation (e.g., Tech Support, Sales) |
✓ |
✓ |
|
Work class |
Type of employment (e.g., Private, Self-employed) |
✓ |
✓ |
|
Marital Status |
Status of marriage (e.g. Married, Unmarried) |
✓ |
✓ |
|
Relationship |
Role in the family (e.g. husband, wife etc) |
✓ |
✓ |
|
Race |
Skin tone of individual (e.g. black, white) |
✓ |
✓ |
|
Gender |
Gender of the individual (Male/Female) |
✓ |
✓ |
|
Weekly Hours Worked |
Number of hours worked per week |
✓ |
✓ |
|
Native Country |
Name of the country (e.g. USA, Peru) |
✓ |
|
|
Income |
Annual income, categorized into >50K or <=50K |
✓ |
✓ |
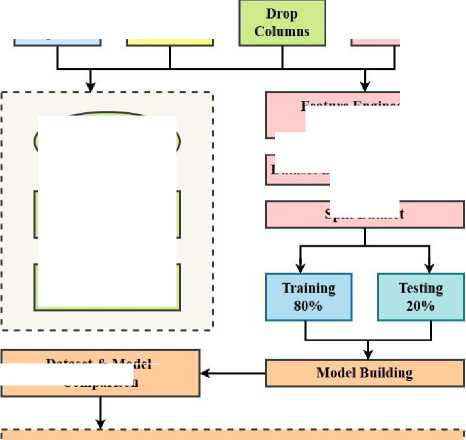
Preprocessing guarantees the data's consistency and quality, preparing it for analysis and model training. The procedure is broken down into several smaller steps, which are listed below in Fig. 2.
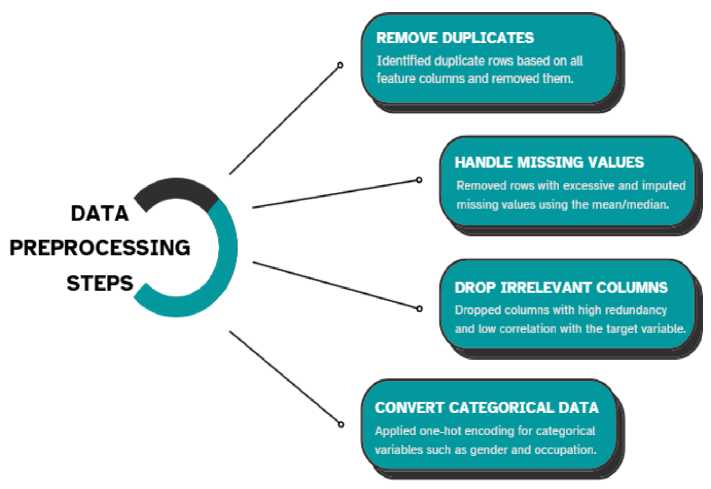
Fig. 2. Data Preprocessing Techniques
The process was initiated with removing the duplicate values to avoid the biasing of the model. The missing values are then handled by imputing mean and mediation. After that, the irrelevant columns that do not contain meaningful information for prediction such as (Name, ID, education-num, capital loss etc.) are eliminated. Finally, categorical features were converted using encoding techniques which is shown in Table 2.
Table 2. Encoding techniques for categorizing the features
|
Categorical Feature |
Encoding Method |
Reason for Selection |
|
Education Level |
Ordinal Encoding |
Education has an inherent ranking (e.g., Primary < High School < Bachelor’s < Master’s). |
|
Occupation |
One-Hot Encoding |
No inherent ranking: separate binary variables prevent misleading ordinal relationships. |
|
Marital Status |
Label Encoding |
Binary variable (Married = 1, Unmarried = 0) simplifies the feature. |
|
Employment Type |
One-Hot Encoding |
Government, Private, and Self-Employed were encoded as separate binary features. |
-
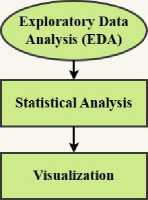
3.3 Exploratory Data Analysis (EDA)
Exploratory Data Analysis (EDA) ensured a thorough understanding of the dataset before applying any models [17]. Descriptive statistics such as mean, median, standard deviation, skewness, and kurtosis provided insights into workforce demographics and income differences. To ensure transparency in our statistical analysis, we outlined the mathematical formulations used to compute descriptive statistics, including mean, median, variance, standard deviation, skewness, and kurtosis.
Mean (Arithmetic Average): Represented the central value of the dataset.
*—
Median (Middle Value): The middle value in sorted data, resistant to outliers.
^
=
Г Xn+ i ,
I
2 2+1
V 2
,
odd even Variance (Dispersion Measure): Measured how far data points deviate from the mean. Higher values indicate more spread.
°2 —
^. ,^-X)
2
Standard Deviation: Square root of variance, measuring data spread around the mean. Skewness (Asymmetry Measure): Calculates the symmetry of distribution. The skewness>0 is referred to right skewed while skewness<0 is called left-skewed.
_ e£
JX-*)3
^ Kurtosis (Tail Heaviness): Describes the peak and tail behavior of the distribution. K>3 (heavy tails), K<3 (light tails). „ Z^CX-x)4
к
— -----7----
3.4 Feature Engineering
3.4.1 Feature Selection
This section described the feature selection process, categorical encoding techniques, and feature scaling methods used for both datasets. Feature selection was the process of identifying the most important variables that affect income classification while reducing unnecessary complexity [18]. The following methods were used to select features:
•
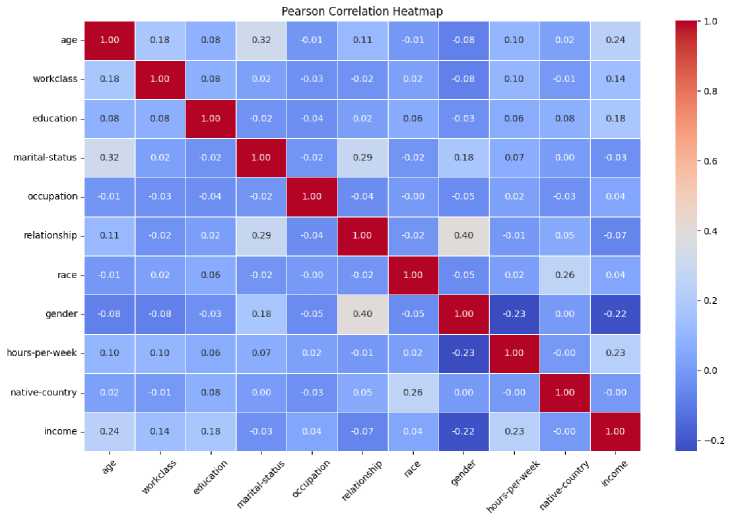
Correlation Analysis: Pearson’s correlation coefficient and heatmap visualizations helped remove redundant or weakly correlated features. The heatmap is generated with 10 features for Bangladesh dataset (“native country” feature is removed due to reduce redundancy) and 11 features for global dataset. The figures are shown in Fig. 3 and Fig. 4. Features with a correlation coefficient |r| < 0.06 and |r| < 0.1 to the target variable were excluded from Bangladeshi and global respectively. The threshold value for Bangladesh dataset is reduced to extract enough features for prediction as the correlation values of maximum feature are in between 0.03 to 0.08. Hence the features selected from this analysis are age, work class, occupation, marital status for dataset-1 while these are age, workclass, occupation, gender, weekly hours for dataset-2.
•
Domain Knowledge: Variables like age, gender, education level, occupation, and weekly working hours were chosen because prior research showed they are important for predicting income [9, 19, 20, 21].
•
Statistical Importance: Feature importance scores from Random Forest and Logistic Regression models were analyzed to rank variables based on their predictive power.
age-
Pearson Correlation Heatmap
1.00
0.04
0.00
0.00
-0.02
-0.01
-0.03
-0.01
-0.05
0.08
workclass -
0.04
1.00
-0.01
0.04
0.02
-0.05
0.05
0.04
-0.02
0.08
education -
0.00
-0.01
1.00
-0.09
0.01
0.03
0.02
-0.01
-0.03
0.00
marital-status -
0.00
0.04
-0.09
1.00
-0.02
0.08
0.05
-0.00
-0.03
-0.06
occupation -
-0.02
0.02
0.01
-0.02
1.00
0.05
-0.02
-0.05
0.05
-0.10
relationship -
-0.01
-0.05
0.03
0.08
0.05
1.00
-0.00
0.01
0.04
0.04
race -
-0.03
0.05
0.02
0.05
-0.02
-0.00
1.00
0.15
0.09
-0.01
gender -
-0.01
0.04
-0.01
-0.00
-0.05
0.01
0.15
1.00
0.02
0.04
icurs-per-week -
-0.05
-0.02
-0.03
-0.03
0.05
0.04
0.09
0.02
1.00
-0.03
income -
0.08
0.08
0.00
-0.06
-0.10
0.04
-0.01
0.04
-0.03
1.00
z
z
z
z
.e
Fig. 3. Pearson’s correlation coefficient and heatmap visualizations of dataset-1 (Bangladesh)
Fig. 4. Pearson’s correlation coefficient and heatmap visualizations of dataset-2 (Global)
3.5 Dataset Balancing
3.6 Split Dataset
3.7 Model Selection
Synthetic Minority Over-sampling Technique (SMOTE) is a technique to correct an imbalanced dataset by generating synthetic value to the minority class [22]. In this study, the imbalanced class in global dataset is being balanced by implementing SMOTE where it introduces synthetic examples for the high-income class based on featurespace similarities between existing minority instances. The dataset was initially divided into two primary subsets: Dataset = Training Set (80%) + Test Set (20%) Training Set (80%): Used for model learning by fitting patterns from the data. Test Set (20%): Used for evaluating model performance on unseen data. The split ratio was chosen following standard machine learning practices, making sure there were enough samples for both training and evaluation. Several machine learning models were chosen for their ability to handle both categorical and numerical data, as well as their suitability for classification tasks. The models used in this study are:
•
Logistic Regression: A popular baseline model for binary classification issues, including income categorization. Because of its capability of interpreting coefficients, it can be used to determine the strength and direction of relationships between income groups and attributes. The model estimates the probability of an instance belonging to a particular class using the logistic (sigmoid) function [23].
•
Random Forest Classifier: It is an ensemble model that uses bagging to aggregate several decision trees. Because it can handle both categorical and numerical data, non-linear correlations, and overfitting, it could be a good fit for this task [24].
•
Gradient Boosting (GB): By gradually teaching weak learners to fix the errors of earlier ones, gradient boosting improves prediction performance. Because of this, it is particularly effective in identifying subtle patterns in income data, where there may be complex or hierarchical relationships between variables [25].
•
Support Vector Machine (SVM): When there is a distinct margin of separation between classes, the Support Vector Machine performs best in high-dimensional spaces. It is a useful benchmark for datasets that may have overlapping class borders, albeit being less interpretable [26].
4.1 Experimental Setup
The models were chosen based on their interpretability, scalability, and performance in classification tasks. The hyperparameters are tuned using GridSearchCV. Table 3 represents the hyperparameter grid table which were tuned to validate the models. Table 3. Tuning parameters of Applied Machine Learning Models
Model Name
Hyperparameters
Values Tested
Logistic Regression
C
[0.01, 0.1, 1, 10]
Penalty
['l2']
Solver
['lbfgs']
Random Forest Classifier
n_estimators
[100, 200, 300]
max_depth
[10, 20, 30]
min_samples_split
[2, 5]
min_samples_leaf
[1, 2]
Gradient Boosting
n_estimators
[100, 200, 300]
learning_rate
[0.01, 0.1]
max_depth
[3, 5]
min_samples_split
[2, 5]
Support Vector Machine
C
[0.1, 1, 10]
kernel
['linear', 'rbf']
gamma
['scale', 'auto']
This section presents the technology implementation details followed by the testing of smart contract and proposed modules. Results are shown in this section of evaluating multiple machine learning models on Dataset 1 (Bangladeshi data) and Dataset 2 (Global data) for predicting adult income classification based on socio-economic features. The following models were evaluated: Logistic Regression, Random Forest, Support Vector Machine (SVM), and Gradient Boosting, since we have seen that most related works getting higher accuracy value with these models. AUC (Area Under Curve), F1-score, recall, accuracy, and precision were among the metrics used to evaluate performance. The purpose of the analysis is to develop a comparative picture of the effectiveness of various machine learning models in predicting income classification (greater than or less than 50K USD) and to draw insights into which socio-economic features most significantly influence income. The experiment was conducted in a Python-based environment, using scikit-learn for machine learning models, pandas for data manipulation, matplotlib and seaborn for visualization. The computations were performed on a personal laptop with the following specifications: CPU: Intel Core i7-10750H (6 cores, 12 threads, 2.6 GHz) RAM: 16 GB DDR4 Storage: 1 TB SSD OS: Windows 10 Additionally, Google Colab was used for large-scale model training, utilizing GPU acceleration for faster computation.
4.2 Performance Evaluation Matrices
4.2.1 Classification Metrics
The models were evaluated using several categorization measures to determine how well they predicted income categories. These metrics aid in assessing each model's performance by determining how well it can differentiate between the two classes. Following model training, a number of classification criteria were used to evaluate the models' performance and determine how well they predicted income categories. A more accurate and equitable assessment of the model's performance across both income groups is ensured by using all of the following criteria. The following are the main evaluation metrics used: Accuracy: The percentage of accurate forecasts the model produced. It provides a general idea of the model's performance. Accuracy = Correct Predictions Total Predictions Precision: Only accuracy cannot lead to correct prediction always [27] which makes it necessary to determine the value of precision. It is the ratio of true positive predictions to all predicted positive cases. This is useful when the cost of false positives is high. Precision = True Positives True Positives + False Positives Though the global dataset used in this study is made balanced using SMOTE, the precision is necessary to determine how many predicted high-income cases are correct. Recall: The proportion of true positive predictions among all actual positive cases. Recall is important when the cost of false negatives is high. Recall = True Positives True Positives + False Negatives F1-Score The harmonic means of precision and recall, providing a balance between the two metrics.
о
Precision× Recall
F1-Score=2×
Precision + Recall
4.2.2 Regression Metrics
4.3 Exploratory Data Analysis (EDA)
Although this study is mainly focused on classification, Mean Squared Error (MSE) and Root Mean Squared Error (RMSE) were also computed to evaluate the continuous predictions (e.g., predicting income as a continuous value). Mean Squared Error (MSE): One popular statistic for assessing regression models is the Mean Squared Error (MSE). The average squared difference between the expected and actual values is computed. Because the differences are squared, the MSE penalizes large errors more severely.
MSE
= ∑ 1=1 (
yt
- ̂ .)2
Root Mean Squared Error (RMSE): It is the square root of MSE which provides a more interpretable metric by returning the errors in the same units as the original data (e.g., dollars for income prediction).
RMSE
=√ ∑ ”=i(
У1
- ̂ / )2 (12)
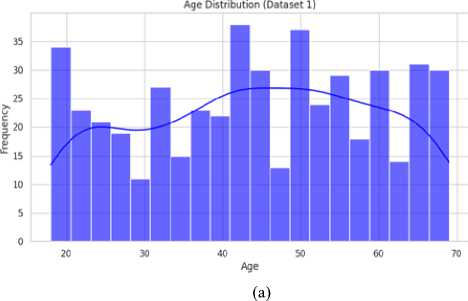
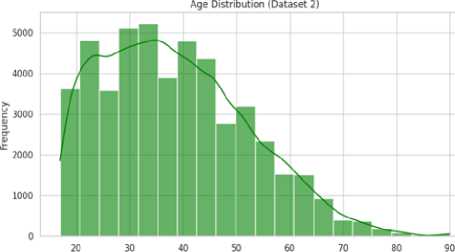
In this section, descriptive statistics were presented for key socioeconomic factors such as age, weekly working hours, and income distribution. By studying averages, variations, and how the data was spread out, insights were gained into patterns that might have affected income classification. In the Bangladesh dataset (Table 4), the average age of workers was 30.2 years, indicating a relatively young labor force, while the average weekly working hours were 45.3, which was longer compared to global trends. Both age and weekly working hours exhibited slight right skewness, suggesting that some individuals worked significantly longer hours or were in younger age groups, influencing the overall distribution. In contrast, the global dataset showed an average age of 35.1 years, reflecting a more mature labor market. The average weekly working hours were lower at 40.5, indicating a more standardized work schedule. The distribution of working hours had minimal skewness, suggesting a more balanced workforce with fewer individuals working extreme hours. Fig. 5. Age Distribution in Bangladesh (a) and Global Datasets (b) Age (b) Table 4. Descriptive Statistics of Key Features (Bangladesh vs. Global Dataset)
Dataset
Feature
Mean
Median
Standard Deviation
Skewness
Bangladesh
Age
30.2
30
8.1
0.45
Weekly Hours Worked
45.3
44
10.2
0.25
Global
Age
35.1
35
9.8
0.30
Weekly Hours Worked
40.5
40
8.5
-0.10
In the Bangladesh dataset (Fig. 5 (a)), the age distribution was slightly skewed to the right, showing a younger workforce with most people aged between 25 and 34. This meant many workers were at the beginning of their careers. In contrast, the global dataset (Fig. 5 (b)) showed a more even spread of ages, with the largest group being 35–44 years old. There’s also a longer tail toward older ages, which suggested that in developed countries, people tend to work longer. This could be due to better job stability, retirement policies, and higher life expectancy.
4.3.1 Weekly Working Hours Distribution
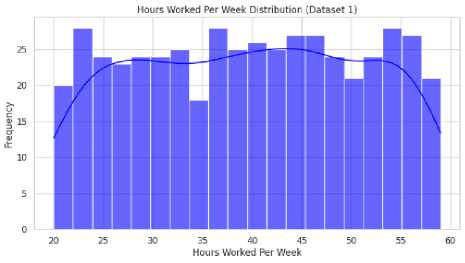
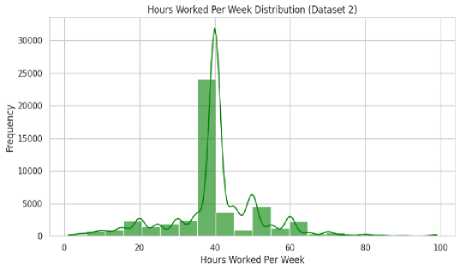
The analysis of weekly working hours provided insights into labor market structures and work-life balance conditions. In the Bangladesh dataset (Fig. 6 (a)), the distribution was relatively broad, with most individuals working 40–50 hours per week. A right-skewed tail suggested that a subset of workers exceeded 50 hours per week, likely due to informal labor conditions and overtime work without regulated policies. In contrast, the global dataset (Fig. 6 (b)) showed a more concentrated distribution around the 40-hour workweek, with a sharp peak at 40–45 hours. This indicated the presence of standardized labor regulations, particularly in developed economies, where workplace protections and employment contracts enforced maximum working hours. (a) Fig. 6. Weekly Working Hours Distribution in (a) Bangladesh (Dataset 1) and (b) Global (Dataset 2) (b)
4.3.2 Education Level Distribution
4.4 Factors Affecting Income
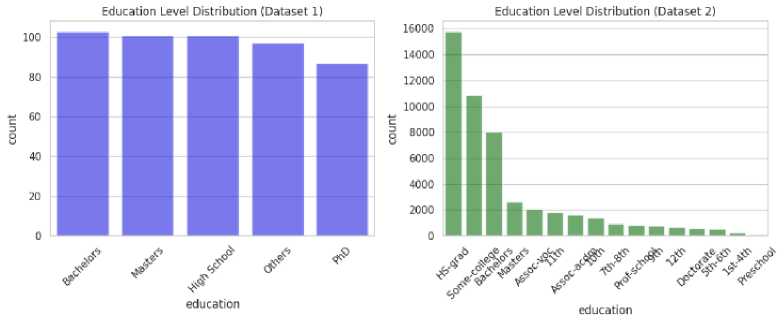
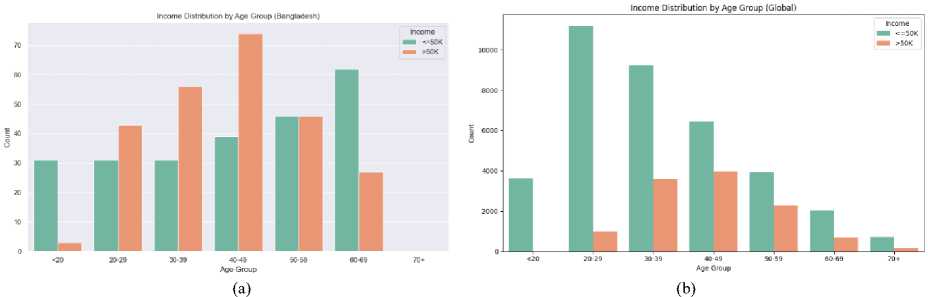
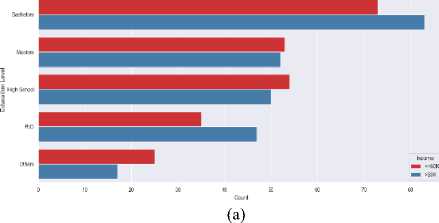
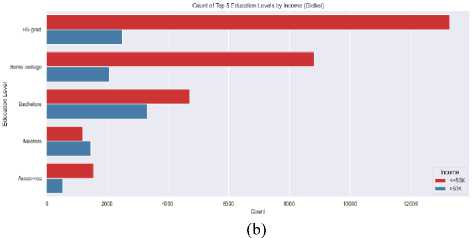
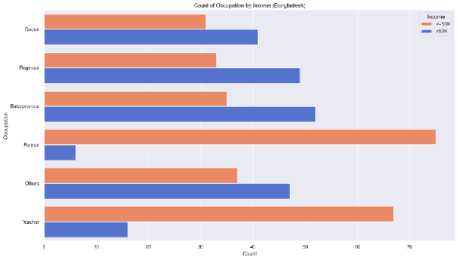
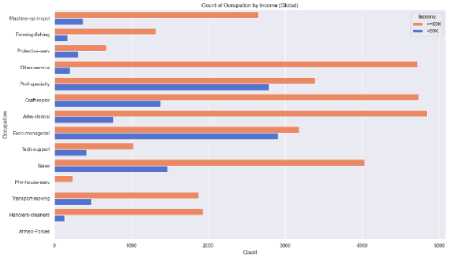
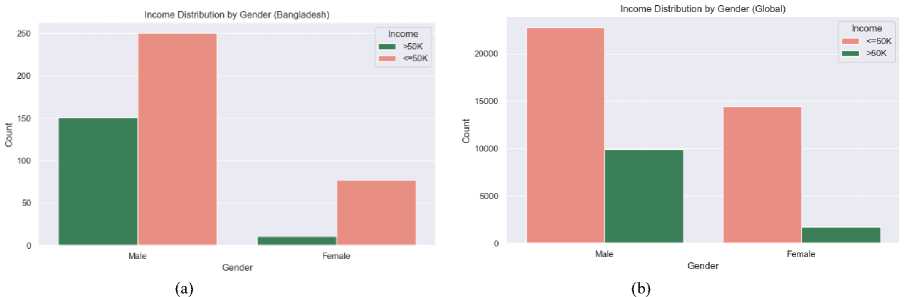
The educational attainment of a population was a key factor in determining income levels and career growth. In the Bangladesh dataset, a larger portion of individuals had secondary-level education, while fewer people had tertiary education, such as bachelor’s, master’s, or doctorate degrees. However, the global dataset showed a broader distribution, with more individuals holding tertiary degrees, especially at the bachelor’s and master’s levels which is illustrated in Fig. 7. (a) (b) Fig. 7. Education Level Distribution Across (a) Bangladesh (Dataset 1) and (b) Global (Datasets 2) The socioeconomic factors which are discussed in article 3.4 such as age, education, occupation, gender have significant influence on annual income that is shown in the following figures. Fig. 8. Income Distribution Across (a) Bangladesh (Dataset 1) and (b) Global (Datasets 2) by Age Group In fig. 8 demonstrates that in Bangladesh there is an increasing trend of number of people with age before reaching 50 and at the age between 40 to 49 there are highest number of people who have higher income than any other group. Same scenario can be observed for global dataset though the trend of number of people gets decayed with age after 30. Hence, it concludes that the early middle-aged persons have more balanced income in both cases. After age 50, the number of high-income people declines due to retirement or being less energetic. Couni Л lip i Education levels by Income (Ban^adash^ Fig. 9. Effect of Education Level on Income Across (a) Bangladesh (Dataset 1) and (b) Global (Datasets 2) by Age Group Education has a strong impact on the income of developing country like Bangladesh rather than the developed countries where work experience, skill etc are also required factors along with education. The scenario is clearly visible in fig. 9 where top five education level from each dataset is plotted. Here, in Bangladesh, the dataset (fig. 9 (a)) reveals that most people having higher income pursued bachelor degree. The people of having high school education and others show that, they are in lower income category. On the contrast fig. 9 (b), it is seen from the picture of global dataset most of the people who are high school graduated belong to lower income group. However, the number of individuals having Masters degree tend to income more than 50K USD per year is slightly higher than the low-income group. The effect of occupation income distribution across Bangladesh and other countries is pictured in Fig. 10 (a), fig. 10 (b). Though Bangladesh is an agriculture dependent country, a numerous number of farmers belongs to low-income class compared to other occupation. However, the entrepreneurs, engineers and doctors have a scope of earning more than 50K USD per year which can be seen from the fig. 10 (a). In case of global income distribution, the least difference between low and high income is observed for university professors. Apart from this, major portion of the occupations lies in low-income group. (a) Fig. 10. Relation of Occupation with Income Distribution Across (a) Bangladesh (Dataset 1) and (b) Global (Datasets 2) by Age Group (b) Fig. 11. Relation of Occupation with Income Distribution Across (a) Bangladesh (Dataset 1) and (b) Global (Datasets 2) by Age Group A clear disparity in gender in income distribution can be monitored from Fig. 11 In both datasets, the males outnumber the females by a significant percentage whether it is in terms of high-income or low income. This suggests that there exists a probability of biasness toward male gender in employment or wage structure.
4.5 ML Model Performance Analysis
4.6 ROC Curve and AUC Analysis Across Dataset
The performance of each model on Dataset 1 (Bangladesh) and Dataset 2 (Global) was evaluated based on various metrics, including accuracy, precision, recall, and F1-scores. For Dataset 1, the lowest performance having an accuracy of 55% was observed for Logistic Regression. It showed significant misclassification of high-income individuals (class 1), with precision and recall of 0.54 and 0.50, respectively, leading to a poor F1-score of 0.52 for class 1. In contrast, Random Forest performed exceptionally well with 100% accuracy, achieving perfect precision, recall, and F1-scores for both income groups, making it the top-performing model. Support Vector Machine (SVM) achieved 75% accuracy but struggled with class 1, yielding F1-scores of 0.76 for class 0 and 0.74 for class 1. Gradient Boosting also performed strongly with 90% accuracy, demonstrating balanced precision, recall, and F1-scores across both income groups, ranking second after Random Forest in terms of performance. For Dataset 2 (Global), Logistic Regression achieved an 80% accuracy but had a strong bias towards low-income individuals, with high recall (0.93) and F1-score (0.88) for class 0 but struggled with class 1, achieving only 0.39 recall and 0.49 F1-score. Random Forest outperformed all models with a 96% accuracy, excellent precision (0.97 for class 0 and 0.93 for class 1), and high recall (0.98 for class 0 and 0.91 for class 1), achieving F1-scores of 0.97 and 0.92. SVM achieved 83% accuracy but had low recall for class 1 (0.47), with F1-scores of 0.89 for class 0 and 0.57 for class 1. Gradient Boosting performed well with 84% accuracy but faced challenges with high-income individuals, reflected in lower precision (0.72), recall (0.57), and F1-score (0.63) for class 1. Performance Comparison between the Dataset is given in Table 5. Table 5. Performance Evaluation on Dataset 1(Bangladesh) and Dataset 2 (Global)
Dataset
Model
Accuracy (%)
AUC
Class
Precision
Recall
F1-Score
Bangladesh (Dataset 1)
Logistic
Regression
55%
0.61
Class 0
0.56
0.59
0.57
Class 1
0.54
0.50
0.52
Random Forest
100%
1.00
Class 0
1.00
1.00
1.00
Class 1
1.00
1.00
1.00
Gradient Boosting
90%
0.97
Class 0
0.90
0.92
0.91
Class 1
0.91
0.89
0.90
SVM
75%
0.83
Class 0
0.75
0.78
0.76
Class 1
0.76
0.72
0.74
Global (Dataset 2)
Logistic
Regression
80%
0.82
Class 0
0.83
0.93
0.88
Class 1
0.65
0.39
0.49
Random Forest
96%
0.99
Class 0
0.97
0.98
0.97
Class 1
0.93
0.91
0.92
Gradient Boosting
84%
0.90
Class 0
0.87
0.93
0.90
Class 1
0.72
0.57
0.63
SVM
83%
0.88
Class 0
0.85
0.94
0.89
Class 1
0.72
0.47
0.57
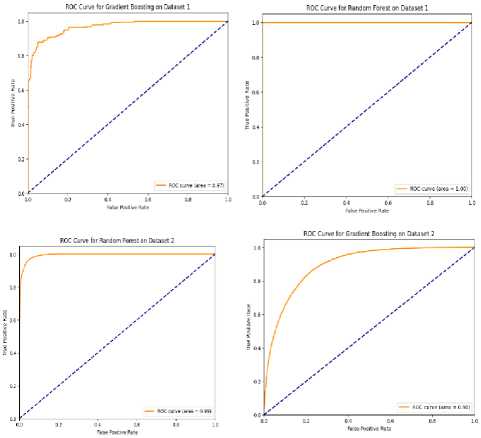
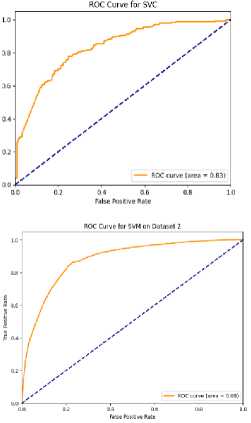
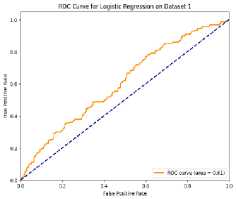
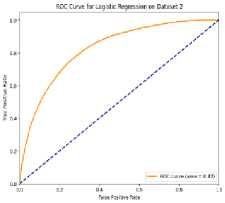
The model's capacity to differentiate between people with high and low incomes is gauged by the AUC (Area Under the ROC Curve) in the context of income classification. The range of AUC values is 1.0 (perfect discrimination) to 0.5 (no discriminative capacity). AUCs above 0.7 are generally regarded as acceptable, those above 0.8 as good, and those above 0.9 as excellent [28]. Given the class imbalance and the noisy nature of socioeconomic data, models with AUC values of 0.8 or higher in our scenario indicate good performance in predicting income class. Fig. 12. ROC Curve and AUC Analysis Across Both Datasets Fig. 12 represents the AUC (Area Under the Curve) and ROC (Receiver Operating Characteristic) curves. AUC provides a summary of the model’s ability to distinguish between classes, while the ROC curve plots the true positive rate (TPR) against the false positive rate (FPR). On Dataset 1 (Bangladesh), Random Forest achieved almost perfect performance with an AUC close to 1.0, followed by Gradient Boosting with an AUC of 0.95. SVM and Logistic Regression had lower AUC values of around 0.80 and 0.70, respectively, indicating difficulty in distinguishing income groups. For Dataset 2 (Global), Random Forest and Gradient Boosting maintained high AUCs (~0.97 and ~0.94), with Random Forest slightly outperforming Gradient Boosting. SVM and Logistic regression again had lower AUCs (~0.80 and ~0.70). Overall, Random Forest performed the best, followed by Gradient Boosting, while SVM and Logistic Regression underperformed across both datasets. 4.7 Comparison of Results Across Datasets Table 6 compares the performance of four models—Logistic Regression, Random Forest, SVM, and Gradient Boosting—across two datasets, showcasing their potential for sociological income analysis. Random Forest performed exceptionally well with perfect accuracy (100%) on Dataset 1 and high accuracy (96%) on Dataset 2, along with strong AUC scores, making it a robust model for distinguishing income categories. Table 6. Comparison of Model Performance Across Datasets
Model
Accuracy (%)
AUC
MSE
RMSE
Dataset 1
Dataset 2
Dataset 1
Dataset 2
Dataset 1
Dataset 2
Dataset 1
Dataset 2
Logistic
Regression
55.0
80.0
0.61
0.82
0.245
0.213
0.495
0.461
Random Forest
100.0
96.0
1.00
0.99
0.045
0.084
0.213
0.290
SVM
75.0
83.0
0.83
0.88
0.121
0.098
0.347
0.313
Gradient Boosting
90.0
84.0
0.97
0.90
0.069
0.112
0.263
0.335
This high performance indicates that Random Forest could effectively predict income levels based on socioeconomic factors in both local and global contexts. In contrast, Logistic Regression showed the lowest accuracy (55%) and AUC (0.61) for Dataset 1, suggesting it struggles in complex income analysis tasks where income categories are imbalanced. While SVM and Gradient Boosting performed moderately well, with SVM showing 75% accuracy on Dataset 1 and 83% on Dataset 2, and Gradient Boosting achieving 90% on Dataset 1 and 84% on Dataset 2, their AUC and MSE values indicate they can effectively capture trends in sociological income classification but with room for improvement in classifying higher-income groups. Overall, Random Forest emerged as the most reliable model for sociological income analysis, particularly in distinguishing between low and high-income individuals. The study shows how education, occupation, gender, and working hours affect income levels and points out key differences between Bangladesh and global economies. It also evaluates how well different machine learning models can predict income classification. Education was the most important factor affecting income in both datasets. Higher education levels significantly improved income prospects, which matches what previous studies have found. In Bangladesh, limited access to higher education in rural areas keeps income inequality alive. On the other hand, the global dataset showed that people with advanced degrees earned much more, proving how education helps reduce wage gaps and boost economic growth. Then, gender disparities were also clear, especially in Bangladesh, where women were mostly stuck in low-paying, informal jobs due to cultural and societal barriers. Globally, gender pay still exists but are less severe in developed countries with better labor laws and diversity policies. Again, occupation also played a big role in income. In Bangladesh, high-paying jobs were mostly in cities, leaving rural areas with fewer opportunities. Globally, however, high-paying jobs were more evenly spread out, showing better access to skilled work in developed economies. Finally, weekly working hours mattered for income. In Bangladesh, longer hours didn’t always mean higher pay, as many low-income workers put in long hours without fair wages. In contrast, the global dataset showed that regulated working hours in developed countries came with fair pay and labor protection. Our study compares Bangladeshi trends with those seen worldwide to highlight important socioeconomic factors that influence adult income. • Education was the best indicator of income in both datasets. Although there is limited access to higher education in Bangladesh's rural areas, higher education is consistently associated with higher earnings and upward mobility worldwide, particularly in developed economies. • Income inequality depending on gender is represented in both databases. Women in Bangladesh are largely restricted to low-wage, informal jobs due to cultural restrictions. Stronger labor regulations and diversity programs have produced more inclusive employment results globally, despite the wage gap still existing. • While extended workdays are typical in both situations, their effects are different. Because of Bangladesh's informal employment frameworks, working more hours frequently does not equate to earning more money. Around the world, regulated workplaces usually guarantee better worker protections and equitable compensation. Based on the factors that influenced the economy some policy recommendations have been made. These include enacting structural reforms like mentorship programs and gender quotas to lessen workplace inequality, increasing access to higher education and vocational training in rural areas, encouraging women's participation in high-paying industries to promote gender-inclusive economic growth, and enhancing rural infrastructure to lessen the pressure from urban migration. The model's insights on gender, education, occupation, and regional inequities are directly connected to each recommendation, guaranteeing that the policy implications are grounded in data and pertinent to the context. Logistic Regression, Support Vector Machine (SVM), Random Forest, and Gradient Boosting were all tested to see how well they could sort people into income groups based on socioeconomic criteria. Logistic Regression didn't do as well as the others since it couldn't find non-linear correlations and feature interactions that were already in the data. SVM performed moderately better but it was limited by how much it cost to run and how sensitive it was to changing parameters, especially on the SMOTE-balanced dataset. Gradient Boosting was able to predict well by modeling complex patterns, but it still had trouble identifying higher-income groups. In general, Random Forest was the most dependable model because it got the best accuracy and AUC ratings on all datasets. This study conducted a quantitative analysis of the socio-economic determinants of adult income using machine learning techniques, focusing on both Bangladeshi and global contexts. The findings revealed that education, occupation, and working hours were the most significant predictors of income. In Bangladesh, limited access to higher education, particularly in rural areas, emerged as a major barrier to income growth, with rural populations earning nearly 50% less than their urban counterparts. On a global scale, higher educational attainment with skill and experiences was strongly linked to better income opportunities, but gender disparities persisted, with women earning 19% less than men on average. Among the machine learning models tested, Random Forest demonstrated the highest predictive accuracy, achieving 100% on the Bangladesh dataset and 96% on the global dataset, indicating its strong generalizability across different socio-economic environments. Gradient Boosting followed closely, while Logistic Regression and Support Vector Machines (SVM) struggled with class imbalance, particularly in predicting high-income groups. These findings underscore the importance of policies aimed at improving educational access, vocational training, and gender equity to address income disparities. For Bangladesh, targeted interventions to enhance rural education accessibility and increase women's participation in high-paying sectors are crucial. Globally, tackling systemic discrimination, such as the gender pay gap and racial inequalities, remains a significant challenge in fostering economic mobility. Despite its contributions, this study has several limitations that should be considered in future research: Dataset Limitations: The small sample size in the Bangladeshi dataset restricts how far the findings may be applied and might not be broadly generalized. Future research with larger dataset will help to reach more robust conclusion. Global Dataset Representation: The global dataset was skewed toward developed nations, potentially underrepresenting income inequality in developing countries. Limited Socio-Economic Variables: Key factors such as health, social networks, and environmental conditions were not included but could provide deeper insights into income determinants. Building on these findings, future research should explore the following directions: Applying Deep Learning Models: Advanced models such as Neural Networks could be explored to better capture complex feature interactions. Exploring Additional Socio-Economic Factors: Incorporating variables such as health status, political stability, and regional economic development could provide a more comprehensive view of income determinants. By addressing these limitations and expanding the scope of analysis, future research can refine data-driven strategies for reducing income inequality and promoting inclusive economic growth.