Queuing Effect on Multipath Routing in Mobile Ad Hoc Networks

Author: Indrani Das, D.K. Lobiyal, C.P.Katti
Journal: International Journal of Information Engineering and Electronic Business(IJIEEB) @ijieeb
Article in issue: 1 vol.8, 2016.
Free access
In Mobile Ad Hoc Network, data delivery is very challenging through single path due to dynamic changes in the network topology. To cope up this issue multipath data delivery is very useful. Recently, many works have been carried out in this domain but few are addressing the queueing effect on multipath scenarios. In this paper, we have designed a network model that based on the existence of multipath between source and destination node and every node behave as M/M/1 queue. In order to do this we generate K (K=1, 2, 3…i) paths are available between each source toward the destination node. The traffic arrivals in each node follow poisson process with arrival rate λ packets/sec. The simulation work of this multipath scenario based on varying mean inter-arrival time. The effect of arrival rate on the performance of multipath network model is analysed and compared. To better understand the effect of arrival rate in application and network layer various QoS metrics are computed. Significant performance of individual node is noticed in the obtained results with various arrival rates.
Queueing Delay, Poisson Arrival, throughput, average end-to-end delay, multipath, arrival rate
Short address: https://sciup.org/15013396
IDR: 15013396
Text of the scientific article Queuing Effect on Multipath Routing in Mobile Ad Hoc Networks
Published Online January 2016 in MECS
Mobile Ad-hoc Network is a collection of mobile devices that can communicate with each other without using any fixed networking infrastructure [1]. Mobile nodes can communicate directly if nodes fall within the transmission range of each other. Otherwise intermediate nodes that exist between source and destination node only forward messages. In this way, a source node can send data through multi-hop to the intended destination and such network is called multi-hop wireless network. The prominent characteristics of this network are frequent network topology changes because mobile devices may join and leave the network very frequently. Further, battery power of mobile devices is also a limited and scarce resource. As there is no external power source, battery power should be used optimally, so that communication in the network may go undisrupted. Ad hoc networks can be deployed quickly and cost-effective manner without any prior planning. It can be a safe media of communication where infrastructure network is not trusted. (e.g., battled field communication or some topsecret meeting of security officials). Further, this type network is useful for communication in a seminar hall, in some remote or rural place where infrastructure network is not available, emergency rescue operations, under sea operations etc.
In this paper, a network model for a multipath scenario is designed and simulated. We have investigated the performance of the multipath network model with different inter-arrival time. This model works based on M/M/1 queuing network. In our model, we assume that every node work as M/M/1 queue, therefore, the overall network is a network of M/M/1 queues. We have computed the effect of packets arrival rate on application and network layers on per node basis and overall effect on the network. Thereafter, computed performance of network i.e. average end-to-end delay and throughput.
The data traffic flow is a major concern in Ad hoc Network and wants to ensure its proper delivery to the intended destination. When data traffic flows traverse through unipath or multipath from source to a destination the participating node comprises these paths plays a vital role in data delivery. So, individual node performance is a major concern for computing actual performance of any network. Due to the limited processing capability of every node, different QoS metrics in network layer (i.e. throughput, delay) generally affected the overall network performance. By knowing QoS metrics parameter values of each node that helps to identify and select the most suitable next node with minimum possible delay, i.e. optimal path selection may be possible.
The rest of the paper is organized as follows. In section 2, we have discussed works related to multipath routing protocols and queuing analysis. Section 3 included the discussion about our proposed model and various assumptions made in the work for analysis of protocol. Simulation work and results analysis are presented in section 4 and finally, we have concluded our work in section 5.
-
II. Related Work
Multipath routing has attracted a lot of attention of researchers in the recent year due to the numerous advantages over single path routing. However, these protocols have been designed to achieve specific objectives. The main aim of multipath routing protocols is to reduce use of scarce network resources, i.e. battery power, bandwidth. Further, multipath routing may cope with fault occurrence, reduces overall message delivery delay, distribute load or traffic to various paths and ensure the guarantee of message delivery. Here we have discussed some of the multipath routing protocols.
M-DSR (Multipath Dynamic Source Routing) [4, 9] is an on-demand routing protocol. It is the multipath extension of DSR protocol [7]. Generally, on-demand protocols use flooding for message delivery which consumes a large portion of network bandwidth. The advantage of multipath routing is that it reduces the frequency of query flooding. There are two different versions of M-DSR i.e.(i) the only source gets multiple alternate routes, (ii) Each intermediate node on the primary route gets an alternate route. Result analysis of two version shows that any form of multipath technique always performs better than the single path in terms of route discovery process. The maximum performance is achieved up to the maximum of two paths data delivery.
SMR (Split Multipath Routing) [4,8] is also an on-demand routing protocol and extension of well- known DSR protocol. The main aim of this protocol is to utilize network bandwidth efficiently by splitting network traffic into multiple paths. Authors have also argued that congestion of data traffic can be avoided and network resources can be utilized efficiently. This protocol use anyone of the two policies to rediscover the routes, i.e., (i) initiate the route discovery, when any route fails or (ii) initiate the route discovery after both routes are fail. Ad Hoc On-Demand Multipath Distance Vector (AOMDV) [3, 4, 5, 6] protocol is a multipath variation of AODV protocol. The main objective of this protocol is to achieve efficient fault tolerance, i.e. quick recovery from route failure. The protocol computes multiple links disjoint loop free paths per route discovery. If one path fails, then it switches to other available paths. However, only link disjoint routes are selected (node disjoint routes also link disjoint). The destination node replies with only k copies out of many link-disjoint paths. Further, to avoid loop ‘advertised hop-count’ stored in the routing table of nodes is used. The protocol only accepts alternate route with hop count less than the advertised hop-count. A node can receive a routing update via RREQ or RREP packet either forming or updating a forward or reverse path. Routing updates received via RREQ (Route Request) and RREP (Route Reply) are routing advertisement messages.
In [10], authors studied the resequencing delay triggered due to multipath routing. The network routing is modeled using queueing model consist of parallel queues, to study the effect of resequencing on the end-to-end delay. This model shows that the resequencing delay is negligible when delay along each path is light-tailed. In the heavy-tailed this delay is a major concern. The resequencing delay is an amount of time which needs to spend at the destination to rearrange the mis-order packet in a certain order. The throughput provided at network layer may achieve high. The instantaneous throughput measured by applications is not satisfactory and may result in a poor end-to-end user experience.
N. Bisnik et al. in [11] proposed an analytical model for random packet arrival process, locality of traffic, and back-off and collision avoidance mechanisms of random access MAC. The random access mechanism is modeled as an open G/G/1 queuing network. Here, average end-to-end delay and maximum achievable per node throughput is computed for stationary nodes.
W. Cho et al. in [12] proposed an energy aware multipath routing protocol. The protocol provides fault tolerance for broken links. This protocol is the extension of the well-known multipath routing protocol AOMDV. The per node energy consumption and lifetime computed to check the overall lifetime of the network. The node with poor residual energy forbids from participate in routes packets and nodes with good residual energy are allowed to participate in routes packets.
-
III. System and Network Model
In section 2, various methodologies on multipath routing are discussed. We observed that they only focused on network layer matrices and their effect on the network performance. Our study is quite different from these above-mentioned works; along with network layer metrics we have incorporated application layer metrics. In our study focused on the effect of packets arrival in a network per node basis.
We assume that the network consists of N number of nodes, where, each node works as a service center, and nodes are randomly distributed. In Mobile Ad Hoc Network, a node may act as a source as well as a destination. Here, the source node is denoted by S and destination node by D. Every node in the network having a similar transmission range R. Ni is denoted as a total number of neighbor nodes of Node i. Data packets transmit to its neighbor node when the neighbors are in the transmission range. There are multiple paths exist between every source and destination pair. Fig.1 shows the simple scenario of a network model.
Data packets arrive in a service center (node), receive service from the server and leave the service center to be transmitted to the next node in the path. If the server is busy than wait in the queue until the server become free. Data packet arrives with arrival rate λ packets/sec in source according to poisson process, i.e. inter-arrival times are always independent and identically distributed (iid) and exponentially distributed. Also, a data packet receives service at a service rate µ packets/sec, which is also iid and exponentially distributed. There is only one server at every service center. Each node in the network has infinite buffer and packets are served by service center in First Come First Serve (FCFS) manner. The notations and symbols used in our analysis are presented in table.1.
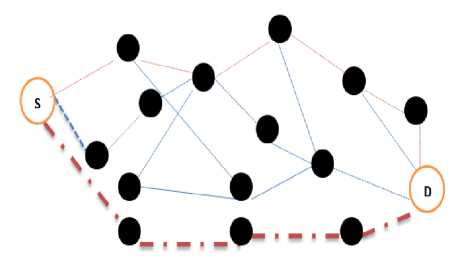
Fig.1.A Simple Scenario of Multi Path Routing
Table 1. Symbols and Notations
|
Symbols |
Description |
|
S |
Source node |
|
N |
Total number of nodes |
|
R |
Radio Transmission Range |
|
D |
Destination Node |
|
N i |
Total Number of Neighbour Nodes of Node i |
|
T |
Particular time interval |
|
λ |
Arrival rate of data packets/sec |
|
µ |
Service rate of data packets/sec |
|
K |
Total number of paths |
|
L |
Data packet size |
|
C |
Link capacity |
|
T |
Average Delay |
|
W |
Average waiting time |
|
W q |
Average waiting time in the queue |
-
3.1. Queueing Model
From source node, data packet forward to the destination node, if the destination is within the transmission range of the source node, otherwise, source forward packets to its k neighbors. These neighbors relay data further to their neighbors, in this manner data packet reaches to the intended destination. Due to data packet are traveling through k neighbors (multiple neighbors), therefore, its establish k- path between source and destination. We assume that each path carries a sequence of M/M/1 queues. For our model, we have taken varying mean inter-arrival time 1, 2, 3, a fixed packet size that is denoted by L and link capacity is C. Using these parameters, we have computed different application and network layer matrices.
A queuing network is a network of queues, where packets arrive to get service in a service center. In our model, every node works as an M/M/1 queue. If the server is not free then wait in a queue to get service and after receiving service leave the service center. Following are some basic characteristics [13,16] of a queuing system (i) Arrival Process is commonly described by using distribution of inter-arrival time, (the time difference between arrival of two consecutive packets) (ii) Service Time is the time spent by each packet in the server. (iii)Number of Servers used to serve packets may be one or more than one. (iv) System Capacity is the maximum number of packets that can be buffered at the service center. It includes a total number of packets waiting for service and receiving service. (v)Population Size is a total number of packets that can arrive in the network, (vi) Service Discipline is the order in which packets are served. M/M/1 queuing network system comprises single queuing station with single server, where packets arrive according to Poisson process with arrival rate λ packets/sec and service time exponentially distributed with service rate µ packets/sec [13, 16].
We modeled the network scenario as a queuing network of M/M/1 queues. The basic characteristics of M/M/1 queue [13, 14] are: as (i) the time between successive arrivals of packets is exponentially distributed. (ii) The service times are exponentially distributed. (iii) Only one server is present (iv) Queue has infinite buffer and no population size limitation, (v) Service discipline is first come first served (FCFS). If inter-arrival times are iid and exponentially distributed, arrival process is Poisson process [13, 14], which is a pure birth-death process. According to [14] the number of arrivals N(t) in a finite time interval of length t, follows the Poisson distribution as given below.
P { N ( t ) = n } = ( λ t ) n Χ ( e - λ t ) n !
As in our network model, every node works as a M/M/1 queue, we are considering here the propagation delay is negligible .For calculating average delay of the network, we need to calculate queuing delay of individual node in a path. To calculate the per node delay we need to calculate delay in each node, i.e. the waiting time of node in each queue. Due to this in our model every node work as M/M/1 queue, therefore, to find out waiting time in each queue, we need to calculate waiting time of a packet in the M/M/1 queue. This calculation can be done as follows:
From the birth death process [13,16] of a system is in state I, if there are i packets in the systems and the probability of transition from state I to (I-1) is µ and I to (I+1) is λ, P i is the probability of system being in state I. Therefore, P i λ= (P i +1) µ for i=0, 1,… Traffic intensity is denoted as ρ =λ/µ. Average number of packets in the M/M/1 queuing system is
E [ n ] =
ρ ( ρ - 1)
Average number of packet in the queue is
E [ n q ] =
ρ 2 ( ρ - 1)
Average waiting time is
W = ( P (1/ Ц )) (4)
(1 - P )
Further, from little’s theorem [13, 16] we know that average number of packets in the system is equal to arrival rate multiplied by average time.
E[ N ] = 2* T(5)
Therefore,
T = E[ n] = 1
2 ( ц - 2)
Average waiting time of packet in the queue is
W, = t-f ) = q l ц J (ц - 2)
-
IV. Simulation and Result Analysis
We carried out the simulation works on Qualnet-5.2 [15] to investigate the performance of each node and their effect on network and application layer. The table 2 shows different simulation parameters and table 3 shows different parameters values considered for simulation. By varying the arrival rate (λ) of data packets, we have calculated different QoS metrics like average end-to-end delay, and throughput at the application layer. In the network layer, we have computed total packets queued, dequeued, average queue length, and average time in Queue, longest time in queue and peak queue size for each node and overall. We have used Matlab as well to plot the results. In Fig. 2, we have shown the various snapshots of scenarios during a simulation in progress. The dark green arrow denotes the connectivity between two nodes and light green small arrow over the dark green arrow represents the data transferring from node to another.
Table 2. Simulation Parameters
|
Parameter |
Specifications |
|
MAC Protocol |
IEEE 802.11 |
|
Radio Propagation Model |
Two-ray ground reflection model |
|
Channel type |
Wireless channel |
|
Antenna model |
Omni-directional |
|
Mobility Model |
Random Way Point |
|
Packet Distribution |
Exponentially Distributed |
Table 3. Values of Simulation Parameters
|
Parameter |
Values |
|
Simulation Time |
1000 sec |
|
Simulation Area (X *Y ) |
1500 m x 1500 m |
|
Number of Nodes |
30 |
|
Transmission Range |
250 m |
|
Link Capacity (C) |
2 Mbps |
|
Pause time |
5 ms |
|
Max. speed of nodes ( m/s) |
10 |
|
Packet Size (L) |
1024 bytes |
|
Mean inter arrival (seconds) |
1,2,3 |
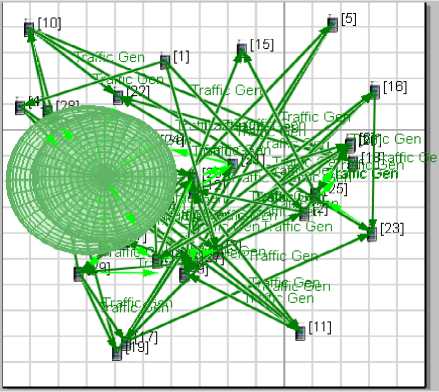
Fig.2. Snapshot of Scenarios during Simulation .
-
4.1. Application Layers Parameters
Delay : The delay means time period elapsed between a packet sent from a source and packet reached the destination. The average delay is the total delay of all the transmitted data packet in the network divided by the total packets transmitted. The delay which incurred in each a node is called per-node delay.
From the Fig. 3 it is clear that different node experienced different delays with varying inter-arrival time.
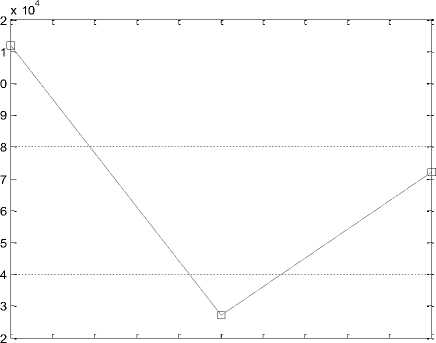
From Fig. 4, it is clear that mean inter arrival time 2 achieves minimum delay compare to other mean inter arrival time. A drop of 0.44 % in delay is noticed from inter-arrival 1 to inter arrival time 2. In inter arrival time 3 delay is quite same as inter arrival time 2.
Throughput: Throughput is number of successful data packets transmitted by each node to the destination in per unit time is called per node throughput over a network. The sum of the throughput of each node makes the throughput of the network.
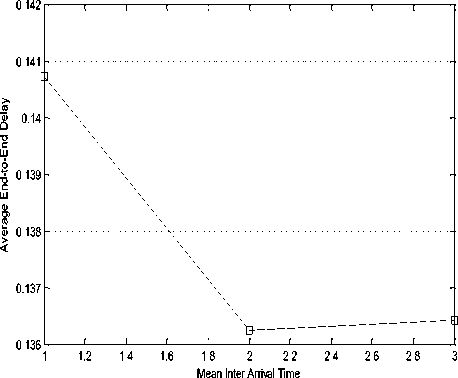
Fig.4. Average end-to-end Delay Vs Mean Inter Arrival Time.
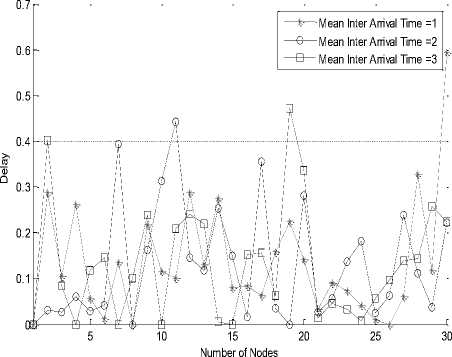
Fig.3. Average end-to-end Delay of Per Node.
1 1.2 1.4 1.6 1.8 2 2.2 2.4 2.6 2.8 3 Mean Inter Arrival Time
Fig.6. Throughput Vs Mean Inter Arrival Time.
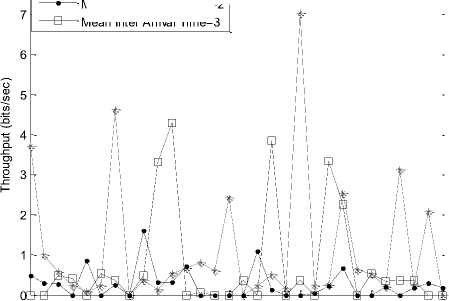
Fig. 5 shows, the per node throughput (bits/sec). The individual node throughput is good in inter arrival time 1. Further, at inter arrival time 3 is moderate but at 2 throughput is minimum.
+ - Mean Inter Arrival Time =1
Mean Inter Arrival Time =2
x 105
Mean Inter Arrival Time=3
Mean Inter Arrival Time
Fig.5. Throughput (bits/sec) Per Node.
Fig. 6 shows the summary of throughput of the network. It is very clear from the fig that throughput is minimum in inter arrival time 2. Also, as we have noticed in fig.5 individual node performance, same can also reflect in fig.6. Therefore, for better understanding of overall throughput of the network individual node performance analysis is very much required.
-
4.2. Network Layer Metrics
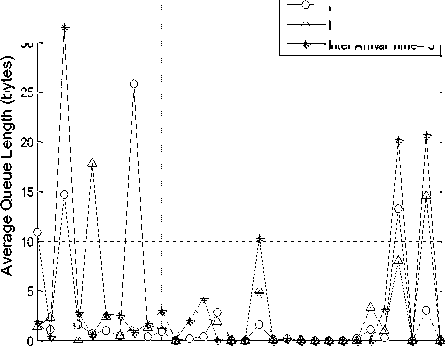
In Fig. 7, the average queue length of for varying node density is shown. Here, inter arrival time considered as 1, 2 and 3. The average queue length of node 3 is maximum among all other nodes when inter arrival time is 3. The average queue length is 3.63 for inter arrival time 3. For inter arrival time 2, average queue length is 2.562202 but for inter arrival time 3, average queue length is 2.679757.
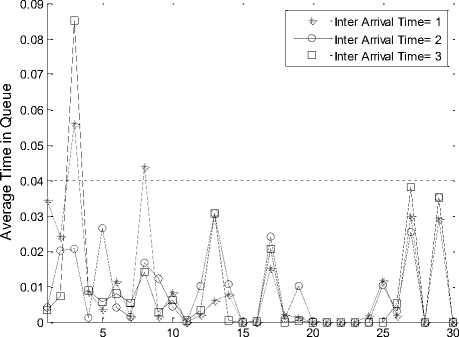
In Fig. 8, we have shown packet average time spent in queue with varying node density at different inter arrival time as 1, 2 and 3. The results shows that node number 3 encountered the maximum average time in queue when inter arrival time is 3. The nodes for which queue length is high, also take higher average time in the queue. At inter arrival time 2, average time spent in queue is less.
The Fig.9 shows, peak queue size with varying node density at inter arrival time as 1, 2 and 3. The results shows that node number 5 achieves the highest peak queue size when inter arrival time is 2. The total average queue size is maximum i.e. 2083.2 bytes at inter arrival time 3. The peak queue size is minimum i.e. 1887 bytes when inter arrival time is 2.
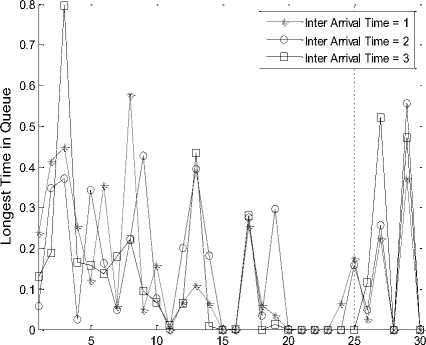
The Fig.10 shows, longest time spent by a packet in the queue with varying node density at inter arrival time as 1, 2 and 3. The results shows that at node 3, packets stay for longest time in the queue when inter arrival time is 3. The average value of longest time in queue is minimum, i.e. 0.135046 sec for inter arrival time of 3 and maximum in inter arrival time 2, i.e. 0.14925.
Inter Arrival Time= 1
Inter Arrival Time= 2
Inter Arrival Time= 3
10 15 20
Number of Nodes
Fig.7. Average Queue Length with Varying Node.
Number of Nodes
Fig.10. Longest Time in Queue with Varying Node Density.
Number of Nodes
Fig.8. Average Time in Queue with Varying Node Density.
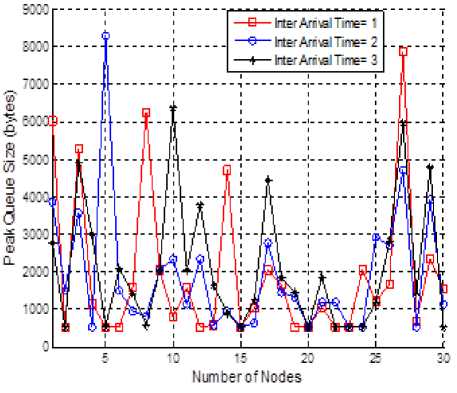
Fig.9. Peak Queue Size with Varying Node Density.
-
V. Conclusion
The routing protocol based on existence of multipath between source and destination node is analysed through simulation. In the network, every node considered as M/M/1 queue better understanding the queueing effect of inter arrival time as well as arrival rate. Significant performance of individual nodes is noticed from the obtained results with various arrival rates. Here, we have analyzed and computed various network and application layer QoS parameters for in depth analysis of individual nodes as well as overall network. In future, this work can be further extended to check the effect in various layers with other queueing models. In future one can try to minimize end-to-end delay and increase the network life time by tactfully selecting the probability to select a path from among k paths for data transfer. One can use finite buffer to selecting the probability also.
References Queuing Effect on Multipath Routing in Mobile Ad Hoc Networks
- C. Siva Rama Murthy and B.S Manoj, 2008.Ad Hoc Wireless Networks Architectures and Protocols, Pearson Education, India.
- Ram Ramanathan and Jason Redi, 2002. A Brief Overview of Ad Hoc Networks: Challenges and Directions. IEEE Communications Magazine, vol. 40(5), pp. 20-22. [doi:10.1109/MCOM.2002.1006968].
- Jiazi Yi, AsmaaAdnane, Sylvain David, and Benoît Parrein, 2011. Multipath optimized link state routing for mobile ad hoc networks. Ad Hoc Networks, Vol.9 (1), pp.28-47. [doi: 10.1016/j.adhoc.2010.04.007].
- Tsai, J., & Moors, T., 2006.A review of multipath routing protocols: from wireless ad hoc to mesh networks, In Proceedings of ACoRN early career researcher workshop on wireless multihop networking, Sydney, July 17-18. [doi:10.1.1.84.5817].
- M. K. Marina and S. R. Das, 2006. Ad-hoc on-demand multi-path distance vector routing. Wireless Communication Mobile Computing, Vol. 6(7), pp.969–988. [doi: 10.1002/wcm.432].
- S. Das, C. Perkins and E. Royer, 2003. Ad Hoc on Demand Distance Vector (AODV) Routing. IETF RFC3561.
- David B. Johnson, David A. Maltz, and Yih-Chun Hu, 2003. The Dynamic Source Routing Protocol for Mobile Ad Hoc Networks (DSR). IETF Internet Draft, draft-ietf-manet-dsr-09.txt.
- S. J. Lee and M. Gerla, 2001. Split Multipath Routing with Maximally Disjoint Paths in Ad Hoc Networks, In Proceedings of the IEEE ICC, Helsinki, Finland Helsinki, Finland,Vol.10, pp.3201-3205.[ doi: 10.1109/ICC.2001.937262 ].
- A. Nasipuri and S. R. Das, 1999. On-demand multipath routing for mobile ad hoc networks. In the Proceedings of Eight International Conference on Computer Communications and Networks, Boston, MA, pp.64-70. [doi: 10.1109/ICCCN.1999.805497].
- Han Y, Makowski A, 2006. Resequencing delays under multipath routing - Asymptotics in a simple queueing model, In the Proceedings INFOCOM 2006. 25th IEEE International Conference on Computer Communications. Barcelona, pp.1-12. [doi: 10.1109/INFOCOM.2006.158].
- Bisnik, N.; Abouzeid, A.A., 2006. Queuing Delay and Achievable Throughput in Random Access Wireless Ad Hoc Networks, 3rd Annual IEEE Communications Society on Sensor and Ad Hoc Communications and Networks, Vol. 3,pp.874-880, 28-28 Sept. 2006. [doi: 10.1109/SAHCN.2006.288575].
- W.Cho et al., 2011. Time delay on demand multipath routing protocol in mobile ad hoc networks. In 3rd International Conference Proceedings of Ubiquitious and Future network (ICUFN), pp.55-60.
- R. Jain, 1991. The Art of Computer Systems Performance Analysis: Techniques for Experimental Design, Measurement, Simulation, and Modelling, Wiley-Interscience, New York, NY, ISBN: 0471503361.511-516.
- Chee-Hock Ng and Soong Boon-Hee, 2008.Queueing Modelling Fundamentals: With Applications in Communication Networks, John Wiley and Sons Ltd, The Atrium, Southern Gate, Chicchester, England. 2nd Edition, pp.104-109.
- Scalable Network Technologies, Inc., Qualnet 5.2 Network Simulator, http://web.scalable-networks.com/.
- Mir, Nader F., 2007.Computer and Communication Networks, Prentice hall. pp. 275-278.
