Random and regular stock price change depending on a time span

Author: Galanov Vladimir Aleksandrovich, Galanova Aleksandra Vladimirovna, Shibaev Sergei Rafailovich
Journal: Economic and Social Changes: Facts, Trends, Forecast @volnc-esc-en
Section: Theoretical issues
Article in issue: 4 (52) т.10, 2017.
Free access
The purpose for the research is to identify the correlation between random (accidental) stock price changes and its well-known tendency to grow depending on a time span. In contrast to the works of other scholars on the issue of the random nature of stock prices the presentation of the issue is new in the current research. The research method consisted of identifying the criterion stock price change separation into random and regular components and further comparing the proportions between random and regular stock price change on the example of 10 stocks of the largest world-known companies from representing different economic sectors traded on New York stock exchange for several time spans: one day, week, month, quarter, half-year and one year. The main research results suggest that with the increase in time span the share of the regular origin of the stock price increases, but only up to a certain significant limit. The increase in the time period of analyzing the stock price changes (fluctuations) does not prove that the random character of stock price change has an unlimited downward trend...
Stock price, upward trend, random change, regular change, time span, price limit, proportion, stock exchange
Short address: https://sciup.org/147223962
IDR: 147223962 | UDC: 336.761.5 | DOI: 10.15838/esc.2017.4.52.13
Text of the scientific article Random and regular stock price change depending on a time span
The theoretical framework of the study and previous research
The study is based, on the one hand, on the random walk theory and, on the other hand, on patterns in stock market prices performance for relatively long periods of time, which in general is manifested in the increase in stock indices despite all known crisis events in the market and in the economy as a whole.
The issues of randomness in stock price perforance are constantly in the center of attention of stock market theorists and practitioners. To date, there are numerous articles on various aspects of the random nature of stock prices, which are based on the work of M. Porter [16], P. Samuelson [21], Y. Fama [12,13], W. Sharpe and other researchers. It is believed that theoretical studies on this issue have their origin in a famous work by Louis Bachelier [8], which is not entirely correct due to two circumstances.
First, this work by Louis Bachelier was written in the early twentieth century, forgotten for half a century and became known (“discovered”) only in the 50-s.
Because of this we cannot claim that the study of the random nature of stock price began with this author.
Second, the random nature of stock prices was known to economists before Bachelier (see, for example [20]). Even Marx, long before Bachelier, wrote that the share price is random in nature; and it was not his own discovery as in this case he only summarized what was already known by economists in the 19th century. “The market value of the stocks is partly speculative as it is determined by not only actual income, but also by the expected, pre-calculated income” [6, p. 10].
But for our study this position is important because it clearly demonstrates the approach to the volatility of stock prices in time, which is not purely random as is usually seen from the viewpoint of market actors and the above mentioned economic theorists. This approach means that stock price changes should be seen as a unity of its random and non-random (regular) change.
The follewers of Marx’s teachings had the same understanding of the nature of stock price change. For example, R. Hilferding in his famous work “Financial capital” published in 1910 (the book was written mainly by 1905) also repeatedly stated: “... The same is for prices (stock), along with the aspects determining the price, we should distinguish those random aspects expressed in the changing ratio of demand and supply” [7, p. 190].
Since this approach to considering the stock price is typically missing, we can say that, in fact, there are no articles addressing the issue of finding the quantitative correlation between random and regular stock change. It can be reasonably assumed that this correlation should be different at time intervals significantly differing in duration.
Russian authors in their works (Alekhin [1], Berzon [2], etc.) usually state the stock price performance is characterized by random fluctuations and a growth trends, but there are no references to any approaches to identifying their correlation. In addition, it should be noted that the regular stock price flactuation is usually understood only as an upward trend, although, logically, a downward trend is as possible as an upward trend. For example, the company’s relative worsening of the situation in the market, which can last for many years, inevitably leads to corresponding growth of its stock prices.
At the same time, works devoted to models of stock prices put the emphasis on the mathematical description of a random process of price changes, which implies «regular randomness» in the form of stock price fluctuations confiorming to normal – or rather, lognormal, probability distribution, rather than randomness in general. Here the probability randomness itself takes the form of a special type of pattern being mathematically presented as the Wiener process and teh Ito process. The lognormal distribution is always a one-sided pattern, i.e. a pattern with one direction – stock price increase. But for different time intervals the law could be both stock price increase and its decrease. In addition, in mathematical models “regularity” is also expressed in constants not directly related to the variance, but indirectly dependent via a common (single) framework of stock price model calculations. In general, it should be noted that neither lognormality of probability distributions, nor constants due to their “permanence” under any of their “improvements” are not sufficient to identify the changing role of random and regular components with respect to different time intervals of a stock price flactuating in time.
An upward or a downward trend in stock prices is rooted in the fact that a stock is a form in which capital exists in circulation as a commodity. The goal of any capital is to get maximum profit. Due to this profit capital constantly increases but due to changes in demand for its commodities the size of the functioning capital not only increases, but from time to time can be reduced. Therefore, the law of stock price performance in most cases is its permanent growth, but only in the form of its permanent accidental upward and downward flactuations from its previous level.
“Randomness” is understood as variability the future result of which is unknown. In this case variability itself is random variability. That is why it is correct to claim that stock prices change randomly, i.e. no one knows (there is no law) what the stock price will be in the next or some other future point in time.
The effect of changing any object can be known in advance or unknown. The predictability of a future event usually takes place if there is a (known to a human) law of object variation or if this event is the result of purposeful human activity. The former is typical of many natural phenomena. For example, the law of gravitation controls the motion of the Earth around the Sun, therefore its future location can be predetermined. The latter is related to teh situation where a person applying the laws of nature creates teh necessary objects from the existing natural substances. The created thing object first existed only as a mental abstraction or a purpose but then it was embodied in a material object. Each produced commodity is a change in the natural substance the result of which was known even before the process of its production was finished.
Price variability is the inconsistency of its values over time. As the price of any commodity, stock price is volatile but this volatility is usually unknown in not predetermined. Quantitative values of stock prices at different points in time differ, although sometimes they may coincide. Stock price volatility is the reason for incremental yield, or the positive price variance, as wewll as the basis for the possible loss from stock purchase and sale which is totally undesirable for a market actor. Thus it is obvious that the latter wants to avoid the negative outcome in teh future, which necessitates deeper research of the phenomenon of stock price changes.
There are two types of stock price changes: a change as an upward or downward price development and a change as a difference between its previous and next value.
The first type of change is randomness uniteed with regularity. The randomness of each of these two types of changes has either a probability equaling 0.5, or one of the changes is has higher probability, which means there are trends in upward and downward price deelopment. In case of stock price there is an upward trend in price development, therefore the probability of stock price increase is higher than the probability of its reduction.
The second type of change is a randomness without probability, or randomness where of any possible change may have little probability significantly lower than 0.5. Randomness without probability is the same as infinitesimal probability that a ball will touch the surface in a particular point, i.e. in the limit this probability equals zero.
However, in the organized stock market the stock price only changes multiples of a particular interval determined by stock exchange. Therefore, each next possible price value for an individual transaction is known as it is the current price plus or minus the price change interval. But given the quantitative mismatch of selling and buying lots, as well as a large number of transactions per unit of time the average interval itself, i.e. the average price change from trade to trade, becomes a random value. In this sense, random price change is the result of an accidental number of many “steps”.
Thus, any viewpoint in stock price change always reflects the unity of randomness and regularity. Speaking philosophically, we should say that stock price change is regular but its permanence is nothing less than randomness of the absence of the change process. On the one hand, a random event is always an event whose complexity of understanding exceeds the level of available scientific knowledge about it. Anything a human cannot explain is random. Therefore, deeper knowledge of stock price is a way to reduce the “sphere of randomness” characteristic of this price. On the other hand, randomness does not exist separated from reguilarity. Stock price is random but its volatility is regular. The most common direction of stock price change as an external (market, negotiable) form of capital which directly creates profit is also regular. Therefore, it is logical to assume that random stock price fluctuations are “islands” of regularities; in any kind of regularity related to the stock price there are built-in “natural” and certain “segments” of randomness.
Knowledge about the existence of proportionality between the random and regular components of stock prices can be useful for traders (speculators and investors) exercising their trade operations (strategies) at different time horizons.
The research hypothesis lies in the following: as time intervals are increased the share of teh random factor in the stock price decreases, while the share of the regular factor increases.
For the purposes of this study random stock price change is referred to as its change which is beyond the level taken as a standard of its regular change. We used stock price change for a given period of time calculated on the basis of yearly stock price changes as a standard of regular stock price change .
The chosen time intervals are: day, week, month, quarter, six months and year.
Price changes were analyzed during a more or less crisis-free 2013. For each stock of the existing reports (Macrobond database) we calculated actual price variance from its “standard” for each selected time interval. The calculations of the values of this standard for each stock are presented in Table 1.
The calculation results are grouped into several tables which clearly demonstrate the whole course of reasoning to make certain qualitative conclusions about detecting both random and regular factors in stock price fluctuations based on the sequence of calculations. This suggests that random stock price performance also contains regular patterns.
Brief description of analysis technique
In order to obtain source information we did the following: 30 random samplings for a one-day interval, 4 random samplings for a one-week interval; all 12 months and four quarterly intervals with both half-years(six-month intervals) are taken.
Table 1. Calculation of the standard regular price variance by stock type for each time interval
|
Type of stock 1 |
Stock price change for 2013 (closing price 31.12.13 – opening price 02.01.13 (in absolute value)) 2 |
Stock price change per day (Group 3) = (Group 2) / 360 days 3 |
Stock price change per week (Group 4) = (Group 2) / 52 weeks 4 |
Stock price change per month (Group 5) = (Group 2) / 12 months 5 |
Stock price change per quarter (Group 6) = (Group 2) / 4 quarters 6 |
Stock price change per 6 months (Group 7) = (Group 2) / 2 half years 7 |
|
1. General Electric Co. |
6.52 |
0.018111 |
0.125385 |
0.5433333 |
1.63 |
3.26 |
|
2. Walt Disney |
25.6 |
0.071111 |
0.492308 |
2.1333333 |
6.4 |
12.8 |
|
3. Pepsi Co Inc. |
13.76 |
0.038222 |
0.264615 |
1.1466667 |
3.44 |
6.88 |
|
4. Procter & Gamble Co. |
12.76 |
0.035444 |
0.245385 |
1.0633333 |
3.19 |
6.38 |
|
5. Exxon Mobil Corp. |
13.41 |
0.03725 |
0.257885 |
1.1175 |
3.3525 |
6.705 |
|
6. IBM |
6.52 |
0.018111 |
0.125385 |
0.5433333 |
1.63 |
3.26 |
|
7. McDonalds Corp. |
7.63 |
0.021194 |
0.146731 |
0.6358333 |
1.9075 |
3.815 |
|
8. Johnson & Johnson |
20.57 |
0.057139 |
0.395577 |
1.7141667 |
5.1425 |
10.285 |
|
9. JPMorgan Chase & Co. |
13.5 |
0.0375 |
0.259615 |
1.125 |
3.375 |
6.75 |
|
10. Deutsche Bank AG |
2.6 |
0.007222 |
0.05 |
0.2166667 |
0.65 |
1.3 |
Each stock price value is compared with the “standard” and the deviations are summarized according to their absolute value.
Results of random price change levels for each time interval were determined for all selected 10 stocks and then were averaged for each time interval.
The obtained results were compared in terms of periods of time; the level of randomness was taken as 100%.
“Cross” calculation results are presented in Table 2 .
As the table shows, the share of random factor in stock price declines as the time interval increases, but to a different extent. Compared to the previous interval, random factor is always reduced by less than its value when the difference is a few time intervals from teh daily interval.
Based on data from Table 2 (column 2), i.e. with the available points, we built a graph of variqance of teh share of random factor in the stock price depending on the time interval ( Fig. 1 ). In Figure 1 and in subsequent figures,
Table 2. Share of random factor in stock price and its change by time interval
|
Time interval |
Average share of random factor in stock price change |
Reduction in random factor against daily interval |
Reduction i n random factor against weekly interval |
Уменьшение Reduction in random factor against monthly interval |
Reduction in random factor against quarterly interval |
|
1 |
2 |
3 |
4 |
5 |
6 |
|
Daily |
100.00% |
- |
- |
- |
- |
|
Weekly |
90.18% |
9.82% |
- |
- |
- |
|
Monthly |
79.36% |
20.64% |
10.82% |
- |
- |
|
Quarterly |
73.30% |
26.70% |
16.88% |
6.06% |
- |
|
Half-year |
48.54% |
51.46% |
41.64% |
30.82% |
24.76% |
Figure 1. Change in the share of random factor in stock price
Based on Table 2 and the illustration of the results in Figure 1 we can make the following preliminary conclusions. The share of random factor in stock price change over a week is approximately 90%; the share of random factor in stock price change during a monthly period is approximately 79%; the share of random factor in stock price change during a quarter is approximately 73%; the share of random factor in stock price change in a halfyear period is approximately 49%.
Thus, it should be noted that the most significant decline in the share of random factor in stock price is observed not earlier than in half year. In our opinion, due to the fact that in half a year the company already has more reliable and more complete, compared to a month and a quarter, financial statements reporting the results of its operations. This period usually clearly reflects the increase (or decrease) in the coompany’s operating capital. It is the company’s capital that is the basis of regular growth in the price of its stocks. At the same time, when it comes to short time intervals, stock price change is random to a great degree. This can be explained by the fact that market actors in such a short time cannot “unanimously” assess the company’s performance due to the fact that, on the one hand, there company’s performance reports are insufficient, but most importantly, no one on the market, even the company itself knows how it performed in such a short period of time.
The next step in the analysis is the calculation of the trend line by constructing different forms of regression equations:
-
Figure 2 – linear regression
-
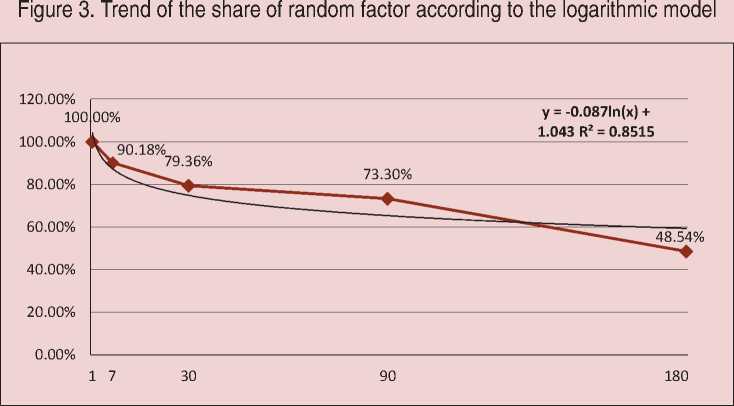
Figure 3 – logarithmic dependence, Figure 4 – exponential dependence, Figure 5 – power dependence.
Thus, according to any of the applied regression models showing the general trend, we have:
-
1. With an increasing time interval the share of random factor in the stock price change decreases while the share of regular factors increases.
-
2. Ranging from one month to three months (quarter) the share of random factor is reduced significantly slower than the time interval expands from a quarter to a half-year interval.
-
3. Ranging from a month to a quarter teh share of random factor is reduced by only six percentage points against about twenty points of its reduction during the period from one day to one month. Such a sharp slowdown in the share of random factor reduction can be explained by the fact that during the period up to a month the change has already “exhaiusted” the entire “stock of randomness”, i.e., main opportunities of stock price fluctuations amid the absence of results of work of capital over a given period of time have already been tested. A further increase of the time interval to a quarter adds nothing to
Figure 2. Trend of the share of random factor according to the linear model
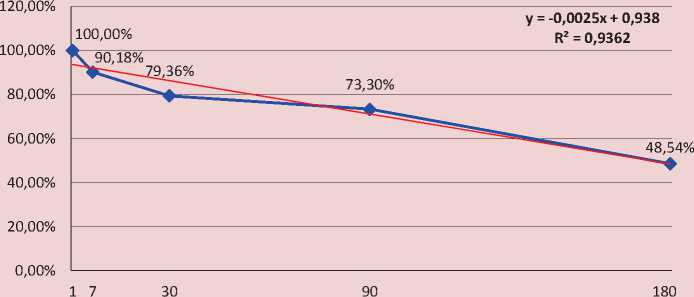
the “randomness” chgaracteristic of the share price, but still cannot significantly reduce this potential as there is yet no significant information growth on the market about the economic efficiency of teh company’s capital stock.
Analysis of the above models in terms of their statistical “quality” demonstrates that the actual dynamics of the share of random factor is better described by the exponential function as it has the highest R2 value ( Tab. 3 ).
Figure 4. Trend of the share of random factor according to the exponential model
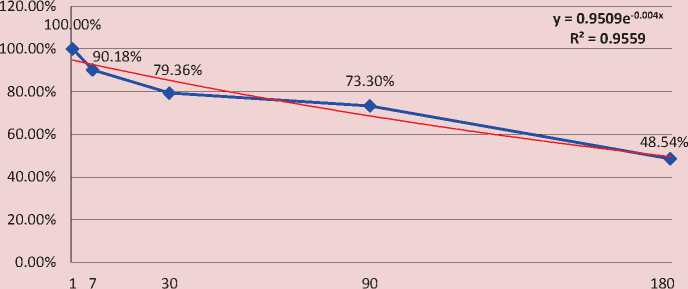
Figure 5. Trend of the share of random factor according to the exponential model
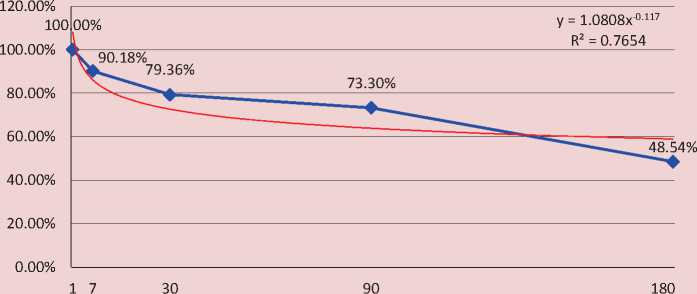
Table 3. Relative R2 values
|
Linear function |
Logarithmic function |
Exponential function |
Power function |
|
y = -0.0025x + 0.938 |
y = -0.087ln(x) + 1.043 |
y = 0.9509e-0.004x |
y = 1.0808x-0.117 |
|
R2 = 0.9362 |
R2 = 0.8515 |
R2 = 0.9559 |
R2 = 0.7654 |
Table 4. Forecast of the share of random factor in stock price change beyond a year
|
Years |
Days |
Power function |
Linear function |
Exponential function |
Logarithmic function |
|
x |
у |
у |
y |
у |
|
|
1 |
1.08 |
0.94 |
0.95 |
1.04 |
|
|
7 |
0.86 |
0.92 |
0.92 |
0.87 |
|
|
30 |
0.73 |
0.86 |
0.84 |
0.75 |
|
|
90 |
0.64 |
0.71 |
0.66 |
0.65 |
|
|
0.5 |
180 |
0.59 |
0.49 |
0.46 |
0.59 |
|
1 |
360 |
0.54 |
0.04 |
0.23 |
0.53 |
|
1.5 |
540 |
0.52 |
-0.41 |
0.11 |
0.50 |
|
2 |
720 |
0.50 |
-0.86 |
0.05 |
0.47 |
|
2.5 |
900 |
0.49 |
-1.31 |
0.03 |
0.45 |
|
3 |
1080 |
0.48 |
-1.76 |
0.01 |
0.44 |
|
3.5 |
1260 |
0.47 |
-2.21 |
0.01 |
0.42 |
|
4 |
1440 |
0.46 |
-2.66 |
0.00 |
0.41 |
|
4.5 |
1620 |
0.46 |
-3.11 |
0.00 |
0.40 |
|
5 |
1800 |
0.45 |
-3.56 |
0.00 |
0.39 |
|
5.5 |
1980 |
0.44 |
-4.01 |
0.00 |
0.38 |
|
6 |
2160 |
0.44 |
-4.46 |
0.00 |
0.38 |
|
6.5 |
2340 |
0.44 |
-4.91 |
0.00 |
0.37 |
|
7 |
2520 |
0.43 |
-5.36 |
0.00 |
0.36 |
|
7.5 |
2700 |
0.43 |
-5.81 |
0.00 |
0.36 |
|
8 |
2880 |
0.43 |
-6.26 |
0.00 |
0.35 |
|
8.5 |
3060 |
0.42 |
-6.71 |
0.00 |
0.34 |
|
9 |
3240 |
0.42 |
-7.16 |
0.00 |
0.34 |
|
9.5 |
3420 |
0.42 |
-7.61 |
0.00 |
0.34 |
|
10 |
3600 |
0.41 |
-8.06 |
0.00 |
0.33 |
However, if we try to continue calculating the share of random factor according to the models beyond a year, then, as follows from Table 4 , starting from a certain time interval (on average within 1.5–2 years depending on the company) changes in the share of a random factor for different models do not always take on rational values.
Data from Table 4 suggest that only in the exponential and logarithmic function further decline in the share of random factor dramatically slows down, which can be interpreted as the most suitable forms of correlation despite the fact that they have the lowest R2 paradoxical as it may from the point of view of the theory of mathematical statistics,.
Therefore, in our opinion, the most appropriate is the use of the exponential or logarithmic dependencies, the choice between which can be made by solving a certain task, rather than the problem in general.
Specific indicators of a particular equation entirely depend on the variety of characteristics of statistical sampling necessary for a trader: the source information database, the number of reviewed companies, time intervals.
However, regardless of which dependency is chosen y a market actor, the already presented forecast example shows that the share of random factor is reduced disproportionately to the increase in time interval, but to hyperbola, which suggests that the downward trend in random factor is quantitatively limited.
Theoretically, such limits derive from the fact that it is impossible to get rid of the randomness in stock price changes, no matter how the time interval is increased. Regularity exists only in unity with randomness. The “zeroing” of random factor would mean that something only became regular, which is impossible.
Thus, the research helps make two main conclusions:
-
1. The stock price always combines random and regular changes. It is impossible to get rid of the random nature of stock price changes, but one should not neglect the existence of regularities in these changes. A trader on the stock market relying only upon the understanding of the random nature of stock price changes may miss out on substantial benefit from the market situation where stock price follows substantial capital growth of the respective company. Conversely, blind chase for, for example, an upward trend emerged on the market interpreted as a price pattern could lead to major losses as this trend may be the result of random unilateral supply-and-demand disequilibrium for this stock, rather than the result of the company’s capital growth.
-
2. As time intervals increase, the share of random factor in stock price change tends to decrease, but only to a certain limit. It is generally believed that investment, i.e. longterm stock purchase, is a certain guarantee that its price will considerably rise. In fact, the unity of regularity and randomness in the stock price suggests that even over time it is impossible to get rid of randomness in the stock price. The moment the stock price increases will be random as the company’s capital increases due to both efforts of the company itself and favorable conditions for a relevant good or service on the market. The randomness hidden in the product itself already lies in the fact that the product “does not last” and can be replaced by new items. Hence, if the stock price rises within, for example, the investment period of five years there is no guarantee that it will grow in the case of a ten-tear investment period. Stock price change regularity is the result of a random collision of numerous market factors; even a slight change in their configuration and extent again leads to random market price of a stock again.
That is why professional investors on the stock market usually “instinctively” understand that long-term investment is not impossible. Investment itself has some reasonable time intervals beyond which it turns into its opposite – speculation in random stock price changes with unpredictable outcomes.
References Random and regular stock price change depending on a time span
- Alekhin B. Sluchainoe bluzhdanie tsen na birzhe . Rynok tsennykh bumag , 2004, no. 12 (14), pp. 12-14..
- Berzon N.I. Zavisimost' riska i dokhodnosti aktivov ot vremennogo gorizonta investirovaniya . Universitetskoe upravlenie: praktika i analiz , 2008, no. 3..
- Galanov V.A. Sushchnost' aktsii . Vestnik REU im. G.V. Plekhanova , Moscow: REU im. G.V. Plekhanova, 2014, no. 8..
- Galanov V.A., Galanova A.V. Aktsiya kak protivorechie . Vestnik Rossiiskogo gosudarstvennogo torgovo-ekonomicheskogo universiteta , 2014, no. 7-8. Moscow: REU im. G.V. Plekhanova, 2014..
- Kelasev V. Dvizhenie tsen: sluchainost' ili zakonomernost' . Valyutnyi spekulyant , 2002, October..
- Marx K. Kapital . Vol. 3, ch. 2. Moscow: Politizdat, 1957..
- Hilferding R. Finansovyi kapital . Moscow: Izdatel'stvo sotsial'no-ekonomicheskoi literatury, 1957..
- Bachelier Louis Théorie de la speculation. Paris, Gauthier-Villars, 1900.
- Cootner Paul H. Stock Prices: Random vs. Systematic changes. Industrial Management Review, no. 3 (Spring 1962), pp. 24-45.
- Cootner Paul H. The Random Character of Stock Market Prices. Cambridge: The M.I.T. Press, 1964.
- Fama Eugene F. Efficient Capital Markets: A Review of Theory and Empirical Work. The Journal of Finance, 1970, vol. 25, no. 2, pp. 383-417.
- Fama Eugene F. Random Walk in Stock Market Prices. Financial Analysts Journal, 1965, no. 21 (5), September-October, pp. 55-59.
- Fama Eugene F. The Behavior of Stock-Market Prices. The Journal of Business, 1965, vol. 38, no. 1, January, pp. 34-105.
- Houthakker H. Systematic and Random Elements in Short-Term Price Mouvements. American Economic Review, 1961, no. 51, pp. 164-172.
- Granger Clive W. J., Morgenstern O. The Random Walk Hypothesis of Stock Market Behavior. Kyklos, 1964, no. 16, January, pp. 1-30.
- Kendall Maurice G. The Analysis of Economic Time-Series -Part I: Prices. Journal of the Royal Statistical Society, 1953, no. 96, part 1, pp. 11-25.
- Lo Andrew W., MacKinlay A. Craig. A Non-Random Walk Down Wall Street. Princeton University Press, 2011.
- Lo Andrew W., MacKinlay A. Craig. Stock Market Prices Do Not Follow Random Walks: Evidence From A Simple Specification Test. The Review of Financial Studies,1988, no. 1 (1), pp. 41-66.
- Malkiel B.G. A Random Walk Down Wall Street: The Time-Tested Strategy for Successful Investing. 11th edition. W.W. Norton & Company, Inc., 2015.
- Regnault J. Calcul des Chances et Philosophie de la Bourse. Mallet-Bachelier, Paris 1863.
- Samuelson P. A. Proof That Properly Anticipated Prices Fluctuate Randomly. Industrial Management Review,1965, no. 6:2, pp. 41-49.
- Database Macrobond. Available at: www.macrobond.com
