Rankings in Sport by Pairwise Comparison and League Table

Author: Sebastian Sitarz
Journal: International Journal of Modern Education and Computer Science (IJMECS) @ijmecs
Article in issue: 12 vol.5, 2013.
Free access
This article describes a method of creating rankings in sport (medal tables). First, the countries are pairwise compared by area of the feasible points for which they are better. These feasible points correspond to gold, silver and bronze medals. After pairwise comparison we use the method of league table to rank the countries.
Olympic ranking, medal table, sport
Short address: https://sciup.org/15014610
IDR: 15014610
Text of the scientific article Rankings in Sport by Pairwise Comparison and League Table
Published Online December 2013 in MECS DOI: 10.5815/ijmecs.2013.12.04
-
A. Idea
Our aim is to rank countries only on the basis of number of medals won. Currently, there are two systems for medal table used:
-
i. gold first system (“gold rank”)
-
ii. total number of medals (“total rank”)
These two systems do not give the same medal table. Moreover, they focus only on gold medal or only the sum of medals respectively . t hus , we want to create the medal table which takes into account all medals (not only gold) and their value.
The background of our approach is using the points for medals. We want to rank countries by parwise comparison of weighted sum of points and medals. We will calculate the volume of points for which a given country is better than another. Medal table is constructed for sport, thus we want to find a method which comes from sport. One of this method is a league table which summarizes pairwise matches with the help of points and goals. Similarly, in our approach after pairwise comparison we build a league table (medal table) of countries with the help of earlier obtained volumes.
-
B. Medal tables in literature
It is worth comparing the above idea with approaches to medal table proposed by other authors in literature. Among recent papers we have found the following works. Saaty [1] uses theory for the measurement of intangibles, the Analytic Hierarchy Process to rank countries in the 2008 Olympics. Wu et al. [2] present an extension tool of data envelopment analysis (DEA), namely cross efficiency evaluation method to measure the performance of the nations participating in the six Summer Olympic Games. Lins et al. [3] use a ranking system based on DEA as well, this ranking is based on
each country’s ability to win medals in relation to its available resources. Sitarz [4] proposes to build Olympic ranking on the following points for gold, silver and bronze medals: 11, 5, 2. Sitarz [5] applies the concept of incenters for convex cones to built the sport rankings.
-
C. Outline of paper
The paper consists of the following sections: section 1 is introduction; section 2 presents the set of feasible points; section 3 introduces the method of pairwise comparison; section 4 provides us with construction of the medal table; section 5 consists of applications in two World Championships, and the final section summarizes the paper.
-
II. SET OF FEASIBLE POINTS
-
A. Points for medals
We will use the following notation. A vector of medals won by country : is denoted by
mi = (gi, si, bi)
where g i denotes gold medals, s i - silver medals and b i bronze medals.
Moreover, the points for medals are denoted by p = ( p g , p s , p b )
where p g denotes points for gold medal, p s - points for silver and pb - points for bronze.
We assume that the gold medal is assigned more points than the sliver, and the silver more than the bronze. Thus we look at the following points for medals:
pg ≥ ps ≥ pb ≥ 0
The points for medals generate the ranking (medal table). In this case we rank countries according to weighted sum of points and medals:
p mi = pg,gi + ps,si + pb bi
Ranking built with the help of points, depends on the used points, which is illustrated in the following example.
-
B. EXAMPLE
We are interested in building medal table for three leading countries in Winter Olympic Games in
Vancouver 2010: Canada, Germany and the USA. These countries won the following numbers of medals:
Canada: (14, 7, 5)
Germany: (10, 13, 7)
USA: (9, 15, 13)
By using the following points:
pg= 3, ps=2, pb =1.
We obtain the following values of weighted sum the ranking and based on them:
-
1. USA with 70 points:
-
(70 = 3 • 9 + 2 • 15 + 3 • 13 = р • mDM)
-
2. Germany with 63 points:
-
3. Canada with 61 points:
(63 = 3 • 10 + 2 • 13 + 3 • 7 = р • тСвгжвяУ)
-
(61 = 3 • 14 + 2 • 7 + 3 • 5 = р ■ mCcncdc)
By using other points:
Рд = 5. ps = 2, рь = 1.
We obtain other values and another ranking:
-
1. Canada with 89 points:
-
2. USA with 88 points:
(89 = 5-14 + 2- 7 + 3- 5 = р- mCcncdc)
-
(88 = 5 ■ 9 + 2 ■ 15 + 3 ■ 13 = р • т"")
-
3. Germany with 83 points:
-
(83 = 5 • 10 + 2 ■ 13 + 3 • 7 = р • шСег™2ПУ)
-
C. Illustration of the set of feasible points
As we can see above, in example II.2, the position of countries are different. Generally the ranking depends on the used points. However, one ideal system of points for medals does not exist. Similarly, in this work we are not going to find any numbers for p g , p s , p b , We will operate on the set of feasible points defined in the following way. Without loss of generality we assume that points for gold medal are equal to a fixed number 1. The reason is that the points (p g , p s , p b ) generate the same ranking as (Р» Р£ РЬА
VPS Рд Рд . Thus, we will consider the following set of feasible points:
^Рд-Рз-Рь ): 1 ~ Рд ^Рз ^Pb ^ °)
or equivalently

For the convenience and geometrical illustration we will use the second form of the set of feasible points, set p, using only two values of points: for silver and bronze medals. The illustration of set p in the bronze-silver space is given by Fig. 1.
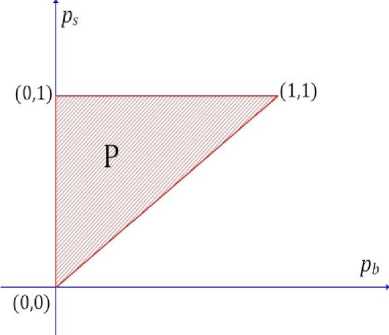
Figure 1. The set of feasible points in bronze-silver space.
-
III. PAIRWISE COMPARISION
Now we are going to compare two countries taking into account the number of medals won by each of them. To do it, we will use the feasible set of points P . At the beginning of the presentation of our approach let us consider some examples which illustrate our idea.
-
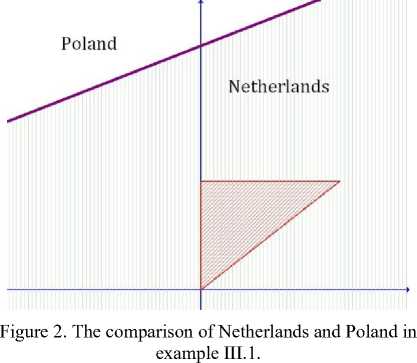
A. Example – a 100% win
We want to compare two countries in Winter Olympic Games in Vancouver 2010: Netherlands and Poland. These countries won the following numbers of medals:
Netherlands: mJVrth#riands _ (4 Т з)
Poland: т^^ = (1,3,2 )
We will use the whole set of feasible points. In other words, we compare these two countries on triangle p . The Illustration of this comparison is given by Fig. 2. First we draw a line describing the points for which these two countries have the same values of points. This line is easy to draw, because it is given by the following equation:
-
- , ^^Werfie-riands _ р , mPoicnd
or equivalently
-
4 + 1 • ps + Зр-0 = 1 + 3ps + 2р-0
The area below this line denotes the points for which Netherlands have more points
/ D ' m'VetfeerlcR п • mP0Lcnd
( ), similarly the area above the line denotes the points for which Poland has f П . m Vetr.ericnds < , mPoiand more points ( ).
As we can see the line lies above the triangle p , thus for all feasible points Netherlands is better than Poland.
-
B. Example - a part win
We want to compare two countries in Winter Olympic Games in Vancouver 2010: Sweden and Russia. These countries won the following numbers of medals:
Sweden: шл»»а™ =(5,2.4 )
Russia: гал™ = (3,5,7)
We proceed analogically like in example III.1. The illustration of this comparison is given by Fig. 3. In this case the line of the points for which Sweden and Russia have the same points:
р ■ m^eden _ р . Russia
(5 + 2ps + 4рь = 3 + 5ps + 7рь)
bisects the triangle F . We want to calculate the area of the part of triangle р which belongs to Sweden and to Russia. These areas are easy to calculate by using elementary geometry (or algebraic calculation). We obtain the following results:
-
- for 78 % of the feasible points Russia is better
-
- for 22 % of the feasible points Sweden is better
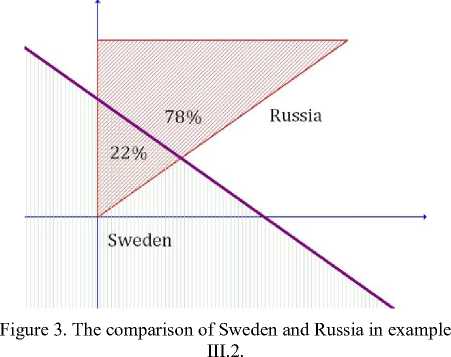
Thus, summarizing the above results, we can say that Russia is better than Sweden because there are more feasible points (78%) corresponding to Russia than to Sweden (22%).
-
C. Example - a draw
We want to compare two countries in Winter Olympic Games in Vancouver 2010: Italy and Japan. These countries won the following numbers of medals:
Italy: ш7Га1у _ (1Д З)
Japan: m;cpcn _ (0,3, 2 )
We proceed analogically like in examples 3.1 and 3.2. The illustration of this comparison is given by figure 4. In this case we obtain the following results:
-
- for 50% of the feasible points Italy is better
-
- for 50% of the feasible points Japan is better
Thus, we can say that there is a draw between Italy and Japan.
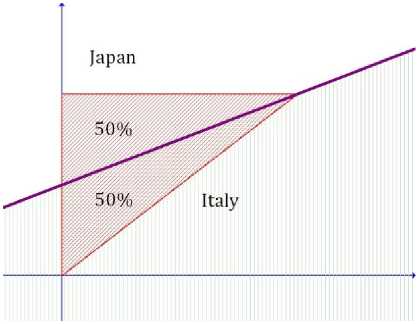
Figure 4. The comparison of Italy and Japan in example III.3.
-
D. Description and notation of pairwise comparison
After the presentation of some examples and illustrations of the pairwise comparison let us describe notation and definitions. Having two countries m and m we compare them by area of the feasible points for which they are better and obtain two values of percentage:
pIJ - the percentage of the feasible points for which :-th country has more value of the weighted sum of points and medals than .' -th country р - the percentage of the feasible points for which -th country has more value of the weighted sum of points and medals than : -th country
According to the above percentages we sat that:
if P^i > р^ then : -th country wins again / -th country, if ру < p;i then L -th country loses again /-th country, if pv = р^ then there is a draw between : -th and j -th countries.
-
E. Example – non transitivity
We would like to show that a win of the presented pairwise comparing generates not a transitive relation. Let us consider three countries with the following medals:
m1 = (8,8,35), m2 = (16,0,28), m3 = (0,24,26)
By pairwise comparing we obtain:
m1 wins over m3 with 56%–44% m3 wins over ш2 with 52%–48% but nr wins over m1 with 53%–47%
As we can see above a win is not a transitive relation.
-
IV. CONSTRUCTING THE MEDAL TABLE
In the previous section we introduced a method of pairwise comparison. Now, based on the pairwise comparison of all countries, we are going to build the medal table. There are a lot of approaches, which use pairwise comparison to create the ranking (or partially ordered list). One of them is the ELECTRE method proposed by Bernard Roy. This approach, known as the French School of decision making, aims at comparing each pair of alternatives. After that, an exploitation procedure is used, Benayoun et al. [6]. A similar method is the PROMETHEE method, Brans [7]. Saaty [8] presents the AHP method which uses pairwise comparisons along with expert judgments to deal with the measurement of qualitative or intangible criteria. Edwards and Barron [9] present SMART and SMARTER methods which are based on pairwise comparison as well. Hansen and Ombler [10] introduce another method which uses pairwise comparisons of alternatives, namely the PAPRIKA method for multicriteria decision making based on decision-makers’ preferences.
-
A. League table and medal table
In spite of the cited above literature we want to use a different approach. The reason is the structure of our problem – we consider a problem connected with sport. Thus, in sport the case of pairwise comparison is named a match. Similarly, we arrange a match between countries by pairwise comparison. Moreover, in sport, if the teams take part in all-play-all tournament then a league table is used to create the ranking. We want to use the league table as well. Our matches between countries end by a win or a draw, similarly like in soccer, hockey or handball etc. In these sports similar scoring systems are used. We are going to use the system from soccer: for a win – 3 points, for a draw - 1 point and for a lose – 0 points. Moreover, every match ends with goals scored by teams, similarly in our pairwise comparison every comparison ends with percentages obtained (scored) by countries. Thus, following the points-goals system we use the points-percentages system.
Let us notice a difference between goals (in soccer) and percentages (in our pairwise comparison). In system of goals we look at scored and conceded goals. Whereas, in system of percentages we can only look at the percentages scored, because in every macth a sum of percentages (scored and conceded) is equal to 100%.
At the beginning of the presentation of this approach let us consider two illustrative examples and after that we present the general description and notation.
-
B. Example – the medal table (continuation of example II.2)
We consider three leading countries taking part in Winter Olympic Games in Vancouver 2010: Canada, Germany and the USA. The medals won by each of these countries were described by example 2.2. Similarly, like in examples III.1-3 we pairwise compare these countries and obtain:
-
1. Germany - Canada 67%–33% (3 points for
-
2. USA - Germany 94%-6% (3 points for USA and 0 for Germany)
-
3. USA – Canada 80%-20% (3 points for USA and 0 for Canada)
Germany and 0 for Canada)
Based on the above results we obtain the medal table presented in table 1.
-
C. Example – the medal table (continuation of example III.5)
Based on the results from example III.5 we obtain the medal table presented in table 2.
The next part of our work is a description of building the league table (the medal table). Generally, it is similar to the soccer league, but points-goals system is replaced by points-percentages system.
-
D. Description and notation of the medal table
To build the medal table for I countries we have to do the following:
-
1. Pairwise compare all countries, for all i,j E 7 (i = у): a. Obtain the percentages: рц, pj^ .
-
b. Give points (3, 1 or 0) for these two countries by
-
2. Calculate points and scored percentages, for all :
comparing r J r
-
a. Calculate a sum of won points (based on 1b).
-
b. Calculate a sum of scored percentages (based on 1b).
-
3. Build the medal table according to points. In the case of the same points, take the scored percentages.
TABLE 1. THE MEDAL TABLE FOR LEADING COUNTRIES FOR WINTER OLYMPICS IN 2010.
country
points
Percentages scored (1=100%)
wins-draws-losses
1
USA
6
1,74
2-0-0
2
Germany
3
0,73
1-0-1
3
Canada
0
0,53
0-0-2
TABLE 2. THE MEDAL TABLE FOR EXAMPLE III.4..
country
points
Percentages scored (1=100%)
wins-draws-losses
1
ш1
3
1,03
1-0-1
2
m~
3
1,01
1-0-1
3
m3
3
0,96
1-0-1
-
V. APPLICATIONS
-
V .1. World Aquatics Championships in Shanhgai 2011
-
We consider the 2011 World Aquatics Championships in Shanghai. The championships featured five aquatics disciplines: swimming, water polo, diving, open water and synchronized swimming. Table 3 presents the medal table narrowing it to ten top performing countries. Let us formulate some comments on the results from table 3.
First of all the relation of winning is transitive (but it is not a rule, see example III.5). China is the best and wins all matches (pairwise comparison), Greece is the worst and loses all matches. Let us compare the obtained medal table with the two often used ranking: gold first (“gold rank”), total number of medals (“total rank”). As we can see our ranking is closer to “total rank” than
“gold rank”, but generalization of this observation needs more research.
-
V .2. World Championships in Athletics, Daegu 2011
We build the medal table for the 2011 World Championships in Athletics in Daegu. Table 4 presents this medal table narrowing it to ten top performing countries. Let us formulate some comments on the results from table 4. Similarly like in table 3, here the relation of winning is transitive as well. The USA is the best and wins all pairwise comparison (each with 100% scored). Ukraine is the worst and loses all pairwise comparison (each with 0% scored). Let us notice that, in this case, three considered rankings (our ranking, “gold rank” and “total rank”) generate very similar medal tables. The reason are the numbers of the medals won by countries – these numbers form almost a linear order.
TABLE 3. THE MEDAL TABLE FOR THE 2011 WORLD AQUATICS CHAMPIONSHIPS.
|
country- (gold, silver, bronze) |
points |
Percentages scored (1=100%) |
wins-draws-losses |
gold rank |
total rank |
|
|
1 |
China-(17,6,9) |
27 |
8,91 |
9-0-0 |
2 |
1 |
|
2 |
USA-(15,13,8) |
24 |
8,09 |
8-0-1 |
1 |
2 |
|
3 |
Russia-(8,6,4) |
21 |
7,00 |
7-0-2 |
3 |
3 |
|
4 |
Australia-(2,10,4) |
18 |
5,94 |
6-0-3 |
7 |
4 |
|
5 |
Italy-(3,4,2) |
15 |
4,54 |
5-0-4 |
5 |
6 |
|
6 |
France-(2,4,5) |
12 |
4,16 |
4-0-5 |
8 |
5 |
|
7 |
Great Britain-(3,3,0) |
9 |
3,07 |
3-0-6 |
6 |
7 |
|
8 |
Brazil-(4,0,0) |
6 |
1,96 |
2-0-8 |
4 |
9 |
|
9 |
Netherlands-(2,1,3) |
3 |
1,33 |
1-0-9 |
9 |
7 |
|
10 |
Greece-(2,1,1) |
0 |
0,00 |
0-0-10 |
10 |
9 |
TABLE 4. THE MEDAL TABLE FOR THE 2011 WORLD CHAMPIONSHIPS IN ATHLETICS.
|
country- (gold, silver, bronze) |
points |
Percentages scored (1=100%) |
wins-draws-losses |
gold rank |
total rank |
|
|
1 |
USA-(12,8,5) |
27 |
9,00 |
9-0-0 |
1 |
1 |
|
2 |
Russia-(9,4,6) |
24 |
8,00 |
8-0-1 |
2 |
2 |
|
3 |
Kenya-(7,6,4) |
21 |
7,00 |
7-0-2 |
3 |
3 |
|
4 |
Jamaica-(4,4,1) |
18 |
6,00 |
6-0-3 |
4 |
4 |
|
5 |
Germany-(3,3,1) |
15 |
5,00 |
5-0-4 |
5 |
5 |
|
6 |
Great Britain-(2,4,1) |
12 |
4,00 |
4-0-5 |
6 |
5 |
|
7 |
China-(1,2,1) |
9 |
2,67 |
3-0-6 |
7 |
8 |
|
8 |
Ethiopia-(1,0,4) |
6 |
2,00 |
1-0-9 |
9 |
7 |
|
9 |
Australia-(1,1,1) |
3 |
1,33 |
2-0-8 |
8 |
9 |
|
10 |
Ukraine-(1,0,1) |
0 |
0,00 |
0-0-10 |
10 |
10 |
-
VI . SUMMARY
We propose an approach to build the medal table based only on the points for medals. Using some reasonable assumptions for the points we operate on the set of feasible points. Having two countries we compare them by area of the feasible points for which they are better and obtain two values of percentage: the percentage for the first country and for the second country. By comparing these percentages we get the result of the pairwise comparison as a win of one country or a draw. After pairwise comparison we adopt a league table, method of ranking used in sport. The reason is the structure of our problem – we consider a problem coming from sport. Our matches between countries end by a win or by a draw, like in some sport disciplines, for example soccer. Therefore, we apply the system of points from soccer: for a win – 3 points, for a draw - 1 point and for a lose – 0 points. Moreover, every match ends with goals scored by teams, similarly in our pairwise comparison every comparison ends with percentages obtained (scored) by countries. Thus, following the points-goals system we use the points-percentages system for building a medal table. We apply our method in two World Championships:
-
- the 2011 World Championships in Athletics in Daegu. - the 2011 World Aquatics Championships in Shanghai.
References Rankings in Sport by Pairwise Comparison and League Table
- Saaty T., L. (2008), Who won the 2008 Olympics? A multicriteria decision of measuring intangibles, Journal of Systems Science and Systems Engineering, 17/4, 473-486.
- Wu J., Liang L., Yang F. (2009), Achievement and benchmarking of countries at the Summer Olympics using cross efficiency evaluation method, European Journal of Operational Research, 197, 722-730.
- Lins M.P.E., Gomes E.G., Soares de Mello J.C.C.B., Soares de Mello A.J.R. , (2003), Olympic ranking based on a zero sum gains DEA model, European Journal of Operational Research, 148/2, 312-322.
- Sitarz S. (2012), Mean value and volume-based sensitivity analysis for Olympic rankings, European Journal of Operational Research, 216, 232-238.
- Sitarz S. (2013), The Medal points' incenter for rankings in sport, Applied Mathematics Letters, 26, 408-412, 2013
- Benayoun R., Roy B., Sussman B. (1966), ELECTRE : Une m′ethode pour guider le choix en pr′esence de points de vue multiples, Note de travail 49, SEMA-METRA International, Direction Scienti?que.
- Brans J.P. (1982), L'ingénierie de la décision: élaboration d'instruments d'aide à la décision. La méthode PROMETHEE, Presses de l'Université Laval.
- Saaty T. (1980), The Analytic Hierarchy Process: Planning, Priority Setting, Resource Allocation, McGraw-Hill.
- Edwards W., Barron F.H. (1994), SMARTS and SMARTER: Improved simple methods for multiattribute utility measurement, Organizational Behavior & Human Decision Processes, 60, 306-25.
- Hansen P., Ombler F. (2009), A new method for scoring multi-attribute value models using pairwise rankings of alternatives, Journal of Multi-Criteria Decision Analysis, 15, 87-107.
