Распределение тензорной анизотропии космических лучей в окрестности нейтрального токового слоя

Автор: Гололобов П.Ю., Кривошапкин П.А., Крымский Г.Ф., Григорьев В.Г., Герасимова С.К.
Журнал: Солнечно-земная физика @solnechno-zemnaya-fizika
Статья в выпуске: 2 т.3, 2017 года.
Бесплатный доступ
Исследуется временной профиль изотропной интенсивности, компонент векторной и тензорной анизотропии космических лучей (КЛ) в периоды пересечений Землей нейтральной поверхности межпланетного магнитного поля (ММП) в 23-24 циклах солнечной активности. Для определения момента пересечения используется синоптическая карта обсерватории Вилкокса и данные о напряженности ММП. Из дальнейшего анализа исключены периоды Форбуш понижений и наземных возрастаний солнечных КЛ. События анализируются для эпох с положительной и отрицательной полярностями общего магнитного поля Солнца. А также внутри каждой эпохи отдельно выделены переходы от сектора с положительным знаком к сектору с отрицательным знаком и, наоборот, переход от отрицательного знака к положительному. Всего отобрано 213 событий пересечений. Для каждого события с помощью метода глобальной съемки были получены первые две сферические гармоники углового распределения КЛ. Среднее число станций, данные которых использованы в каждом событии, составило в среднем 32. В результате анализа данных полученных вышеуказанными методами показано, что временное изменение изотропной компоненты вызвано возникновением магнитной пробки. Впервые надежно выделены зональные гармоники, доказано существование в области малой энергии антисимметричной суточной вариации КЛ, ориентированной вдоль ММП. Приведено сравнение с ранее полученными результатами.
Космические лучи, тензорная анизотропия, нейтральный токовый слой, сosmic rays
Короткий адрес: https://sciup.org/142103638
IDR: 142103638 | УДК: 524.1 | DOI: 10.12737/22603
Distribution of tensor anisotropy of cosmic rays near the neutral current sheet
We analyze time profiles of isotropic intensity, components of vector and tensor anisotropies of cosmic rays (CR) when Earth crosses the neutral sheet of the interplanetary magnetic field (IMF) in solar activity cycles 23-24. The moments of the crossings are determined from Wilcox Observatory synoptic charts and IMF data. Periods of Forbush decreases and ground level enhancements are excluded from the analysis. The events are analyzed for the epochs of positive and negative signs of the Sun’s general magnetic field. During each epoch, the crossings from the positive sector to the negative one and vice versa are separated. In total, 213 crossing events have been selected. The first two spherical harmonics of the angular CR-distribution are obtained using the global survey method. In each case, the average number of stations is equal to 32. The analysis shows that the temporal change of the isotropic component is caused by a magnetic mirror. For the first time, the zonal harmonics are reliably distinguished, and the existence of the antisymmetric diurnal CR-variation in a low energy range, which is oriented along IMF, is recognized. We compare our results with those obtained earlier.
Текст научной статьи Распределение тензорной анизотропии космических лучей в окрестности нейтрального токового слоя
The neutral current sheet (NCS) of the interplanetary magnetic field (IMF) has a specific corrugated structure as a relatively thin layer that separates opposite polarities of the Sun’s magnetic field [Svalgaard, 1972; Sval-gaard, Wilcox, 1975]. NCS extends from the Sun to the heliopause boundaries, and its wave structure causes two- or four-sector IMF structure to form in the solar equatorial region [Hoeksema, Wilcox, Scherrer, 1983]. Thus, Earth when rotating around the Sun periodically experiences transitions between positive and negative IMF sectors.
Earlier [Krymsky et al., 2012], we have examined the behavior of angular CR distribution when Earth crosses NCS, but as information on CR flux we used then only data from the neutron monitor station Moscow for January 1978 – January 2009. In the current study, the investigations are continued and expanded. We employ data from 32 stations of the worldwide network of neutron monitors and IMF and solar wind (SW) parameters from the OmniWeb database [ ]. The neutron monitor data are processed using the global survey method [Altukhov, Krymsky, Kuzmin, 1970]. We have thus obtained the components of the first two spherical harmonics of angular CR-distribution such as isotropic intensity, vector and tensor anisotropies.
-
V .G. Grigoryev
-
Yu.G. Shafer Institute of Cosmophysical Research and Aeronomy SB RAS,
Yakutsk, Russia
S.K. Gerasimova
-
Yu.G. Shafer Institute of Cosmophysical Research and Aeronomy SB RAS,
Yakutsk, Russia ical harmonics of the angular CR-distribution are obtained using the global survey method. In each case, the average number of stations is equal to 32. The analysis shows that the temporal change of the isotropic component is caused by a magnetic mirror. For the first time, the zonal harmonics are reliably distinguished, and the existence of the antisymmetric diurnal CR-variation in a low energy range, which is oriented along IMF, is recognized. We compare our results with those obtained earlier.
METHODS AND APPROACHES
We have used continuous observations of CR intensity obtained at the worldwide network of neutron monitors in 1994–2011. Periods of the Sun’s general magnetic field reconnections are excluded from the analysis.
The time moments when Earth crosses NCS are identified using synoptic charts from the Wilcox Solar Observatory [], with the solar wind speed equal to ~400 km·s–1 (q.v. [Krymsky et al., 2012]). Since this approach gives only a rough estimation of the crossing time, we also employ the IMF Bx and By components from the OmniWeb database. A simultaneous change of both Bx and By signs indicates the NCS crossing; moreover, this allows us to estimate the clearness of crossing boundaries as Bx and By stability before and after the crossing. The same approach is used by other authors (e.g. [Thomas et al., 2014]). Notice that abrupt changes of CR intensity such as Forbush decreases and ground level enhancements are excluded from the analysis to get rid of distortion factors.
We classify the selected NCS crossings into four types. The periods of negative ( qA <0) and positive ( qA >0) polarities of the Sun’s general magnetic field are analyzed separately as well as the crossing from the positive sector to the negative one (+/–) and vice versa.
The total number of the selected events for each type is shown in Table. For each event, we analyze a 9-day period (4 days before a crossing and 5 days after).
|
Polarity of the Sun’s general magnetic field |
Negative polarity ( A <0) (2005–2011) |
Positive polarity ( A >0) (1994–1998) |
||
|
Type of crossing |
+/– |
–/+ |
+/– |
–/+ |
|
Number of selected events |
59 |
46 |
57 |
51 |
RESULTS AND DISCUSSION
Mean values of IMF and SW parameters such as SW velocity V sw , IMF intensity modulus | B |, and SW proton density ρ sw are shown in Figure 1. It can be noted that the NCS crossing is accompanied by increases in all the three parameters V sw, | B |, and ρ sw for transition of all of the four types. The average solar wind speed is lower before the crossing than after it.
By processing the database of the worldwide neutron-monitor network with the global survey method, we get the following parameters of CR angular distribution: izotropic R 0 0 , first R 1 0 and second R 2 0 zonal harmonics, symmetric diurnal R 1 1 , antisymmetric diurnal R 2 1 and symmetric semidiurnal R 2 2 components. The composition of the components R 1 0 and R 1 1 is the vector anisotropy, and the composition of R 2 0 , R 2 1 , and R 2 2 is the tensor CR anisotropy [Krymsky et al., 2014]. The obtained values of the zonal harmonics R 1 0 , R 2 0 and the isotropic component R 0 0 are shown in Figure 1. The following can be noted.
-
1. The R 0 0 amplitude is maximum before the NCS crossing and abruptly decreases during the transition. Similar results have been obtained in [Thomas et al., 2014]. Apparently, such behavior of R 0 0 is caused by the magnetic mirror in the region of interaction between fast and slow SW flows, which prevents the penetration of CR particles and leads to a CR intensity decrease during the crossings. A schematic representation of this process as well as the R 0 0 variation expected in this case are shown in Figure 2;
-
2. The first zonal harmonic R 1 0 during the crossing from the positive sector to the negative one experiences a decay (decrease in the CR flow from the northern hemisphere); and during the opposite crossing, a rise (increase in the CR flow from the northern hemisphere). This conclusion is valid both for positive and negative polarities of the Sun’s general magnetic field. In other words, in the positive sector, R 1 0 is always higher than in the negative one. Such behavior can be explained by a drift of particles along NCS and by the fact that Earth crosses NCS at a certain angle. Under specific conditions, at sector boundaries this drift can generate a CR current perpendicular to the IMF field lines, thus causing the CR north-south anisotropy.
-
3. Under negative polarity of the Sun’s general magnetic field, R 2 0 does not reveal any considerable changes during NCS crossings, but under positive polarity, R 2 0 varies with an amplitude of about 0.1 %. The
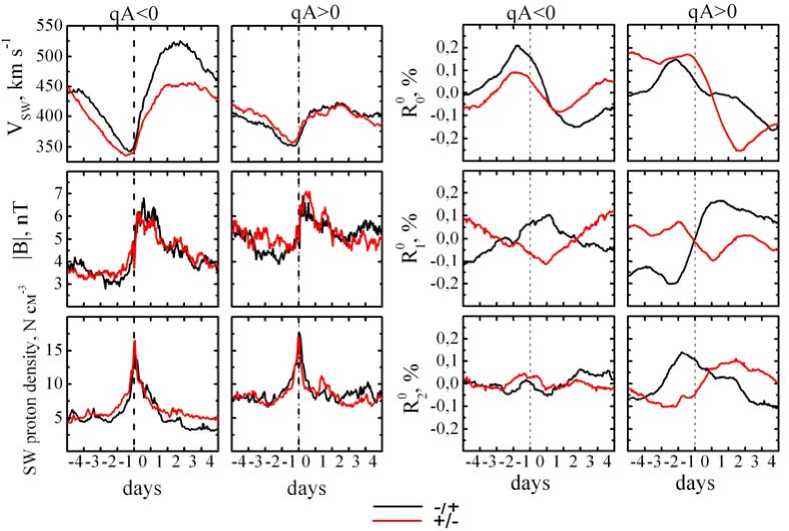
Figure 1. Behavior of SW speed V sw , IMF intensity modulus | B |, SW proton density ρ sw , and isotropic R 0 0 and zonal components R 1 0 , R 2 0 4 days before and 5 days after the NCS crossing, obtained using the global survey method. Time moments of the crossings are indicated by vertical dotted lines. The transition from the positive sector to the negative one are shown by red curves; and from the negative sector to the positive one, by black curves. Transitions during positive and negative polarities of the Sun’s general magnetic field are designated by qA <0 and qA >0 respectively
Distribution of tensor anisotropy of cosmic rays near the neutral current sheet
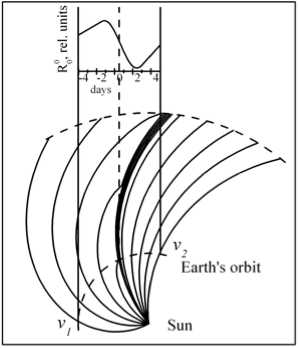
Figure 2. Scheme of interaction between slow and fast SW streams, where v 1 and v 2 are the speeds of catching-up and falling-down sectors such that v 1> v 2. In addition, the expected isotropic intensity R 0 0 is shown
R 2 0 variations reflect a difference in CR flows between polar and equatorial latitudes. The excess of the CR flow from polar latitudes produces a positive R 2 0 , and the excess of the CR flow from equatorial latitudes results in a negative R 2 0 . The R 2 0 variations can be caused by many factors such as various physical processes, changes in magnetospheric conditions, rigidity CR spectrum, etc. Therefore, further investigations should be performed to unambiguously define the nature of these variations.
The behavior of the observed zonal harmonics and IMF parameters allows us to suggest that it takes Earth on average three days to cross the region of NCS influence on CR angular distribution.
The R 1 1 , R 2 1 and R 2 2 vector diagrams for crossings of all the four types are shown in Figure 3. All components are stable enough and do not reveal any considerable amplitude-phase oscillations during the NCS crossings.
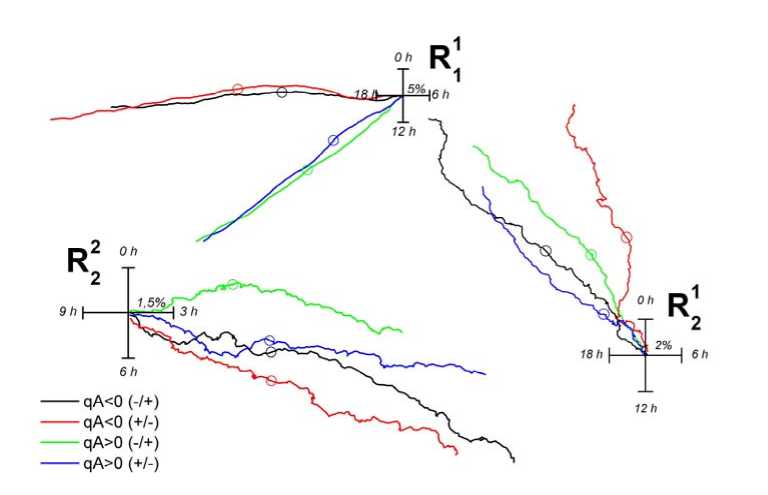
Figure 3. Behavior of R 1 1 , R 2 1 , and R 2 2 4 days before and 5 days after the NCS crossings. Crossings of different types are marked with different colors. Circles are moments of the crossings
The R 1 1 phase noticeably differs for the cases of opposite polarities of the Sun's magnetic field: in average, it is equal to 15 LT for the negative polarity and 18 LT for the positive one. Such behavior of R 1 1 is quite common and can be explained by the convective diffusion and drift theory of CR propagation [Krymsky et al., 2008]. The tensor anisotropy components R 2 1 and R 2 2 for both positive and negative polarities have phases equal to 22 and 3.5 hr respectively. These phases correspond to mechanisms of CR magnetic screening by the sectoral IMF and shear SW flow [Krymsky et al., 2014].
CONCLUSIONS
By processing data from the worldwide network of neutron monitors with the global survey method, we have obtained components of the first two spherical harmonics of angular CR-distribution for NCS crossings.
We have found that the isotropic component R 0 0 decreases abruptly during the crossings. Such behavior is caused by the magnetic mirror in the region of interaction between fast and slow SW streams in catching-up and falling behind the IMF sectors, which prevents penetration of CR particles.
We have established that the Earth transition from the negative sector to the positive one results in an R 1 0 increase and the opposite transition results in an R 1 0 decrease.
We have observed that symmetric diurnal, antisymmetric diurnal and symmetric semidiurnal variations of CR intensity do not reveal any significant changes during the NCS crossings.
The observed variations of R 1 0 , R 2 0 call for further investigations.
The work was supported by RFBR grants Nos. 15-42-05085-r_vostok_a, 15-42-05083-r_vostok_a and by RAS Presidium Program of Fundamental Research No. 23 “High-energy physics and neutrino astrophysics”.
Список литературы Распределение тензорной анизотропии космических лучей в окрестности нейтрального токового слоя
- Altukhov A.M., Krymsky G.F., Kuzmin A.I. The method of "Global survey" for investigating cosmic ray modulation. Proc. 11th Int. Cosmic Ray Conf. 1970, vol. 4, pp. 457-460.
- Hoeksema T., Wilcox J.M., Scherrer P.H. The structure of the heliospheric current sheet -1978-1982. J. Geophys. Res. 1983, vol. 88, pp. 9910-9918 DOI: 10.1029/JA088iA12p09910
- Krymsky G.F., Krivoshapkin P.A., Gerasimova S.K., Gololobov P.Yu. Cosmic-Ray Anisotropy and Density Near the Neutral Sheet of the Interplanetary Magnetic Field. Astronomy Letters. 2012, vol. 38, no. 9, pp. 605-608 DOI: 10.1134/S1063773712080038
- Krymsky G.F., Krivoshapkin P.A., Gerasimova S.K., Gololobov P.Yu. Tensor anisotropy of cosmic rays. Astronomy Letters. 2014, vol. 40, issue. 4, pp. 230-233. DOI: 10.1134/S1063773714040045.
- Krymsky G.F., Krivoshapkin P.A., Mamrukova V.P., Grigoryev V.G., Gerasimova S.K. Vortex electric field in interplanetary medium and the 11-year modulation of galactic cosmic ray anisotropy. Proc. 30th Int. Cosmic Ray Conf. 2008, vol. 1, рр. 585-588.
- Svalgaard L. Interplanetary magnetic-sector structure, 1926-1971. J. Geophys. Res. 1972, vol. 77, pp. 4027-4034 DOI: 10.1029/JA077i022p04027
- Svalgaard L., Wilcox J.M., Long-term evolution of solar sector structure. Solar Phys. 1975, vol. 41, pp. 461-475 DOI: 10.1007/BF00154083
- Thomas S.R., Owens M.J., Lockwood M., Scott C.J. Galactic cosmic ray modulation near the heliospheric current sheet. Solar Phys. 2014, vol. 289, pp. 2653-2668 DOI: 10.1007/s11207-014-0493-y
