RBCs and Parasites Segmentation from Thin Smear Blood Cell Images

Author: Vishal V. Panchbhai, Lalit B. Damahe, Ashwini V. Nagpure, Priyanka N. Chopkar
Journal: International Journal of Image, Graphics and Signal Processing(IJIGSP) @ijigsp
Article in issue: 10 vol.4, 2012.
Free access
Manually examine the blood smear for the detection of malaria parasite consumes lot of time for trend pathologists. As the computational power increases, the role of automatic visual inspection becomes more important. An automated system is therefore needed to complete as much work as possible for the identification of malaria parasites. The given scheme based on used of RGB color space, G layer processing, and segmentation of Red Blood Cells (RBC) as well as cell parasites by auto-thresholding with offset value and use of morphological processing. The work compare with the manual results obtained from the pathology lab, based on total RBC count and cells parasite count. The designed system successfully detects malaria parasites and RBC cells in thin smear image.
Segmentation, Thresholding, RGB, Malaria parasites, RBC
Short address: https://sciup.org/15012450
IDR: 15012450
Text of the scientific article RBCs and Parasites Segmentation from Thin Smear Blood Cell Images
Published Online September 2012 in MECS
Malaria are protozoan parasites belonging to the subclass coccidian and this disease transmitted by the Anopheles mosquito, caused by minute parasitic protozoa of the genus Plasmodium, which infect human first in the cells of the liver and then in the red cells, and insect hosts alternatively. It probably originated in Africa and accompanied human migration to the Mediterranean shores, India and South East Asia. In the past it used to be common in the marshy areas around Rome and the name is derived from the Italian, (mal-aria) or "bad air"; it was also known as Roman fever. The detection techniques, today includes manual laboratory diagnosis of blood analysis. Generally in blood analysis, pathologist looks for three different kinds of cells, red, white and blood platelets. Their dimensions and their color distinguish these. In malarial blood the red corpuscles of vertebrates are infected by malaria parasites.
Plasmodium, the protozoan parasite that causes malaria, exists in a variety of different forms, which have successfully adapted to different cellular environments, in both the vertebrate host and the mosquito vector. The parasite develops in a highly regulated manner through distinct cycles in the vertebrate host. In malarial blood we have to look for red cells, and mature Malaria is one of the predominant tropical diseases in the world causing wide spread sufferings and deaths in the developing countries. The world health organization reports 300 to 500 million clinical cases of malaria each year resulting in 1.5 to 2.7 million deaths. About 40% of the world's populations about two billion people are at risk in about 90 countries and territories. If the time of malaria diagnosis will be less or minimize we can save a human lives. Therefore the present paper aims at automating the process of blood smear screening for malaria parasite detection.
The paper is organised as follows. Section II describes related work. Section III describes the background. In section IV, the proposed work is presented. Finally, section V shows the experimental results and section VI concludes the paper with future scope.
-
II. Releted work
Malaria is the important issue around the world and as contribution point of view different authors presented their work. Some of them are briefly describe here.
Automated image analysis-based software “Malaria Count” for parasitemia determination, i.e. for quantitative evaluation of the level of parasites in the blood, has been described in [1]. The presented system is based on the detection of edges representing cell and parasite boundaries. The described technique includes a preprocessing step, edge detection step, edge linking, clump splitting, and parasite detection. The preprocessing of the image, which involves the enhancement of the image contrast via adaptive histogram equalization, is followed by edge detection, where a pixel is determined to belong to the boundary edge of the red blood cells if a defined edge correlation coefficient exceeds an empirically determined threshold. The terminal points are identified using 20 different 3 × 3 masks. The system requires well-stained and well-separated cells in order to provide accurate result. Moreover, artifacts, 'holes' inside red blood cells and noise can lead to a false interpretation of a red blood cell. The program is not intended for studies involving patient samples.
Sadeghian et al. [2] demonstrated a framework for segmenting white blood cells using digital image processing. This grey level image processing scheme has divided into two parts, first, nucleus segmentation based on morphological analysis, and then cytoplasm segmentation is based on pixel-intensity thresholding. The segmentation is conducted using a presented segmentation framework that consists of an integration of several digital image processing algorithms. Twenty microscopic blood images were tested, and the presented framework managed to obtain 92% accuracy for nucleus segmentation and 78% for cytoplasm segmentation. The results indicate that the presented framework is able to extract the nucleus and cytoplasm region in a WBC image sample.
In [3] a scheme based on HSV color space that segments Red Blood Cells and parasites by detecting dominant hue range and by calculating optimal saturation thresholds is presented. Methods that are less computation-intensive than existing approaches are proposed to remove artifacts. The scheme is evaluated using images taken from Leishman-stained blood smears. Sensitivity of the scheme are found to be 83% The method operates in HSV space and is dynamic in the sense that relevant thresholds are determined from the statistics of the given image rather than keeping them fixed for all images. Schemes are proposed to determine optimal saturation thresholds to segment RBCs and chromatin dots that are robust with respect to the color variability encountered. The similar color space used in our previous work [4]. We have used S and V component images of HSV color model. These images are segmented by using Zack’s thresholding technique, sequential edge linking algorithm, Euclidian distance based clustering.
The research paper [5] work introduces a blood image processing for detecting and classifying malarial parasites in images of Giemsa stained blood slides, in order to evaluate the parasitaemia of the blood. To detect the red blood cells that is infected by malarial parasites using statistical based approach. To separate automatically the parasites (trophozoites, schizonts and gametocytes) from the rest of an infected blood image using color, shape and Size information and compare the image with infected images after transformation of image by scaling, shaping to reconstruct the image. The images returned are statistically analyzed and compare to generate a mathematical base. Also the evaluation of the size and shape of the nuclei of the parasite is also considered.
The architecture presented in [6] of a system of quantitative microscopy which yields an integrated platform for the morphological image analysis, pattern recognition, and visual content-based indexing of peripheral blood smear wide microscopic fields. A global image-based approach is used for the analysis and indexation of peripheral blood smear teleslide images which provides an objective description and classification of blood cells and which is designed to assist pathologist to diagnose hematological disorders in first phase. In second phase, erythrocyte morphology (shape and color) and erythrocyte inclusions yield important knowledge for detection of malaria status and seriousness.
Ruberto et al. [7] introduces morphological approach to cell image segmentation more accurate than the normal watershed based algorithm. The used non-flat disk-shape structuring element enhanced the roundness and compactness to improving the accuracy of normal watershed based algorithm whereas flat disk-shape structuring element to separate overlapping cells. These methods make use of knowledge of the RBC structure that is not used in existing watershed based algorithm.
Some of the authors contributed the detection of malarial parasites based on Support Vector Machine and Neural network .The paper by Diaz et al. [8] evaluates a color segmentation technique for separation of pixels into three different classes: parasite, red blood cell and background, based on standard supervised classification algorithms. Four different supervised classification techniques – KNN, Naive Bayes, SVM and Neural network – are evaluated on different color spaces – RGB, normalized RGB, HSV and YCbCr. But the complex mix of colors present in the parasites makes it difficult to discriminate individual pixels using only color information. A method by Chen Pan et al. [9] is based on image-retrieval to classify cell image from high similarity image databases. RGB color histogram of cell and two intensity histograms corresponding to those local regions compose feature vector represents the cell image. Kernel principal component analysis (KPCA) is utilized to extract effective features from the feature vector. The weight coefficients of features are estimated automatically using relevance feedback strategy by linear support vector machine (SVM). Classification depends on the decision distance obtained by SVM and the nearest center criterion.
Premaratnea et al. [10] used digital images of oil immersion views from microscopic slides captured though a capture card. They were preprocessed by segmentation and grey scale conversion to reduce their dimensionality and later fed into a feed forward back propagation neural network (NN) for training it. Digital images were segmented to 64 × 64 pixels images to be used as a training data set. The other reason for the segmentation was to make sure that the ANN’s was kept to the smallest possible size in order to achieve easier training.
In this approach [11] the parasitamia measure was carried out by partitioning the uninfected and infected cells using an unsupervised and in comparison a trainingbased technique. Based on pattern matching with parameter optimization and cross-validation against the expected biological characteristics, Red blood cells are determined. The selection of the infected cells out of the set of found RBCs was carried out using Variance based while the second one uses a color co-occurrence matrix. This approach is accounts for uncertain imaging conditions due to microscope settings as well as the quality of the blood smear preparation. In order to tackle in homogeneous backside illumination, compensation of imaging variability was carried out.
Some authors contributed for the malaria detection based on third harmonic generation and flow cytometry with fluorescence staining. Highly sensitive optical-based detection of malaria-infected blood cells by third harmonic generation (THG) imaging of hemozoin pigment that is naturally deposited by the parasite during its lifecycle is presented in [12]. This method allows a rapid detection of early stage infections of blood cells. Automated malaria detection by flow cytometry in combination with fluorescence staining was previously investigated [13], but ‘‘background noise’’ limited the detection to 2000 par/mL of blood. However, in comparison, THG images have much higher detection. The malaria parasite infections can be specifically detected in infected red blood cells by imaging THG emission from the hemozoin using infrared femtosecond pulsed laser excitation. Existing technology suggests that a flow cytometry device could be adapted using THG emission for automated stain-free diagnosis based on parasitamia counts, which would also lower the minimum parasitamia levels that are detectable.
-
III. Backround
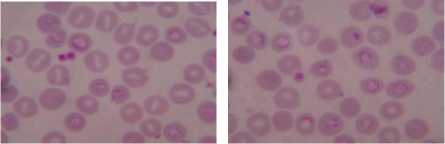
There are two types of blood smear available for the detection of Malaria parasites that is thin and thick smear. The selection of thick and thin film is very important. Because some patients have low parasite densities so in this case thick films (figure 1a), which increase the sensitivity of the diagnostic process. However, in most cases there will be a sufficient number of parasites present in the blood for a diagnosis to be made using the thin film (figure 1b). Sometimes in thin films, confusion may arise when a platelet lies on top of or beside a red cell, especially if it is associated with a small fragment of blue stained material. Howell Jolly bodies may also look like parasites when associated with blue stain deposits. This kind of artifact is much more difficult to distinguish from true malaria parasites in the thick region of a blood film, where cells are packed on top of each other. Again one major problem in this context is that a large number of RBCs are overlapping.
The different types of malaria normally found around the world and they are Plasmodium falciparum, Plasmodium vivox, Plasmodium ovale, and Plasmodium malariae [14]. In malarial blood pathologists look for red cells, white cell, parasites in different stages of life, immature and mature trophozoites, schizonts and gametocytes.
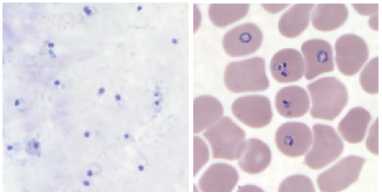
a)
b)
Figure 1.(a) Thick smear image ( b) Thin smear image
It is difficult to differentiate between various stages, but S. Raviraja et al. [8] contributed for identification of different stages based on color, shape and size. But due to use of statistical approach results are not up to the mark.
-
IV. Proposed approach
The literature proposed by the different authors using the processing on gray scale image and color image. If we are using the proper color space and segmentation technique then possible to extract better result for the detection of parasite as well as RBC from thin smear images.
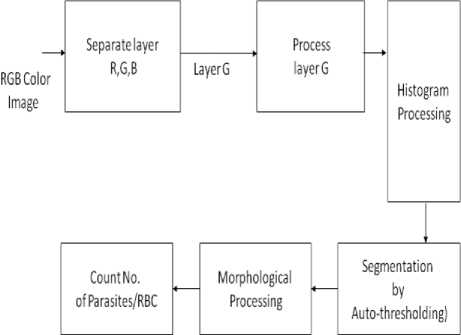
Figure 2. Systematic Flow of Methodology
We are using RGB color space model in this methodology. We first separate out the RGB image into three different layers R, G, and B. By performing the processing on G layer, we can segment the infected RBC cells out of all. The selection of thresholding required to analyses the histogram of the given images which give you the best selection of thresholding. But for the automatic selection of thresholding we are adopting Otsu algorithm discusses in section A.
-
A. Otsu Algorithm
In computer vision and image processing, Otsu's method is used to automatically perform histogram shapebased image thresholding, or the reduction of a gray level image to a binary image. The algorithm assumes that the image to be thresholded contains two classes of pixels (e.g. foreground and background) then calculates the optimum threshold separating those two classes so that their combined spread (intra-class variance) is minimal.
Algorithm [15]
-
1. Compute histogram and probabilities of each intensity level
-
2. Set up initial ωi(0) and μi(0)
-
3. Step through all possible thresholds г = 1 . . maximum intensity
-
a. Update ω i and μ i
-
b. Compute
-
4. Desired threshold corresponds to the maximum s|m
Otsu's thresholding method involves iterating through all the possible threshold values and calculating a measure of spread for the pixel levels each side of the threshold, i.e. the pixels that either falls in foreground or background. The aim is to find the threshold value where the sum of foreground and background spreads is at its minimum.
-
B. Morphological Processing
Morphology is a broad set of image processing operations that process images based on shapes. Morphological operations apply a structuring element to an input image, creating an output image of the same size. The most basic morphological operations are dilation and erosion. In a morphological operation, the value of each pixel in the output image is based on a comparison of the corresponding pixel in the input image with its neighbors. By choosing the size and shape of the neighborhood, you can construct a morphological operation that is sensitive to specific shapes in the input image.
By converting the image into binary form, some of the images created holes that disturb the solidness of the object. A hole is a set of background pixels that cannot be reached by filling in the background from the edge of the image. By using the image morphology we are filling the holes. Due to various in intensity levels the segmented objects are splits into subparts and treated as the multiple objects which may give improper result. Hence we are applying the erosion on hole filled object with the help of circular structuring element. The image morphology, create a option to calculate the objects which may be parasites or RBC cells with the help of labeling the image.
-
V. Experimental results
The given methodology we have designed and implemented by using matlab 7.3 having a RAM of 4 GB. The program is written in matlab editor and various input output functions are use for reading and displaying the data (image info.). Some function is inbuilt in matlab and some of them are created by using matlab editor externally.
For the experimentation initially we are collecting the images from CDC [14]. But these images not having any ground truth, hence actual image data collected from the
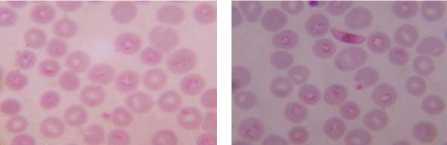
Druv Path Lab, Laxminagar, Nagpur, Maharashtra (India) by the Dr. Sheela Mundhada. Leishman-stained blood smears images, infected by the plasmodium vivox. The images having a size of 1280 × 960 resolution, which will required more computation time or elapsed time as compared to CDC images. Performing the experimentation based on proposed approach on the dataset (figure 3) shows the result that can be comparing with the ground truth dataset of laboratory. Summarization of the result, compare with manual findings for infected RBC, total numbers of RBC and calculated percentage parasitemia, shown in Table I.
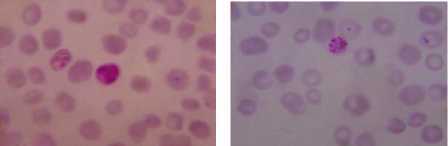
a) b)
c) d)
e) f)
g) h)
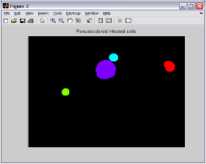
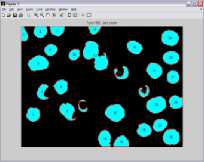
Graphical user interface is designed in Matlab which will display the result in the form of red bounded area for infected RBC cell, pseudo color infected cell and total number of RBC cell. The data collected which will be further utilize for calculating the percentage parasitemia. Thresholding value used for segmentation varies from 108, 113, 111, 61, 117, 116, 159 and 129 for image dataset. Autothresholding is not sufficient for segmenting the images into two categories; hence some offset values can be selected based on trial and error. The thresholding values for the DSC09264 shown in figure 4. The visual results for the sample dataset shows parasites count and RBC count (figure 5).
TABLE I. C omparative R esult S ummery
|
Images |
Manual count of infected RBC |
Our Approach for count of infected RBC |
Manual count of total RBC |
Our Approach for count of total RBC |
% Parasitemia (Manual) |
% Parasitemia (our Approach) |
|
DSC09248.jpg |
5 |
5 |
40 |
36 |
12.50 |
13.89 |
|
DSC09250.jpg |
3 |
4 |
34 |
28 |
8.82 |
14.29 |
|
DSC09261.jpg |
5 |
6 |
29 |
27 |
17.24 |
22.22 |
|
DSC09262.jpg |
5 |
4 |
43 |
40 |
11.63 |
10.00 |
|
DSC09263.jpg |
16 |
18 |
42 |
39 |
38.10 |
46.15 |
|
DSC09264.jpg |
17 |
17 |
42 |
38 |
40.48 |
44.74 |
|
DSC09265.jpg |
22 |
22 |
40 |
32 |
55.00 |
68.75 |
|
DSC09266.jpg |
22 |
18 |
41 |
39 |
53.66 |
46.15 |
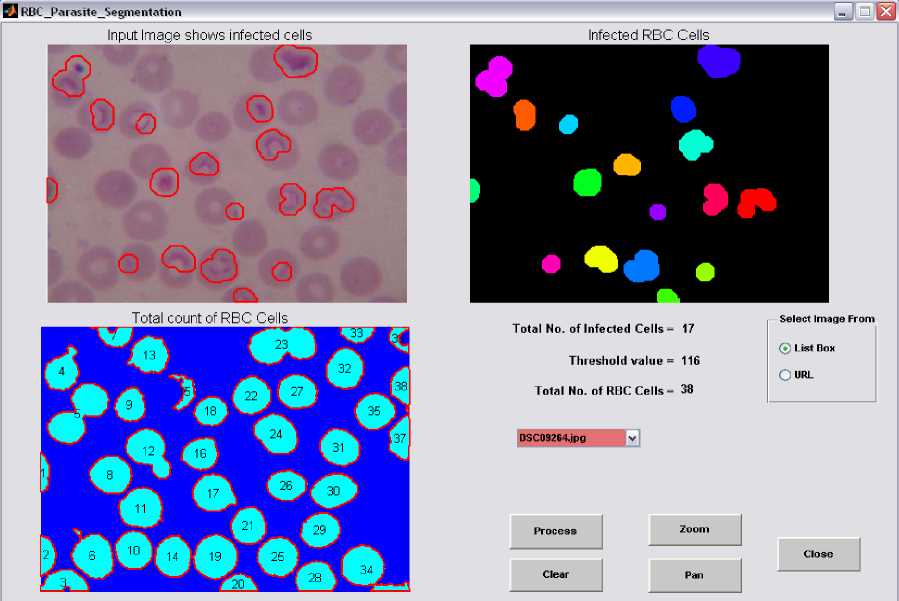
Figure 4. GUI Design for Display of Results with Threshold Value
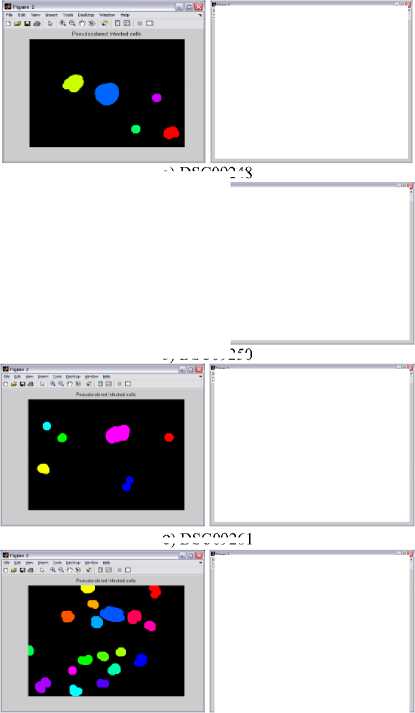
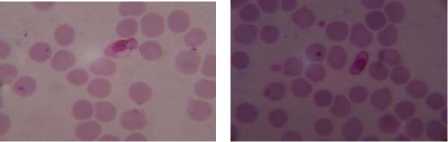
c ) DSC09261
d) DSC09266

a) DSC09248
b) DSC09250
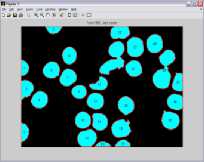
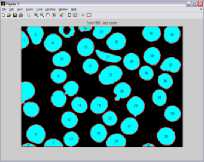
Figure 5. Results of Sample Images With Infected RBC and Total Count Of RBC
-
VI. Conclusion and future scope
We are experimenting with the semi-automated approach for detection of malaria parasite. The selection of G layer from the RGB color space gives better result by performing the segmentation based on Otsu and some offset values.
The proposed scheme reduced the time taken for malaria detection and the chances for human errors. The image (DSC09250) may not give better result for RBC count due to improper illumination during capturing. However, the variability and artifacts in microscope images of blood samples pose significant challenges for accurate detection. In future we try to use the other color spaces and different thresholding techniques. It can be further extended for the detection of different maturity level of malaria parasites.
References RBCs and Parasites Segmentation from Thin Smear Blood Cell Images
- Sio,W.S.S, et al, “MalariaCount: An image analysis-based program for the accurate determination of parasitemia” Journal of Microbiological Methods , ISSN-0167-7012, vol 68, issue 1, pp 11-18, 2007.
- F. Sadeghian, Z. Seman and A. R. Ramli, “A Framework for White Blood Cell Segmentation in Microscopic Blood Images Using Digital Image Processing”, Biological Procedures Online, vol. 11, no. 1, pp. 196-206, Dec. 2009.
- V. V. Makkapati and R. M. Rao, “Segmentation of malaria parasites in peripheral blood smear images”, Proceedings of IEEE International Conference on Acoustics, Speech and Signal Processing, ICASSP 2009, pp. 1361-1364, Apr. 2009.
- L. Damahe, R. Krishna, N. Janwe and Thakur N. V. “Segmentation Based Approach to Detect Parasites and RBCs in Blood Cell Images” International Journal of Computer Science and Applications, ISSN: 0974-1003, ,vol. 4 ,No. 2 ,pp.71-81 , June July 2011
- Diaz, G., Gonzalez, F., Romero, E, “Infected Cell Identification in thin Blood Images Based on Color Pixel Classification: Comparison and Analysis”, CIARP-2007 Springer Berlin, pp. 812-821, 2007.
- J. Angulo and G. Flandrin, “Microscopic image analysis using mathematical morphology: Application to haematological cytology”, Science, Technology and Education of Microscopy: An overview, vol. 1, pp. 304-312, FORMATEX Eds., Badajoz, Spain, 2003
- C. Di Ruberto, A. De mpster, S. Khan and B. Jarra, “Segmentation of blood images using morphological operators”, Proceedings of 15th International Conference on Pattern Recognition Barcelona, Spain, vol. 3, pp. 3401, 2000.
- S. Raviraja, Gaurav Bajpai1 and Sharma S “Analysis of Detecting the Malarial Parasite Infected Blood Images Using Statistical Based Approach”, Proceedings 15, pp. 502-505, 2007.
- C. Pan, X. Yan and C. Zheng, “Recognition of Blood and Bone Marrow Cells using Kernel-based Image Retrieval”, IJCSNS International Journal of Computer Science and Network Security, vol.6 no.10, october 2006.
- S. P. Premaratnea, N. D. Karunaweerab and S. Fernandoc, “A Neural Network Architecture for Automated Recognition of Intracellular Malaria Parasites in Stained Blood Films”, 2003.
- S. Halim, T. Bretschneider, Y. Li, P. Preiser and C. Kuss, “Estimating malaria parasitaemia from blood smear images”, Proceedings of IEEE International Conference on Control, Automation, Robot and Visualization, Singapore, 2006.
- M. B. Jonathan, S. Costantino and M. L. Leimanis, “Sensitive Detection of Malaria Infection”, Third Harmonic Generation Imaging, 7 November 2007.
- C. J. Janse and P. H. Van Vianen, “Flow cytometry in malaria detection”, Methods Cell. Biol. 42 Pt. B:295–318, 1994.
- http://www.dpd.cdc.gov/DPDx/HTML/ImageLibrary
- N. Otsu, “A threshold selection method from gray– level histogram,” IEEE Transactions on System Man Cybernatics, Vol. SMC-9, No.1, pp. 62-66, 1979.
- http://www.malariasite.com/malaria/staining_techniques.htm
- Gonzalez, Woods, Eddins, “Digital image processing using matlab”, TMH 2010
