Real time universal scalable wireless sensor network for environmental monitoring application

Author: Idakwo Monday Abutu, Umoh J. Imeh, Tekanyi M.S Abdoulie, Adedokun E. Adewale, Muazu M. Bashir
Journal: International Journal of Computer Network and Information Security @ijcnis
Article in issue: 6 vol.10, 2018.
Free access
There are several wireless sensor network use for environmental monitoring applications. However, most wireless sensor network designed for real time environmental monitoring application are application specific and static in nature. Hence, the need for reprogramming of base station for every change in sensor type or the introduction of new sensor node into the network. More so, since these sensors nodes are deploy by end users in a random region of interest, it is necessary to develop a new plug and play mechanisms with more software modules and more user-friendly interface that is scalable to ease larger area deployment, installation and maintenance. Hence, this paper developed a base station with an auto detection and configuration system for detecting new sensor node, faulty nodes, and update user in real time. The developed system is implemented on a mesh topology network and was calibrated using standard Davis vantage pro2 weather station in Ahmadu Bello University Liquefied Natural Gas Environmental Laboratory and a mean error of 0.12 and root mean square error of 0.14 were obtained.
Auto Detection, Auto Configuration Base Station, Calibration, Real Time, Sensor Node, Wireless Sensor Network
Short address: https://sciup.org/15015611
IDR: 15015611 | DOI: 10.5815/ijcnis.2018.06.07
Text of the scientific article Real time universal scalable wireless sensor network for environmental monitoring application
Published Online June 2018 in MECS
A wireless sensor network (WSN) consist of devices equipped with sensors, radio transceivers, microcontroller that cooperate to form fully connected network of a sensor node [1]. WSN technology has the capability to capture critical high resolution data quickly, process, and transmit for real time monitoring [2].
Most existing WSN real time environmental monitoring systems, are application specific and static in nature [3]. This means that they are programmed to monitor a specific environmental parameter, thereby, requiring reprogramming of the base station for every change in sensor type or introduction of new sensor nodes into the network thereby making the system to be user defined.
More so, to enable reliable detection of observed phenomena in real-life applications, thousands of nodes are usually installed throughout region of interest [4].However, nodes that are at a large distance from the base station will have poor connections to the base station [5] and these increases transmission power due to frequent retransmission [25] . Hence, a mesh topology network [24] is most suitable due to it scalability, selfconfiguration, self-healing and flexibility [5].The mesh topology also provides extension of network coverage without increasing transmission power or receive sensitivity, better reliability via route redundancy, easier network configuration and better device battery life due to fewer retransmissions [21]. For successful application of WSN in environmental monitoring, low cost, easy deployment, and maintenance are substantive but the current software technologies for WSNs lack the feature of dynamic sensing [6] which makes the system application dependent.
In order to increase effectiveness of WSN, sensor systems must increasingly become easily reconfigurable and adjustable to support system evolution and optimization [6]. More so, since most WSNs are deployed by end users, it is paramount to design new plug and play mechanisms with more software modules for friendly user interfaces [7] to ease installation and maintenance. This paper introduced an auto detection and configuration module into the WSN. This enables the end user graphical interface to be adaptable to any sensor type and give real time status of the sensor nodes for easy fault detection which might be due to power outage, communication failure, etc.
The contribution of this paper are highlighted as follows:
-
• The developed system has an auto detection and configuration system for real time detection of new sensor node, new sensor types and faulty sensor nodes on a friendly user interface.
-
• The developed system is scalable as it was
implemented on a mesh network topology which allows sensors node communication beyond the base station range.
-
• The developed system was calibrated using standard Davis vantage pro2 weather station and a mean error of 0.12 and root mean square error of 0.14 were obtained.
-
II. Related Works
In environmental monitoring, sensor networks have been used to monitor varieties of environmental parameters like humidity [8], pressure, temperature, etc. They are also used for event detection like forest fire, floods, disaster monitoring, pollution [9], debris flow [10] or conditions of marine, soil, and atmospheric contexts [11]. It has also been implemented in real time environmental forecasting [12]. It is predicted that in the near future most objects will have an Internet connection which is the Internet of Things (IoT) vision [6].
Ferdoush and Li [8] developed a wireless sensor network system on star a topology network using Arduino, Raspberry pi, XBee, and a number of opensource software packages for monitoring temperature.
Raghavan and Shahnasser [13] similar to Gong and Wang [14] developed an embedded WSN for environmental monitoring using a simple, cost-effective and low-power method. This system offers an innovative approach to storing sensor data and replaces the traditional bulky personal computer with tiny, robust Raspberry pi based MySQL server.
The research in Mesas-Carrascosa et al., [15] presented an open source hardware in monitoring precision agriculture environmental parameters using Arduino, smart phone and a database. This system is useful as it was calibrated using Davis Vantage Pro2 weather station and showed a high accuracy hoewer real time data were only accessible to close users through Bluetooth.
More so, Rita and Xiao [22] presented a portable WSN system for real-time environmental monitoring using multiple sensors to enable sensing of multiple environmental factors.
Palani [24] proposed a Time based Priority Sleep Scheduling (TPSS) for providing useful data reliably to mobile cloud users from random WSN. The TPSS is useful as it uses Priority Based Sleep scheduling (PBSS) to reduce battery consumption and Location Based Sleep Scheduling (LBSS) algorithm to provide sensed data based on mobile cloud users location.
Ünsal et al., [23] proposed repeaters for retransmitting environmental data to their base station due to low distance coverage of wireless radio. However, repeaters nodes failure will bring down the entire networks as the sensor nodes were outside the base station communication range. More so, retransmission of data from the sensor nodes will drain out its battery power supply easily. This paper solves this issue by adopting the mesh topology network, hence every nodes in the networks acts as a routers in forwarding data to nearest neighbor until it reaches the base station.
A. Device calibration
The National Institute of Standards and Technology (NIST) maintains and develops standards for measurement to which all others instruments are traced ultimately [18]. Davis Vantage Pro 2 uses standard NIST-traceable sensors and it is an automatic meteorological station using independent energy supply from solar panels and transmit wireless data to an autonomous storage and display module [19] device known as the data logger. It uses frequency hopping spread spectrum and supports high transmission rate of 1000Hz which covers a distance up to 100m. It has a three (3) cup anemometer, air temperature and humidity sensors [15] and can be used as reference for calibrating other devices. Wunderground unlike the Davis Vantage Pro2 weather station, is an open public online weather station that provides weather forecasting service in real time [20]. Their weather data are accessible from their website at wunderground.com.
-
III. The Wireless Sensor Network Design
The WSN developed in this paper includes a Personal Area Coordinator (PAN) comprising of nRF24L01 and Raspberry pi, database, web application and mesh code libraries developed in C++ on a number of distributed wireless sensor nodes.
-
A. The Sensor Node Design
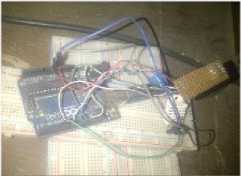
The sensor nodes was design using nRF24L01, sensor and Arduino Uno R3.The nRF24L01 uses serial peripheral interface in communicating with the Arduino Uno R3. A total of nine (9) sensor nodes were designed and used. An Arduino is an open source single-board microcontroller with easy-to use hardware and software components that is widely used due to its flexibility [1]. Arduino Uno R3 uses Atmel Atmega328 microcontroller with a clock speed of 16 MHz. Several sensors can be attached to a single board as it has 14 digital I/O pins and 6 analogue inputs [16]. The nRF24L01 is a 2.4GHz transceiver for low power wireless application with a data rate up to 2Mbps [1] and cover a distance up to 1.5km.The nRF24L01 also has six (6) transmit/receive hardware pipes and can transmit data on one (1) pipe why synchronously listen using the remaining five (5) pipes, this eases the implementation of mesh topology network [17].The sensor nodes designed are as shown in Fig. 1.
(a) Temperature sensor
(b) Piezo sensor
(c) Humidity sensor
(d) Light sensor
Fig.1. Sensor Nodes Hardware Setup
-
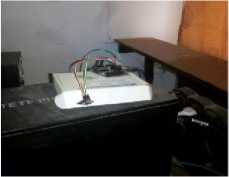
B. The Base Station Design
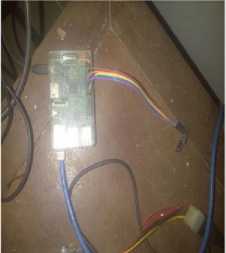
The base station comprises of nRF24L01 and Raspberry Pi Model B as shown in Fig. 2. The Raspberry Pi board uses ARM processor CPU with a clock speed of 700 MHz. It has 512MB RAM, SD Card storage, and 8 GPIO port for expansion and varieties of interfacing peripheral such as HDMI port and USB port [12]. It also supports several operating systems like Raspbian, Debian-based Linux, distro and Raspbian. In this design, Raspbian operating systems was used. The Raspberry pi is connected to the nRF24L01 transceiver which is configured as the Personal Area Network (PAN) coordinator and provide DHCP services to the sensor nodes.
More so, an Apache HTTP web server was built on the Raspberry pi to run the web server application for Graphical User Display (GUI). The client side web interface was implemented using PHP, CSS, Ajax, JQuery, Flot and HTML. The styling of the web page was done using CSS and HTML, while the interactive user interface and dynamic display was done using JavaScript. The visualization of sensor data in dynamic real-time graphical displays was done using Flot. PHP, Ajax and jQuery fed the GUI with real time continuous data from the MySQL database without page refreshing. More so, the nRF24L01 data rate s set to 1Mbps which enables compatibility of the nRF24L01 with other radios like nRF2401A, nRF24E1, nRF2402, nRF24E2.
(a) nRF24L01 and Ethernet cable connected to Raspberry Pi.
Fig.2. Base Station Hardware Setup
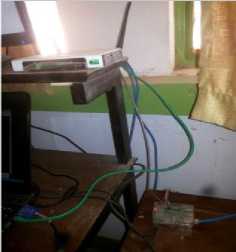
(b) Raspberry pi connected to ABU Network Router.
The base station node is connected to Ahmadu Bello University (ABU) Electrical and Computer engineering router with a static public Internet Protocol (IP) address to enable remote monitoring within and outside the school premises. More so, mesh code modules, auto detection and configuration modules developed in C++ on the base station node. Fig. 3 shows the detail block diagram of the developed system while Fig. 4 shows the developed system flow chart.
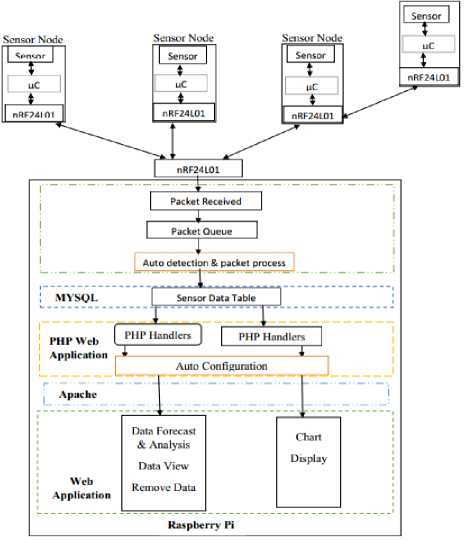
Fig.3. Detailed Block Diagram of the Developed System
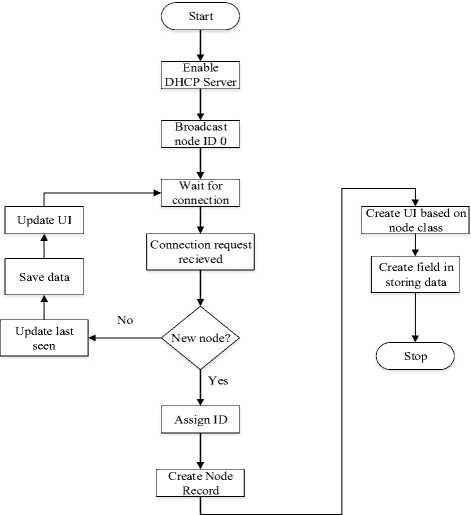
Fig.4. Flow Chart of Auto Detection and Configuration
Since nodes in a mesh network can change their physical or logical position in the network and reconnect through different routing nodes, the base station node which is the network PAN coordinator manages individual nodes address assignments in a manner similar to DHCP. The PAN coordinator was assigned an ID of 0 as seen in Fig. 4 and uses an inbuilt nRF24Network DHCP function to assign IP address to other sensor nodes.
Every node converts the nRF24Network address from the PAN coordinator into a node ID and uses a connection checks function ‘checkconnection’ to test the node connectivity in the mesh. If this function fails, the radio is put into standby mode, and will not receive payloads until the address is renew. The PAN coordinator uses a ‘RenewAddress’ function to assign a new address to such node. All the works that takes place in the network is handled by a ‘mesh.update’ function that must be call regularly to keep the network active, otherwise, the network will miss packets.
The nodes uses “getAddress” function to obtain network address from the PAN Coordinator and returned -1 if address is not found or lookup fails. The “releasedAddress” function is use for nodes that will be sleeping and also use prior to node address renewal either due to change in sensor node physical location or a routing node that goes down. The node returns 1 if successfully released or 0 if failed. When a sensor node starts up, it has to synchronize with the base node to establish communication. By default all nodes are always listening, so messages will quickly reach their destination. A node can join the network without any changes to any existing nodes. Thus, forming some sort of Ad-hoc joining network and a layout of a capable and scalable WSN system.
-
IV. Experimental Setup and Result
The experimental setup is carried out in ABU Electrical and Computer Engineering department while the sensor nodes calibration was done in ABU Environmental Laboratory.
-
A. The Developed System Calibration
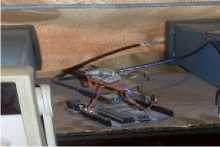
In order to measure the accuracy of the developed system with standard device, the developed temperature sensor node was placed under the same condition with ABU LNG Davis Vantage Pro2 weather station to capture real time temperature data as shown in Fig. 5 (a). These data were monitored and captured on Tuesday 24 th December 2017 from 9:00 am to 12:00 pm at an interval of 10 minutes.
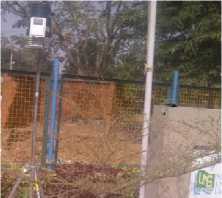
( a) d eveloped system and Referenced Weather station outdoor unit.
Fig.5. Developed System and Reference Weather Station Monitoring
(b) Developed system and Referenced Weather station indoor unit.
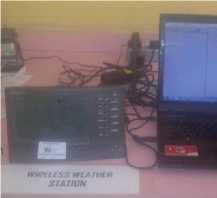
Raw serial data which has not undergone analogue to digital conversion were extracted from Davis Vantage Pro2 using weather link software installed on the PC connected to the base station through a USB cable as shown in Fig.5(b). These data were necessary to determine the accuracy of the developed system as the weather station only display digital value. These data were compared with the captured data from the developed system as shown in Table 1 and the corresponding graph is shown in Fig.6.
Table 1. Comparison of Developed System Data with Weather Station Data
|
(minute) |
Weather Station Raw (°C) |
Weather Station Digital (°C) |
Temp. Sensor Node Raw(°C) |
Temp. Sensor Node Digital (°C) |
|
9:00 |
25.1 |
25 |
25.0 |
25 |
|
9:10 |
25.3 |
25 |
25.3 |
25 |
|
9:20 |
25.6 |
26 |
25.4 |
25 |
|
9:30 |
25.9 |
26 |
25.7 |
26 |
|
9:40 |
26.3 |
26 |
26.2 |
26 |
|
9:50 |
26.5 |
27 |
26.5 |
27 |
|
10:00 |
26.7 |
27 |
26.6 |
27 |
|
10:10 |
26.9 |
27 |
26.8 |
27 |
|
10:20 |
27.0 |
27 |
27.0 |
27 |
|
10:30 |
27.2 |
27 |
27.1 |
27 |
|
10:40 |
27.4 |
27 |
27.3 |
27 |
|
10:50 |
27.6 |
28 |
27.6 |
28 |
|
11:00 |
27.8 |
28 |
27.7 |
28 |
|
11:10 |
27.9 |
28 |
27.8 |
28 |
|
11:20 |
28.1 |
28 |
27.9 |
28 |
|
11:30 |
28.3 |
28 |
28.1 |
28 |
|
11:40 |
28.5 |
29 |
28.3 |
28 |
|
11:50 |
28.7 |
29 |
28.5 |
29 |
|
12:00 |
28.9 |
29 |
28.7 |
29 |
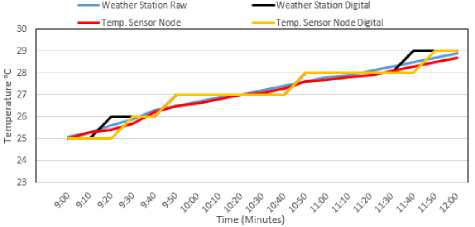
Fig.6. Comparison of Reference and the Developed Sensor Node Temperature Data
From Fig. 6 the digital data readings of the developed system showed a variation from the standard weather station between 9:10 am to 9:30am and also from 11:30 am to 11:50am. The variance in raw data readings was minimal and the difference was due to the elevation of the weather station, protection from direct sunlight, and microclimate.
In order to evaluate the performance of the developed system, the calibrated performance result was compared with the calibrated result of Open Source Hardware Weather Station (OSH-WS) [10] which also used the same Davis vantage pro2 weather station as a referenced calibrator. The comparison is as shown in Table 2.
Table 2. Performance Evaluation
|
System |
ME |
RMSE |
|
OSH-WS |
0.3 |
0.7 |
|
Developed System |
0.12 |
0.14 |
From Table 2, the performance evaluation shows a 60% improvement over OSH-WS. More so, further comparison was carried out with Zaria temperature data obtained from wunderground website, Davis Vantage Pro2 weather station and developed system on 27th January 2018 between 10:00am to 3:00pm. The data from the developed system and Davis Vantage Pro2 weather station is shown in Table 3
Table 3. Weather station and Developed System Data
|
Time |
Weather Staticm(Raw) |
Senior Node(Rmv) |
Weather Station |
Senior Node |
|
10:00 |
24.3 |
24.3 |
24 |
24 |
|
11:00 |
24.6 |
24.5 |
25 |
25 |
|
12:00 |
28.7 |
28.5 |
29 |
29 |
|
13:00 |
29.5 |
29.3 |
30 |
29 |
|
14:00 |
30.6 |
30.4 |
31 |
30 |
|
15:00 |
31.9 |
31.s |
32 |
32 |
While the corresponding Zaria captured temperature data from wunderground website between 10:00 am to
3:00 pm is as shown in Fig. 7
|
Time |
Temp. |
Like |
Point |
Humidity |
Conditions |
Precip. |
Liquid |
Wind |km/h| |
Cloud |
Pressure |
|
10 am |
25 »C |
25 *C |
•4frC |
14% |
$ ties. |
0% |
0 mm |
19ENE |
19% |
IO17hPa |
|
11am |
27°C |
27 °C |
-39C |
13% |
/ 1 CIS! |
0% |
0 mm |
19ENE |
20% |
1017hPa |
|
12 pm |
30 °C |
30 °C |
■3eC |
12% |
Л CIS! |
0% |
0 mm |
18 £№ |
23% |
IO16hPa |
|
1pm |
31 °C |
31 °C |
-2CC |
11% |
1' j Clear |
0% |
0 mm |
16ENE |
24% |
IDlShPa |
|
2 pm |
33 6C |
33 °C |
■2flC |
11% |
$ Clear |
0% |
0 mm |
14ENE |
22% |
IO14hPa |
|
3 pm |
33 eC |
33 °C |
•2°C |
10% |
:*; Clear |
0% |
0 mm |
14ENE |
21% |
IO13hPa |
Fig.7. Captured Data from Wunderground
The chart of the captured data for weather station, Developed system and wunderground is as shown Fig.8
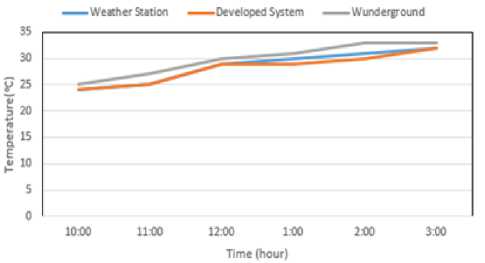
Fig.8. Weather Station, Developed System and Wunderground Temperature Data chart.
From Fig. 8, the temperature data obtained from the weather station and the developed system placed under the same conditions were the same with a little deviation between 12:10pm and 2:50pm. This deviation was due to a tree shadow casted on the developed system outdoor unit between the periods, while the deviation of the temperature data from the wunderground system was due to the location difference.
-
B. The Auto Detection Test Result
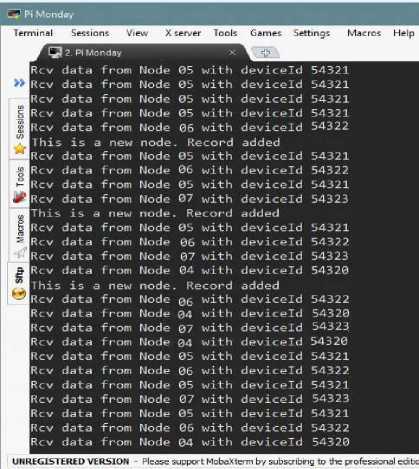
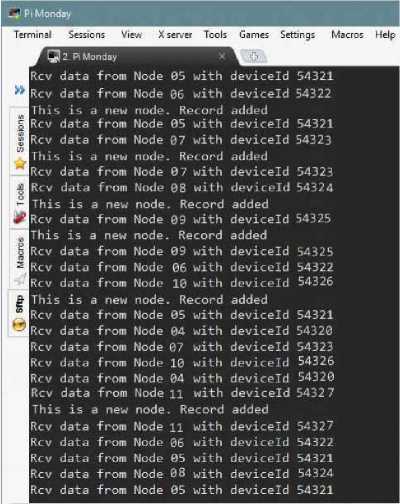
In order to test the base station auto detection and configuration modules, eight wireless sensor nodes were introduced into the network. Four (4) where placed at a distance of 1.4km from the base station. The remaining sensor nodes where placed at a distance of 2.5km which was outside the base station network range and the terminal view is as shown in Fig. 9
(a) Four(4) Auto Detected Wireless Sensor Nodes
(b) Eight (8) auto detected wireless sensor nodes.
Fig.9. Raspberry pi Terminal View of Auto Detected Wireless Sensor Nodes.
Fig. 9 shows Raspberry pi terminal view of auto detected nodes. Where Fig. 9(a) shows four (4) nodes (4, 5, 6, and 7) actively communicating with the base station. It can also be seen that the first time the sensor nodes establishes a connection with the base station, the auto detection modules detects the node and register its device and node ID. Subsequent communication between the node and the PAN coordinator is used in updating the device active time. The device active time is used in estimating the active data time of communication period between the nodes and the base station.
In other to test the mesh code libraries four (4) extra nodes where introduced into the networks at a distance of 2.5km from the base station. Fig. 9(b) shows the full eight sensor nodes (4, 5, 6, 7, 8, 9, 10 and 11) in the network. The mesh code libraries implemented on the PAN Coordinator was responsible for routing node (7, 8, 9, 10 and 11) through the neighboring nodes (4, 5, 6, and 7) using shortest path as metric. It is evidence that the auto detection was able to detect and record new sensor node. It is also observed that the Raspberry pi terminal can be use in monitoring sensor data however, the terminal only displayed data without any access to prior data for analysis and management. Hence, the need for a friendly GUI to ease data monitoring and management.
-
C. The Auto Configuration Test Result
The auto configuration module is responsible for auto detecting sensor nodes on GUI. The GUI fetches its data from the real time data obtained from the developed MYSQL database web server application. The GUI eases users to monitor active devices connected to PAN coordinator in real time as shown Fig.10.
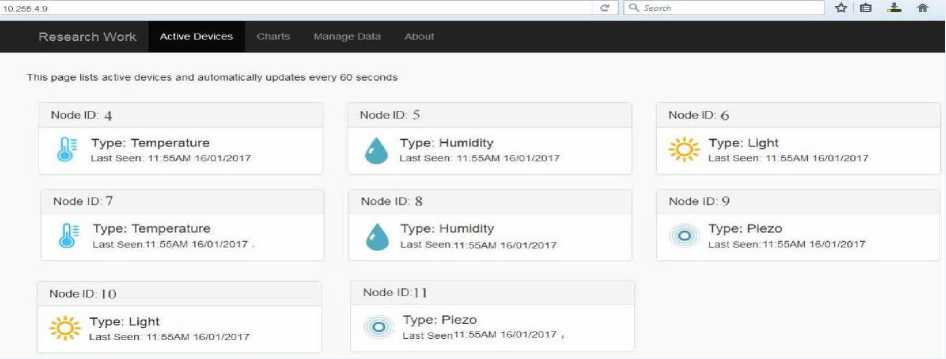
(a) GUI of Eight active nodes (4,5,6,7,8,9,10,11)
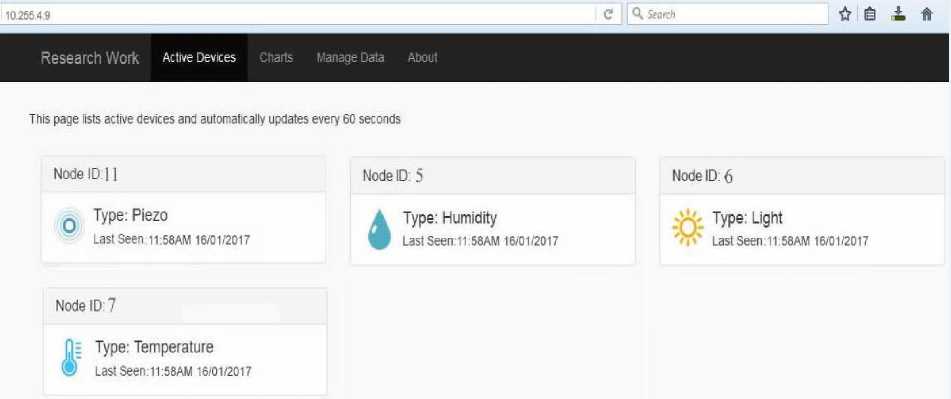
(b) GUI of Four active nodes (11,5,6,7)
Fig.10. Auto Configuration of Active Wireless Sensor Nodes
A 60 seconds time slot is assign to monitor active devices for quick detection of faulty nodes. Once the base station did not receive data from any connected devices and the 60 seconds time slot elapsed, the device is tagged inactive and removed from the UI. This helped the users to easily detect failed sensors nodes which might be due to loss of power, connection problem etc. Fig. 10(a) shows the GUI of eight (8) active auto detected sensor nodes (4, 5, 6, 7, 8, 9, 10, and 11). In other to test the implemented mesh topology network, two nodes (4, 10)
within the base station were removed and after 60 seconds, nodes (8, 9) route to the base station through them were removed automatically as shown in Fig. 10(b).
V Conclusions
In this paper, a real time universal scalable wireless sensor network for environmental monitoring application has been presented. The developed system is implememted on a mesh topology network to ease larger area deployment and more so, was calibrated using standard David Vantage Pro2 weather station and a mean error of 0.12 and root mean error of 0.14 were obtained.The developed system has an auto detection and configuration modules which uses a 60 seconds time slot for detecting active devices. This helps in detecting faulty or failed sensor nodes on the developed user friendly interface.
References Real time universal scalable wireless sensor network for environmental monitoring application
- Jasvir Kaur, Sukhchandan Randhawa, Sushma Jain," A novel Energy Efficient Cluster Head Selection Method for Wireless Sensor Networks", International Journal of Wireless and Microwave Technologies (IJWMT), Vol.8, No.2, pp. 37-51, 2018.DOI: 10.5815/ijwmt.2018.02.04.
- Ramesh, M.V. (2012). Real-time wireless sensor network for landslide detection. Sensor Technologies and Applications,3(1), 405-409.
- Man, K.L.; Hughes, D.; Guan, S.U.; and Wong, P.W. (2016). Middleware Support for Dynamic Sensing Applications. Platform Technology and Service (PlatCon), 2016 International Conference, 1-4.
- Mikhaylov, K.; Petäjäjärvi, J.; Mäkeläinen, M.; Paatelma, A.; and Hänninen, T.(2015). Extensible modular wireless sensor and actuator network and IoT platform with Plug & Play module connection. Proceedings of the 14th International Conference on Information Processing in Sensor Networks, 386-387.
- Kaur, G., & Garg, R.M. (2012). Energy efficient topologies for wireless sensor networks. International Journal of Distributed and Parallel Systems, 3(5), 179.
- Man, K.L.; Hughes, D.; Guan, S.U.; and Wong, P. W. (2016). Middleware Support for Dynamic Sensing Applications. Platform Technology and Service (PlatCon), 2016 International Conference, 1-4.
- Oliveira L.M.; and Rodrigues, J.J. (2011).Wireless Sensor Networks: A Survey on Environmental Monitoring,” Journal of Communication, 6(2), 143-151.
- Ferdoush, S. and Li, X. (2014). Wireless sensor network system design using Raspberry Pi and Arduino for environmental monitoring applications. Procedia Computer Science, 34, 103-110.
- Mohsen Salehi, Jamal Karimian," A Trust-based Security Approach in Hierarchical Wireless Sensor Networks", International Journal of Wireless and Microwave Technologies(IJWMT), Vol.7, No.6, pp. 58-67, 2017.DOI: 10.5815/ijwmt.2017.06.06
- Lee, H.C.; Banerjee, A.; Fang, Y.M.; Lee, B.J.; and King, C.T.(2010). Design of a multifunctional wireless sensor for in-situ monitoring of debris flows. IEEE Transactions on Instrumentation and Measurement, 59(11), 2958-2967.
- Araujo, A.; García-Palacios, J.; Blesa, J.; Tirado, F.; Romero, E.;.Samartín, A.; and Nieto-Taladriz, O.(2012). Wireless measurement system for structural health monitoring with high time-synchronization accuracy,” IEEE Transactions on Instrumentation and Measurement, 61(3), 801-810.
- Idakwo M.A.; Umoh I.J.; and Man-Yahaya S. (2017). Real Time Wireless Sensor Network for Environmental Data Prediction and Monitoring. International Journal of Scientific & Engineering Research, 8(1), 2229-5518.
- Raghavan V.; and Shahnasser, H. (2015). Embedded Wireless Sensor Network for Environment Monitoring. Journal of Advances in Computer Networks, 3(1)
- Ye, D.; Gong, D.; and Wang, W. (2009). Application of wireless sensor networks in environmental monitoring. Electronics and Intelligent Transportation System (PEITS), 2009 2nd International Conference, 1, 205-208.
- Mesas-Carrascosa, F.; Santano, D.V.; Merono, J.; Orden, M.S.; and García-Ferrer, A. (2015). Open source hardware to monitor environmental parameters in precision agriculture. Biosystems Engineering, 137, 73-83.
- Singh R.; and Singh, S. (2015). Development of a Low Cost Wireless Temperature Monitoring System for Industrial & Research Application. International Journal of Current Engineering Technology, 5, 355-361.
- Yao-lin, Z.; Gao-qiang, Z.; Lei, Z., and Jin, X. (2011). Design of wireless multi-point temperature transmission system based on nRF24L01. Business Management and Electronic Information, 3, 780-783.
- Instruments, D. (2014). Wireless Vantage Pro & Vantage Pro Plus Stations. Specification sheet for Wireless Vantage Pro2™ Plus with.
- Esau, I.; Zilitinkevich, S.; Djolov, G.; and Rautenbach, C. (2011). A micro-meteorological experiment in the atmospheric boundary layer in Highveld region. IOP Conference Series: Earth and Environmental Science, 13(1), 01.
- Majid, A.;. Chen, L.; Chen, G.; Mirza, H.T.; and Hussain, I. (2012). GoThere: travel suggestions using geotagged photos. Proceedings of the 21st International Conference on World Wide Web, 577-578.
- Oliveira, L. M., & Rodrigues, J. J. (2011). Wireless sensor networks: a survey on environmental monitoring. Journal of communications, 6(2), 143-151
- Solak, S., & Bolat, E. D. (2013, November). Real time industrial application of single board computer based color detection system. In Electrical and Electronics Engineering (ELECO), 2013 8th International Conference on (pp. 353-357). IEEE
- Ünsal, E., Milli, M., & ÇEBİ, Y. (2016). Low Cost Wireless Sensor Networks for Environment Monitoring. The Online Journal of Science and Technology-April, 6(2)
- Singh, A., & Snigdh, I. (2017). Modelling failure conditions in zigbee based wireless sensor networks. International Journal of Wireless and Microwave Technologies (IJWMT), 2, 25-34.
- Palani, S. (2017). Providing useful data reliably to mobile cloud users from random wireless sensor network. International Journal of Wireless and Microwave Technologies (IJWMT), 1, 49-62.
- Saha, T., Jewel, M. K. H., Mostakim, M. N., Bhuiyan, N. H., Ali, M. S., Rahman, M. K., & Hossain, M. K. (2017). Construction and Development of an Automated Greenhouse System Using Arduino Uno. International Journal of Information Engineering and Electronic Business, 9(3), 1.
