Recurrence Plots of Heart Rate Signals during Meditation

Author: Ateke Goshvarpour, Atefeh Goshvarpour
Journal: International Journal of Image, Graphics and Signal Processing(IJIGSP) @ijigsp
Article in issue: 2 vol.4, 2012.
Free access
The current study analyses the dynamics of the heart rate signals during specific psychological states in order to obtain a detailed understanding of the heart rate patterns during meditation. In the proposed approach, heart rate time series available in Physionet database are used. The dynamics of the signals are then analyzed before and during meditation by examining the attractors in the phase space and recurrence quantification analysis. In general, the results reveal that the heart rate signals transit from a chaotic, highly-complex behavior before meditation to a low dimensional chaotic (and quasi-periodic) motion during meditation. This can be due to decreased nonlinear interaction of variables in meditation states and may be related to increased parasympathetic activity and increase of relaxation state. The results suggest that nonlinear chaotic indices may serve as a quantitative measure for psychophysiological states.
Chaotic behavior, Heart rate, Meditation, Phase space, Recurrence quantification analysis
Short address: https://sciup.org/15012242
IDR: 15012242
Text of the scientific article Recurrence Plots of Heart Rate Signals during Meditation
Meditation, a technique that frees the mind from distractions and allows for communication with the Master Within, can lead to numerous physical, mental and spiritual benefits. Meditation is a unique state of consciousness with associated changes in the physiological and psychological functions in the brain. Physiological research has shown that Meditation characterized by marked reductions in metabolic activity, increased orderliness and integration of brain functioning, decreased peripheral vascular resistance and increased cerebral blood flow. Meditation produces comprehensive improvements in mental health, enhancing positive features, and reducing various forms of psychological distress [1]. Meditation is recommended as non-medicated treatment for some psychological disorders. In addition, unlike medication, meditation has no side effects.
The noninvasive assessment of heart rate (HR) signals can provide valuable information about cardiovascular and control systems involved in their complex regulation. Time series analysis of physiological parameters is usually performed in time and frequency domains by so called linear methods. In these methods, the non periodic oscillations are ignored and usually regarded as a noise [2]. Cardiovascular control system components interact in a complex manner. The nonlinear systems are able to generate complex signals that cannot be distinguished from noise using linear tools. Therefore, there is an effort to apply nonlinear analysis in cardiovascular signals [2,3].
Recurrence is a fundamental property of dynamical systems, which can be exploited to characterize the system’s behavior in phase space. A powerful tool for their visualization and analysis called recurrence plot was introduced by Henri Poincare in the late 1980’s [4]. In 1987, Eckmann et al. [5] introduced the method of recurrence plots (RPs) to visualize the recurrences of dynamical systems. In recent years, RPs found a wide range of applications in the time series analysis of nonstationary and chaotic phenomena. For instance, RPs have been used in the analysis of biological systems including neuronal spike trains [6], electromyographic data [7,8], intracranial electroencephalogram (EEG) recordings [9-13] or other neuronal signals [14], electrocardiograms recording [15], protein folding [16], deoxyribonucleic acid (DNA) sequences [17], nonlinear phenomena in voice production [18,19] measurements based on eye movements [20], postural fluctuations [21] and to monitor disease [22]. The popularity of RPs lies in the fact that their structures are visually appealing, and that they allow for the investigation of high dimensional dynamics by means of a simple two dimensional plot.
The aim of this paper is to apply the recurrence plots to analyze heart rate signals during meditation. Here the nonlinear analysis is used to extract information about the system from the heart rate signals by introducing entropy, an indicator based on the analysis of patterns recurrent in the signal.
The paper is organized as follows: At first, the heart rate signals which are used in this study are described briefly. Then, the recurrence plots and recurrence quantification analysis which are applied in the data set are explained. Finally, the results of the analysis are reported, and the conclusion is stated.
-
II. Background
A. Data selection
This study involves heart rate signals of subjects prior and during meditation from Physionet database [23]. These two types of signals are shown in Figure 1. Subjects were considered to be at an advanced level of meditation training. The Chi meditators [23], were all graduate and post-doctoral students. They were also relative novices in their practice of Chi meditation, most of them having begun their meditation practice about 1– 3 months before this study. The subjects were in good general health and did not follow any specific exercise routines.
The eight Chi meditators, 5 women and 3 men (age range 26–35, mean 29 years), wore a Holter recorder for about 10 hours during which time they went about their ordinary daily activities. At approximately 5 hours into the recording each of them practiced one hour of meditation. Meditation beginning and ending times were delineated with event marks.
During these sessions, the Chi meditators sat quietly, listening to the taped guidance of the Master. The meditators were instructed to breathe spontaneously while visualizing the opening and closing of a perfect lotus in the stomach. The meditation session lasted about one hour. The sampling rate was 360 Hz. Analysis was performed offline and meditation beginning and ending times were delineated with event marks.
B. Recurrence plot
The method of recurrence plots (RP) was firstly introduced to visualize the time dependent behavior of the dynamics of systems, which can be pictured as a trajectory
x ( t ) = x i c^ n ( i = 1, l , N , t = i A t ) (1)
where At is the sampling rate in the n-dimensional phase space [5]. It represents the recurrence of the phase space trajectory to a certain state, which is a fundamental property of deterministic dynamical systems. The main step of this visualization is the calculation of the NxN-matrix
R i , j : =® ( £ -I | x i - x j '| |) i , j = 1 l N (2)
where s is a threshold distance, || . || a norm (e. g. L2 or L∞ norm) and Θ(x) the Heaviside function. The phase space vectors for one-dimensional time series ui from observations can be reconstructed by using the Taken's time delay method [24] x i (“ i , u i + т , , u i + ( m - 1) r ) with dimension m and delay τ, whereby the dimension m can be estimated by using methods based on false nearest neighbors [25]. The binary values in Ri, j can be simply visualized by a matrix plot with the colors black (1) and white (0).
A crucial parameter of an RP is the threshold ε. Therefore, special attention has to be required for its choice. If ε is chosen too small, there may be almost no recurrence points and nothing about the recurrence structure of the underlying system can be understood. On the other hand, if ε is chosen too large, almost every point is a neighbor of every other point, which leads to a lot of artifacts. A too large ε includes also points into the neighborhood which are simple consecutive points on the trajectory [26]. This effect is called tangential motion and causes thicker and longer diagonal structures in the RP as they actually are. Hence, the compromise value of ε must be found. Moreover, the influence of noise can entail choosing a larger threshold, because noise would distort any existing structure in the RP. At a higher threshold, this structure may be preserved.
Several “rules of thumb” for the choice of the threshold ε have been advocated in the literature, e.g., a few per cent of the maximum phase space diameter has been suggested [27]. Furthermore, it should not exceed 10% of the mean or the maximum phase space diameter [28,29].
The recurrence plot exhibits characteristic in large-scale and small-scale patterns which are caused by typical dynamical behavior [5,30], e. g. diagonals (similar local evolution of different parts of the trajectory) or horizontal and vertical black lines (state does not change for some time). Recently introduced extensions to cross recurrence plots use the diagonal structures and their distortions, respectively, for finding similarities and time transfer functions between two different systems [31,32].
Zbilut and Webber have developed the recurrence quantification analysis (RQA) to quantify RP [29]. They defined measures using the recurrence point density and diagonal structures in the recurrence plot, e.g. the recurrence rate (RR) (percent recurrences, density of recurrence points), the determinism (DET) (ratio of recurrence points forming diagonal structures to all recurrence points) and the maximal length of diagonal structures (L max ) (or their averaged length L). A theoretical approach to the RQA including the effect of observational noise was recently published by Thiel et al. [33].
Trulla et al. [34] have applied the RQA in order to find transitions in dynamical systems. They have shown that the RQA measures are able to find transitions between chaoses and order (periodical states). But they could not find chaos-chaos transitions, which are very typical in dynamical systems.
B. Measures of complexity (recurrence quantification analysis, RQA)
The visual interpretation of RPs requires some experience. A quantification of the obtained structures is necessary for a more objective investigation of the considered system. In order to go beyond the visual impression yielded by RPs, several measures of complexity which quantify the small-scale structures in RPs, have been proposed in [16,29,30] and are known as recurrence quantification analysis (RQA). These measures are based on the recurrence point density and the diagonal and vertical line structures of the RP.
The measures are based on the histogram P(ε, l) of diagonal lines of length l.
PE l) =
Nl
^ (1 - R i - 1, j - 1 ( E ))(1 - R + 1, j + 1 ( E )) П R i + k , j + k ( E)
i, j=1
In the following, for the sake of simplicity, the symbol ε is omitted from the RQA measures (i.e. P(l)=P(ε, l)).
Processes with uncorrelated or weakly correlated, stochastic or chaotic behavior cause none or very short diagonals, whereas deterministic processes cause longer diagonals and less single, isolated recurrence points.
The measure entropy refers to the Shannon entropy of the probability p(l) = P(l)/Nl to find a diagonal line of exactly length l in the RP.
E N
P ( l ) ln p ( l ) l = l min
ENTR reflects the complexity of the RP in respect of the diagonal lines, e.g. for uncorrelated noise the value of entropy is rather small, indicating its low complexity. The threshold l min excludes the diagonal lines which are formed by the tangential motion of the phase space trajectory. A diagonal line of length l means that a segment of the trajectory is rather close during l time steps to another segment of the trajectory at a different time; thus these lines are related to the divergence of the trajectory segments.
In this study, recurrence quantification analysis is done using MATLAB Toolbox [35].
-
III. Results
Heart rate signals (before and during meditation) are shown in Figure 1. During meditation signals become more periodic and their chaotic behavior was decreased. According to Figure 1, total HR oscillation amplitude increased significantly during meditation.
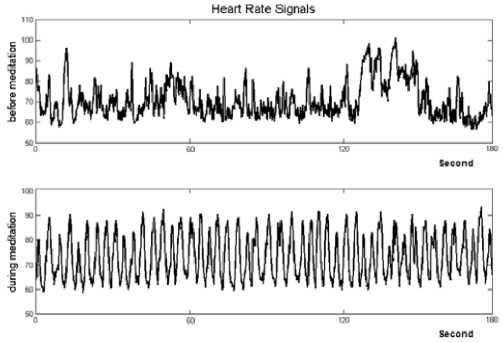
Figure 1. Heart rate time series (three minutes): (top) before meditation (bottom) during meditation.
In this study, parameters described in the previous section were calculated for heart rate data before and during meditation. The recurrence threshold is chosen 0.2 which is considered to be less than 10% of the maximum phase space diameter and the delay is equal to 1.
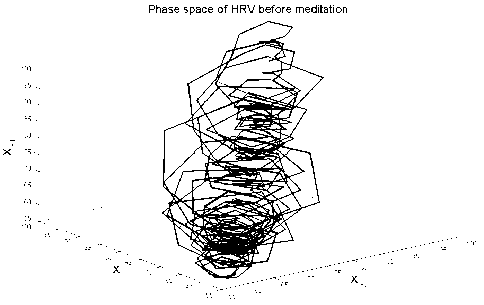
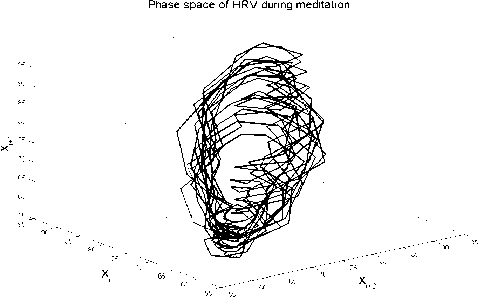
The 3-dimensional phase space trajectory of heart rate signals are shown in Figure 2.
D. Statistical analysis
In this study, the t-test of the null hypothesis that data in the vector x are a random sample from a normal distribution with mean 0 and unknown variance, against the alternative that the mean is not 0 is performed. The result of the test is returned in p-value. P-value→0 indicates a rejection of the null hypothesis at the 5% significance level ( p <0.05). P-value→1 indicates a failure to reject the null hypothesis at the 5% significance level.
(a)
(b)
Figure 2. Three-dimensional phase space trajectory of HR signals (one minute):
-
(a) before meditation (b) during meditation
The spread of the phase space plot is different for various psychological states. The phase space trajectory becomes much more periodic during meditation. In general, the figure shows that the signal trajectories before meditation are highly chaotic, i.e. they have the appearance of randomly scribbled lines with no obvious pattern (Figure 2(a)). In other words, the attractor has a chaotic nature before meditation. However, during meditation, the trajectories are less chaotic, and exhibit a more regular motion (Figure 2(b)). Thus, it can be inferred that the signals have a more periodic type characteristic.
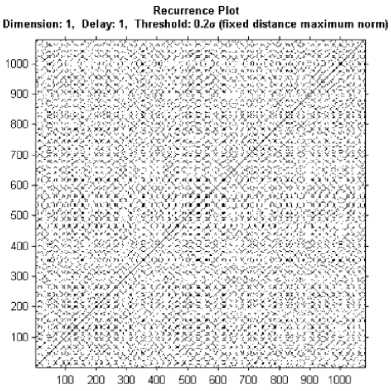
Figures 3 present recurrence plots for two different states: before meditation and during meditation.
Recurrence Plot
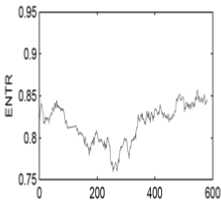
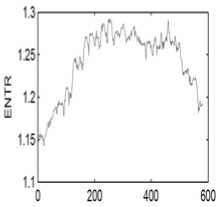
Dimension: 1, Delay: 1, Threshold: 0.2 (a) (b) Figure 3. Recurrence plots for two different states: Diagonals mark similar local evolution of different parts of the trajectory; horizontal and vertical black lines occur when states do not change for some time (laminar states). (a) before meditation (b) during meditation The plots show that different states influence the structure in the recurrence plots drastically. The RP from before meditation heart rate time series shows big black rectangles. However, during meditation, there are small rectangular patches which rather look like the RP of the more periodic motion. In addition, single, isolated recurrence points can occur if states are rare, if they persist only for a very short time, or fluctuate strongly (Figure 3(a)). Following the method described in the previous section, the entropy values of all signals in the database are computed. As the threshold should not exceed 10% of the mean or the maximum phase space diameter, it is selected to be 0.2. The delay is one and the length of window for calculating this measure is 500. Figure 4 shows the entropy of heart rate signals in two states: before meditation and during meditation. This index showed significant changes. The average value of the entropy is about 0.82 before meditation and it is about 1.22 during meditation. The increment of this value (p<0.05) indicates that signals become less chaotic, and their dimensionality decrease during meditation. (a) (b) Figure 4. Entropy of heart rate signals (p =1.2x10⁻⁹): (a) before meditation (b) during meditation IV.Discussion This study focused on method based on recurrence quantification analysis, capable of identifying entropy as a measure of complexity. Heart rate signals of eight subjects during specific psychophysiological state were analyzed. Having first obtained a basic understanding of the heart rate characteristics by performing time series analyses such as phase space, the detailed dynamic properties of the signals have been analyzed using the recurrence plot and the entropy property. It has shown that total HR oscillation amplitude increased significantly during meditation (Figure 1). The phase space trajectory analysis (Figure 2) indicates that the signal trajectories are highly chaotic before meditation. However, during meditation, the trajectories are less chaotic, and exhibit a more periodic characteristic. It has shown that the recurrence plot contains relevant information about the dynamics of the system under consideration. The RP from before meditation heart rate time series shows big black rectangles. However, during meditation, there are small rectangular patches which rather look like the RP of the more periodic motion. In addition, single, isolated recurrence points indicate that states are rare; they persist only for a very short time, or fluctuate strongly. In other words, abrupt changes in the dynamics as well as extreme events cause white areas or bands in the RP (Figure 3(a)). RP allows finding and assessing extreme and rare events easily by using the frequency of their recurrences. It has shown that (Figure 4) the average entropy values are increased during meditation (p<0.05), which indicates that signals become less chaotic during meditation. It is assumed that these differences illustrate a different role of autonomic regulation during meditation. In previous studies, applying the RPs, it was inferred that the dimensionality and entropy of the heart rate variations decrease during a significant cardiac event like myocardial infarction or ventricular tachycardia [15,22]. V. Conclusion Overall, the present results reveal that the heart rate signal changes from a complex, chaotic behavior before meditation, to a low-dimensional chaotic state and quasi-periodic during meditation itself. This can be due to decreased nonlinear interaction of variables in meditation states and may be related to increased parasympathetic activity and increase of relaxation state. This result on heart rate was similar to that in our previous meditation study [3]. The results show that nonlinear analysis of time series have a potential to find the exact and hidden changes of signals which can't found in linear methods. In conclusion, this study has demonstrated that the recurrence quantification analysis based complexity measures could play an important role in analyzing the heart rate signals during meditation and also provides us with a sensitive tool for the study of complex systems.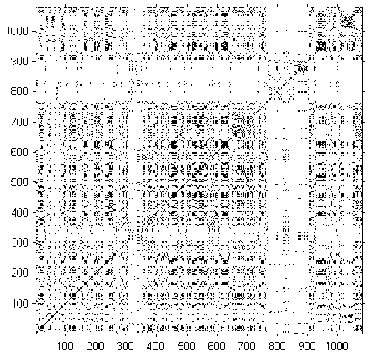
References Recurrence Plots of Heart Rate Signals during Meditation
- Rubia K. (2009). The neurobiology of meditation and its clinical effectiveness in psychiatric disorders. Biological Psychology, 82, 1-11.
- Henry A., Lovell N. (1999). Nonlinear dynamics time series analysis, in: M. Akay (Eds.), Nonlinear biomedical signal processing - dynamic analysis and modeling. John Wiley & Sons-IEEE Press. Hanover, New Hampshire, 1-39.
- Goshvarpour A., Goshvarpour A., Rahati S. (2011). Analysis of lagged Poincare plots in heart rate signals during meditation. Digital Signal Processing, 21, 208-214.
- Poincaré H. (1890). Sur la probleme des trois corps et les équations de la dynamique. Acta Mathematica, 13, 1–271.
- Eckmann J.-P., Kamphorst S.O., Ruelle D. (1987). Recurrence plots of dynamical systems. Europhys. Lett, 5, 973–977.
- Kaluzny P., Tarnecki R. (1993). Recurrence plots of neuronal spike trains. Biol. Cybernet, 68, 527-534.
- Del Santo F., Gelli F., Schmied A., Vedel J.-P., Rossi A., Mazzocchio R. (2006). Motor unit synchronous firing as revealed by determinism of surface myoelectric signal. J. Neurosci. Methods, 155, 116-121.
- Webber Jr. C.L., Schmidt M.A., Walsh J.M. (1995). Influence of isometric loading on biceps EMG dynamics as assessed by linear and nonlinear tools. J. Appl. Physiol, 78, 814–822.
- Acharya U.R., Faustand O., Kannathal N., Chua T.L., Laxminarayan S. (2005). Nonlinear analysis of EEG signals at various sleep stages. Comput. Meth. Programs Biomed, 80, 37–45.
- Babloyantz A. (1991). Evidence for slow brain waves: a dynamical approach. Electroencephalogr. Clin. Neurophysiol, 78, 402–405.
- Groth A. (2005). Visualization of coupling in time series by order recurrence plots. Phys. Rev. E, 72, 046220.
- Marwan N., Meinke A. (2004). Extended recurrence plot analysis and its application to ERP data, Int. J. Bifur. Chaos Cogn. Complex Brain Dynam, 14, 761–771.
- Thomasson N., Hoeppner T.J., Webber Jr. C.L., Zbilut J.P. (2001). Recurrence quantification in epileptic EEGs. Phys. Lett. A, 279, 94-101.
- Faure P., Korn H. (2001). Is there chaos in the brain? I. Concepts of nonlinear dynamics and methods of investigation. C.R. Acad. Sci. III—Sci. de la Vie, 324, 773–793.
- Marwan N., Wessel N., Meyerfeldt U., Schirdewan A., Kurths J. (2002a). Recurrence plot based measures of complexity and its application to heart rate variability data. Phys. Rev. E, 66, 026702.
- Zbilut J.P., Mitchell J.C., Giuliani A., Colosimo A., Marwan N., Webber C.L. (2004). Singular hydrophobicity patterns and net charge: A mesoscopic principle for protein aggregation/folding. Physica A, 343, 348-358.
- Wu Z-B. (2004). Recurrence plot analysis of DNA sequences. Phys. Lett. A, 332, 250-255.
- Facchini A., Kantz H., Tiezzi E. (2005). Recurrence plot analysis of nonstationary data: the understanding of curved patterns. Phys. Rev. E, 72, 021915.
- Matassini L., Kantz H., Hoyst J., Hegger R. (2002). Optimizing of recurrence plots for noise reduction. Phys. Rev. E, 65, 021102.
- Shelhamer M. (1997). On the correlation dimension of optokinetic nystagmus eye movements: computational parameters, filtering, nonstationarity, and surrogate data. Biol. Cybern, 76, 237–250.
- Riley M.A., Balasubramaniam R., Turvey M.T. (1999). Recurrence quantification analysis of postural fluctuations. Gait Post, 9, 65–78.
- Naschitz J.E., Rosner I., Rozenbaum M., Fields M., Isseroff H., Babich J.P., Zuckerman E., Elias N., Yeshurun D., Naschitz S., Sabo E. (2004). Patterns of cardiovascular reactivity in disease diagnosis. QJM: Int. J. Med, 97, 141–151.
- Peng K., Liu Y., Khalsa G., Douglas P.S., Benson C.H., Goldberger A.L. (1999). Exaggerated heart rate oscillations during two meditation techniques. Int. J. Cardiol, 70, 101–107.
- Takens F. (1981). Detecting Strange Attractors in Turbulence, volume 898 of Lecture Notes in Mathematics. Springer, Berlin, 366-381.
- Kantz H., Schreiber T. (1997). Nonlinear Time Series Analysis. University Press, Cambridge.
- Marwan N., Romano M.C., Tiel M., Kurths J. (2007). Recurrence plots for the analysis of complex systems. Physics Reports, 438, 237-329.
- Mindlin G.M., Gilmore R. (1992). Topological analysis and synthesis of chaotic time series. Physica D, 58, 229–242.
- Koebbe M., Mayer-Kress G. (1992). Use of recurrence plots in the analysis of time-series data, in: M. Casdagli, S. Eubank (Eds.). Proceedings of SFI Studies in the Science of Complexity, vol. XXI, Redwood City, Addison-Wesley, Reading, MA, 361–378.
- Zbilut J.P., Webber Jr. C.L. (1992). Embeddings and delays as derived from quantification of recurrence plots. Phys. Lett. A, 171, 199–203.
- Webber Jr. C.L., Zbilut J.P. (1994). Dynamical assessment of physiological systems and states using recurrence plot strategies. J. Appl. Phys, 76, 965-973.
- Marwan N., Kurths J. (2002). Nonlinear analysis of bivariate data with cross recurrence plots. Phys. Lett. A, 302, 299-307.
- Marwan N., Thiel M., Nowaczyk N.R. (2002b). Cross Recurrence Plot Based Synchronization of Time Series. Nonl. Proc. Geophys, 9, 325-331.
- Thiel M., Romano M.C., Kurths J., Meucci R., Allaria E., Arecchi F.T. (2002). Influence of observational noise on the recurrence quantification analysis. Physica D, 171, 138-152.
- Trulla L.L., Giuliani A., Zbilut J.P., Webber Jr. C.L. (1996). Recurrence quantification analysis of the logistic equation with transients. Phys. Lett. A, 223, 255-260.
- Marwan N. (2009) Cross Recurrence Plot Toolbox for MATLAB. 5.15, Release 28, Nonlinear Dynamics Group, University of Potsdam.
