Reference Threshold Calculation for Biometric Authentication

Author: Jyoti Malik, Dhiraj Girdhar, Ratna Dahiya, G. Sainarayanan
Journal: International Journal of Image, Graphics and Signal Processing(IJIGSP) @ijigsp
Article in issue: 2 vol.6, 2014.
Free access
In biometric systems, reference threshold is defined as a value that can decide the authenticity of a person. Authenticity means whether the person is genuine or intruder. The statistical calculation of various values like reference threshold, FAR (False Acceptance Rate), FRR (False Rejection Rate) are required for real-time automated biometric authentication system because the measurement of biometric features are statistical values. In this paper, the need of reference threshold, how reference threshold value is calculated is explained mathematically. Various factors on which reference threshold value depends are discussed. It is also explained that how selection of correct value of reference threshold plays an important role in authentication system. Experimental results describe the selection of reference threshold value for palmprint biometric system.
Reference threshold, authentication, false acceptance rate, false rejection rate
Short address: https://sciup.org/15013217
IDR: 15013217
Text of the scientific article Reference Threshold Calculation for Biometric Authentication
Nowadays, biometrics has been associated synonymously with reliability and security [1][2][3][10][16][17]. Biometrics is replacing other factors of authentication (password and token) in security, privacy protection, e-commerce and personal authentication to name few [19][20][22][24]. In biometric authentication system reference threshold, FAR, FRR goes hand in hand. All the factors affect each other and have to be optimized for real time authentication system [4][5][7][8][18]. In simple words, reference threshold can be defined as a value that can decide whether a person is genuine or intruder by using biometric authentication as shown in Fig.1. Figure 2 clearly illustrates how reference threshold comparison helps in deciding the person authenticity. Matching of two feature vectors from biometric authentication system is shown in Fig. 2. Two feature vectors are matched using feature matching or similarity measurement method and the matching score generated is compared with reference threshold value [6][9]. It is basically the value of reference threshold that authenticates the person as genuine or imposter.
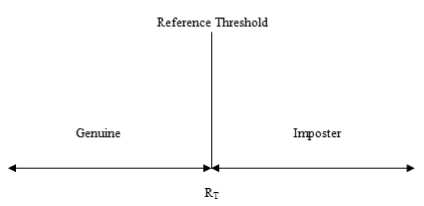
Figure 1. Criteria of authentication
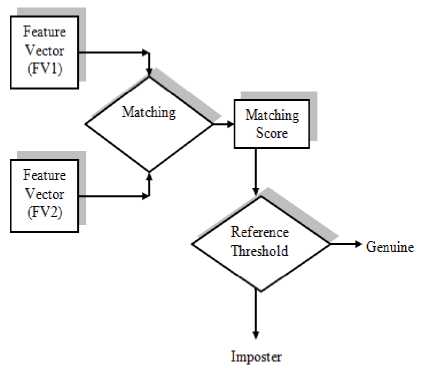
Figure 2. Matching of two feature vectors
FAR can be defined as the rate at which a nonauthorized person is authorized as genuine. The FRR is defined as the rate of a genuine person getting rejected. The selection of reference threshold value depends on various factors like number of hands used for training and quality of image captured.
The security aspect of biometric is associated with the ability to prevent false acceptance [11][12][21][23][25]. False acceptance happens if FAR of the system is very high and the system is prone to attack or lags technical deficiencies. FRR is also equally important in authentication system. FRR is a statistical value that depends on the number of users and the biometric system. There can be various reasons for false rejection; rejections due to poor quality of image or non-proper placement of biometric by user. It actually means that in hurry user has not placed the biometric properly that can lead to false rejection. The false acceptance and false rejection in a system also depends upon the reference threshold value. If reference threshold value is raised, FAR decreases and FRR increases and vice versa. Therefore, aim is to have as small FAR for small values of FRR.
There are several factors that affect FAR and FRR which can in turn affect the reference threshold of the system [13][14][15][26][27]. Depending upon the application, the authentication system can be tuned for desired value of FAR and FRR, that helps in further tuning of reference threshold value. The various factors that affect the value of FAR and FRR are tabulated below in I:
TABLE I. FACTORS AFFECTING FAR AND FRR AND ITS OPTIMIZATION POSSIBILITY
|
Factors |
Optimization Possibility |
|
|
Effect on FAR |
Effect on FRR |
|
|
1. Type of biometric feature or biometric characteristics |
Uniqueness of biometric |
Permanence and measurability |
|
2.Quality of sensors |
Best quality picture reduces FRR |
|
|
3.User behavior |
Reduces FAR |
Reduces FRR |
|
4.No.of biometric references |
Limiting no. of biometric references reduces FAR |
Limiting no. of biometric references increases FRR |
The remainder of the paper is organized as follows. Section II describes about background of reference threshold, FAR and FRR. In section III proposed reference threshold calculations algorithm is explained. Application of the proposed algorithm on palmprint biometric is discussed in section IV and section V concludes the paper.
-
II. BACKGROUND OF REFERENCE THRESHOLD, FAR AND FRR
-
A. Reference Threshold
Accuracy plays an important role in authentication system and it depends on the value of reference threshold chosen. As it is described earlier, reference threshold can be defined as a value which decides whether the person is genuine or imposter as shown in Fig.1.
The feature vectors mentioned in Fig. 2 are basically palmprint biometric features stored in vector form. The palmprint line features are extracted from the palmprint. Line feature includes principal lines, wrinkles and ridges. All these features are of different thickness, length and direction. It is difficult to analyse these lines in single resolution because of different thickness and length of lines. Wavelet transform is one of the promising tool to analyse the image in different resolutions. Here, Wavelet transform, a multi-resolution analysis method is used for line features extraction. These line features are referred as feature vectors. The two feature vectors used in palmprint matching are: first from enrollment stage or database and second from authentication stage. The matching of
A matching algorithm describes the degree of similarity between two feature vectors. In this paper, Euclidean Distance similarity measurement method is used. Euclidean distance involves computation of square root of the sum of the squares of the differences between two feature vectors given by (1).
m
ED = JX(FVikk - FVj,k )2 (1)
-
V k = 1
FV FV where i,k , j,k are feature vectors with length
‘m’. ‘i’, ‘j’ are the iterators on the feature vector database. Euclidean Distance value “0” signifies both feature vectors are exactly same and a value approaching “0” signifies both feature vectors belongs to same hand.
The matching of two feature vectors and the matching score generated because of the comparison is analyzed on the basis of reference threshold. The feature vectors are basically features stored in vector form and referred as feature vector.
From Fig.2, if the matching score generated should be less than or equal to reference threshold, the user is considered as genuine. It is represented by (2) as
Matching Score < RTH
Matching Score > RTH
So, choosing right value of reference threshold is very important in authentication system. Training of the system is done to find suitable value of reference threshold.
Biometric identification using feature matching is a statistical process. The variations in various conditions between enrolment and acquisition stage like noise, illumination and body changes (temporary or permanent) can never lead to 100% match. In knowledge and token based methods, only 100% match is considered and smallest deviation can lead to non-access. In biometric, there is no clear line between a match and a non-match. Matching depends on the two data sets to be compared and the margin of error set. Type of biometric and the application of biometric decide the percentage of
Genuine
Intruder
probability of matching. As a result, biometric systems are never considered 100% accurate. In real time authentication system, if a person’s hand is compared with the samples present in the database, the authenticity depends on the matching score. Even if the same hands are compared in authentication system, there will not be 100% matching. The matching score (MS) will have some value, shown in Fig.3.
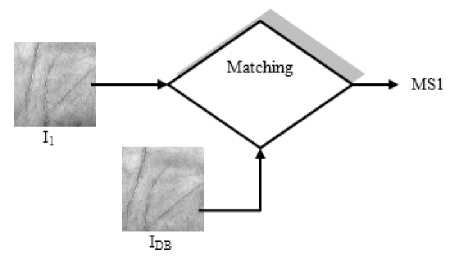
Figure 3. Matching of I 1 with I DB
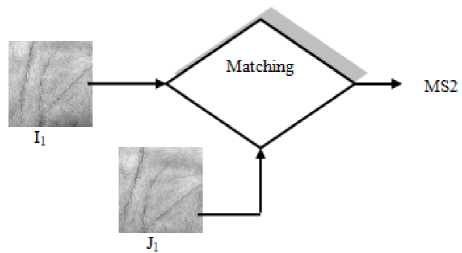
Figure 4. Matching of I1 with J1
Similarly, when two very different hands are compared even then the matching score will have some value as shown in Fig.4.
It’s the decision of correct value of reference threshold value which basically differentiates the same hands from different hands and it can also be concluded from Fig. 3 and Fig. 4. So, it is very important to choose correct value of reference threshold.
Choosing wrong value of reference threshold can lead to two kinds of possible errors: false matches (false acceptance) and false non-matches (false rejection). A false match is said to occur when an acquired template is erroneously matched to a template stored from enrolment, although belonging to two different persons. A false non-match occurs when an acquired template is not matched with the template stored from enrolment, although belonging to the same person. The error rates vary from one biometric to another and also depend on the setting of the threshold.
-
B. False Acceptance Rate
False Acceptance can be explained from Fig.5 as imposter person being authenticated as genuine because the criteria of reference threshold is fulfilled and the imposter person is lying in the range of genuine person as shown by dotted arrow. It is defined in (3)
Wrongly accepted individuals Total number of wrong matching
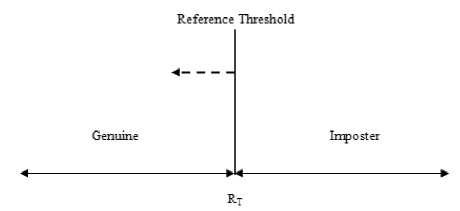
Figure 5. False Acceptance
-
C. False Rejection Rate
Similarly, False Rejection can be explained from the Fig.6 as the genuine person is rejected because the criteria of reference threshold is not fulfilled and the genuine person is lying in the range of imposter person as shown by dotted arrow. It is defined in (4)
Wrongly rejected individuals
Total number of correct matching
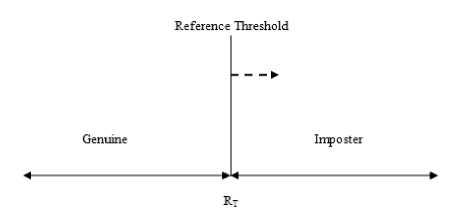
Figure 6. False Rejection
It can be seen in Fig.7 that choosing reference threshold (RT) is very important in an authentication system. If RT’ is chosen as reference threshold, then the person earlier as genuine becomes imposter. It means the person is falsely rejected due to change in reference threshold value.
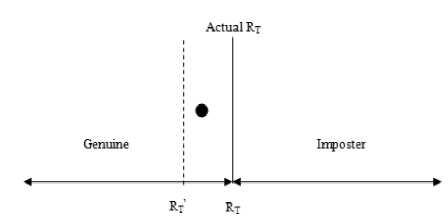
Figure 7. False Rejection by shifting RT
Similarly, in Fig.8, if RT’ is chosen as reference threshold, then the person earlier as imposter becomes genuine. It means the person is falsely accepted due to change in reference threshold value.
Genuine
Actual Rt

Inmost er
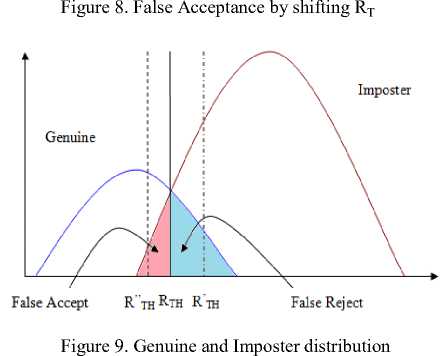
Fig. 9 explains the effect of tuning of RTH on false acceptance and false rejection. It is clear from Fig. 9 that the genuine and imposter distribution can be represented by Gaussian curve. There is overlapping of genuine and imposter distribution which has to be fine tuned to one value of reference threshold R TH . Sliding of R TH value to R’ TH leads to decrease in false rejection but increase in false acceptance. Similarly, Sliding of RTH value to R’’TH leads to decrease in false acceptance but increase in false rejection. So, choosing a correct value of reference threshold is very important, otherwise it can lead to false acceptance or false rejection. The accuracy of the authentication system is given by the following (5):
Accuracy (%) = ( 100 - ( FAR (%) + FRR (%) ) / 2 ) (5)
where, FAR is False Acceptance Rate
FRR is False Rejection Rate
The accuracy of the system increases if the value of FAR, FRR decreases.
-
III. PROPOSED REFERENCE THRESHOLD CALCULATION ALGORITHM
The real time biometric authentication system works in two stages: system training (Pre-authentication) and authentication. In Pre-authentication system, a database of biometric features is prepared. In addition, individual’s threshold values are also identified and stored in database as shown in Fig.10. These values will later be used in authentication system.
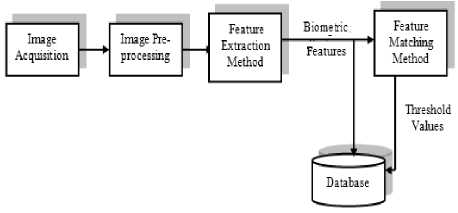
Figure 10. Pre-Authentication system
In Authentication system, the authenticity of a person is identified with the help of reference threshold value stored in pre-authentication system database as shown in Fig.11.
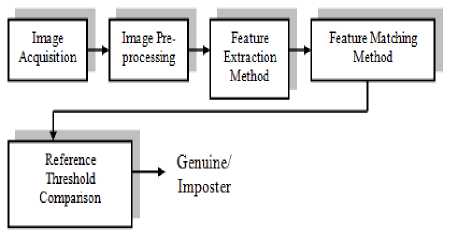
Figure 11. Authentication System
After studying about reference threshold, FAR, FRR, next step is how the reference threshold value is calculated. Here, it is explained in detail with an example of palmprint biometric.
In this paper, the palmprint database is divided into two groups G1 and G2. There are, say M number of images for each individual in a database and there is total N number of individuals in the database. (M-1) palmprint images make a group G1 (System training) for each individual as shown in (6) and one palmprint image will make group G2 (Authentication) for each individual as shown in (7). In general, G1 group
P1 = [/1,1 2,......I (M-1)1 , P2 = [11, I 2,......I (M-1)1
..... PN = [11,12,......I(M-1)1
G 2 group
where, Pi denotes ith person in group G1, G2,
Ij denotes the jth palm image in group G1, G2, M is the number of palm images of one person in the database
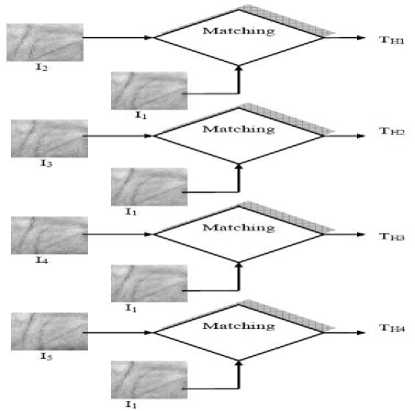
The matching of P1 images can be shown diagrammatically in Fig.12.
feature matching method (FMM). The matching values are stored in threshold array given by (8).
FMM
FMM
FMM i m - i
FMM
FMM
|
TA 1 — |
: • : FMM 2 m - |
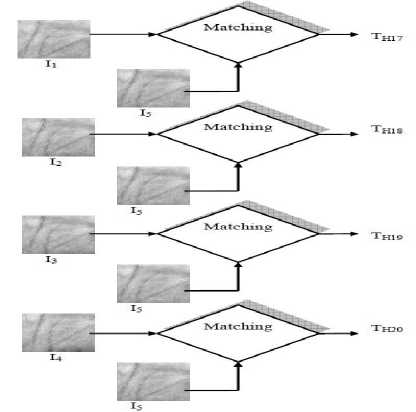
Figure 12. Matching of I1 and I5 with other palm images in P1
In Fig.12, the total number of threshold values among P i is (M-1)(M-2),i.e.(5 x 4=20, for 5 users in group P1). The matching among person P 1 in group G 1 is tabulated in Table II.
TABLE II. MATCHING IN GROUP G1 AMONG PERSON
P1
|
j |
1 |
2 |
3 |
M-1 |
|
|
1 |
X |
FMM 12 |
FMM 13 |
……… |
FMM 1(M- 1) |
|
2 |
FMM 21 |
X |
FMM 23 |
………. |
FMM 2(M- 1) |
|
M-1 |
FMM (M-1)1 |
FMM (M-1)2 |
FMM (M-1)3 |
X |
In group G1, each hand feature vector in P1 is matched with all other (M-1) hands feature vector by
|
FMM ( M - 1 ) 1 FMM ( M - 1 ) 2 |
|
|
_ FMM ( M - 1 )( M - 2 ) . |
(8) |
Similarly, all N hand image samples matching results are stored in Threshold array (T A ) given by (9).
T a — TA + TA 2 +........+ TA n (9)
The minimum and maximum of matching values are found out from the threshold array (TA1, TA2……..TAN) for each individual as shown in (10).
T AMIN = min ( TA )' Tamax = max ( Ta )
The maximum and minimum threshold values from TA are divided into NTH number of threshold values.
A = (TAMAX TAMIN ) / NTH
A1 — TAMIN + A
A2 = Tamn + 2A
Similarly, ANth — Tamin + Nth A
Finally analyzing all NTH values, a reference threshold value for the system is chosen on the following basis:
-
(1) Where FAR and FRR is equal
-
(2) Where FAR is minimum
-
(3) For fixed value of FAR
-
IV. EXPERIMENTAL RESULT AND ANALYSIS
The texture based palmprint system is used to calculate the reference threshold for the system. The palmprint images from PolyU database are obtained for 100 users and 6 palmprint images/person. The palmprint database is divided into two groups, first group (G1) consists of five user palmprint images used for training the system and second group (G2) consists of one user palmprint image used for testing the system. The hand image size is 284×384 pixels. The palmprint image used is 64×64 pixels.
G1 group
P =[11,12,13,14,15 ] • P2 =[11,12,13,14,15 ]
P00 =[11,12,13,14,15 ]
In G1 group each hand Pi contains 5 sample image I1-5 given by (15).
G2 group
P=[16 ], P2 =[16 ] ,..........P100 = [16 ]
In G2 group each hand Pi contains only sample image I6 given by (16). The palmprint features are extracted using Real (Haar) wavelet method and Euclidean distance feature matching has been used to match the features.
In group G1, each hand feature vector in P1 is matched with all other 4 hands feature vector by Hamming distance measurement method. The matching values are stored in threshold array. Similarly, for all 100 hand image samples, 2000 matching values are stored in Threshold array (TA) given by (9).
T a = TA 1 + TA 2 +........+ TA 100
The minimum and maximum of matching values are found out from the threshold arrays (TA1, TA2,……..TAN) for 100 individuals and are stored in the database.
T AiMIN = min ( T A/ ) I
T AiMAX = max ( T A/ ) ) / = 1,^100
The maximum and minimum values are found out from threshold array (TA) to calculate the reference threshold given by (10).
Tamin = min ( T A ) , T AMAX = max ( T A )
The minimum and maximum values of threshold array are divided into 25 threshold values using (11-14).
A = ( T AMAX T AiMIN ) /25
A1 = TAMIN + A A2 = Tamin + 2A
Similarly, A 25 = Tamw + 25 A
These 25 threshold values are tested with group G2 and group G1 images. The value of reference threshold is chosen where FAR is minimum. Table III shows the FAR and FRR Vs the decision/reference threshold. The operating point for palmprint verification system is considered where FAR is minimum.
TABLE III.THRESHOLD VALUES, FAR, FRR AND ACCURACY VALUES FOR REAL WAVELET METHOD
|
Wavelet Type |
Reference Threshold |
FAR |
FRR |
Accuracy |
|
Haar |
0.783 |
8.06E-02 |
8.81E-03 |
95.5 |
|
Haar |
0.790 |
1.00E-01 |
8.42E-03 |
94.6 |
|
Haar |
0.797 |
1.34E-01 |
7.63E-03 |
92.9 |
|
Haar |
0.804 |
1.55E-01 |
6.73E-03 |
91.9 |
|
Haar |
0.811 |
1.77E-01 |
5.74E-03 |
90.9 |
|
Haar |
0.818 |
1.94E-01 |
4.33E-03 |
90.1 |
|
Haar |
0.825 |
1.85E-01 |
3.42E-03 |
90.6 |
From table III, the respective FAR, FRR and reference threshold values are, FAR = 8.06E-02, FRR= 8.81E-03 and the decision threshold value as 0.783.
-
V. CONCLUSION
References Reference Threshold Calculation for Biometric Authentication
- B. Schiener, "Applied Cryptography", John Wiley & Sons, 1996.
- A. K. Jain, A. Ross, and S. Pankanti, "Biometrics: A Tool for Information Security," IEEE Trans on Information Forensics and Security, vol. 1, no. 2, pp. 125-143, 2006.
- A.K. Jain, A. Ross, S. Prabhakar, “An Introduction to biometric recognition”, IEEE Transactions on Circuits and Systems for Video Technology, 14(1):4-20, 2004.
- A. Ross, K. Nandkumar, and A. K. Jain. "Handbook of Multibiometrics", Springer Verlag, 2006.
- J. Daugman, "Probing the uniqueness and randomness of Iris Codes: Results from 200 billion iris pair comparisons," Proc. IEEE, vol. 94, no. 11, pp. 1927-1935, 2006.
- J. Bhatnagar, and A. Kumar, "On Estimating Some Performance Indices for Biometric Identification," Pattern Recognition, vol. 42, no. 5, pp. 1805-1818, 2009.
- Y. Adini, Y. Moses, S. Ullman, “Face recognition: the problem of compensating for changes in illumination direction”, IEEE Transactions on Pattern Analysis and Machine Intelligence, 19(7):721-732, 1997.
- R G. Gallager, "A Simple Derivation of the Coding Theorem and Some Applications," IEEE Trans on Info. Theory, vol. 11, No. 1, 1965, pp. 3-18.
- R. Duda, P. Hart, and D. Stork, "Pattern Classification", Wiley student edition, 1997.
- J. Ortega-Garcia, J. Bigun, D. Reynolds, J. Gonzalez-Rodriguez, “Authentication gets personal with biometrics”, IEEE Signal Processing Magazine, 21(2):50-62, 2004.
- M. Farenzena, L. Bazzani, A. Perina, V. Murino, and M. Cristani. “Person re-identi?cation by symmetry-driven accumulation of local features”, In Computer Vision and Pattern Recognition, pages 2360–2367, 2010.
- D. Gorodnichy and R. Hoshino “Calibrated con?dence scoring for biometric identi?cation”, In Proceedings of NIST International Biometric Performance Conference, 2010.
- S C. Dass, Y. Zhu, and A. K. Jain, "Validating a Biometric Authentication: Sample size requirements," IEEE Transactions on Pattern Analysis and Machine Intelligence, vol. 28, pp. 1902 - 1919, 2006.
- N.K. Ratha, J.H. Connell, R.M. Bolle, “Enhancing security and privacy in biometrics-based authentication systems” IBM Systems Journal, 40(3):614-634, 2001.
- R. Ryan: The importance of biometric standards. Biometric Technology Today, 17(7):7-10, 2009.
- F. Deravi: Biometrics standards. Advances in biometrics, 473-489, 2008.
- J. Bhatnagar, and A. Kumar, "On Some Performance Measures for Biometric Identification," Proc. of IEEE ICB, 2007, pp. 1035 - 1048.
- Y. Zhu, S.C. Dass, and A.K Jain, "Statistical Models for Assessing Individuality of Fingerprints," EEE Trans. on Information Forensics and Security, vol. 2, no. 3, pp. 391-401, 2007.
- J. Bhatnagar, A. Kumar, and N. Saggar, "A Novel Approach to Improve Biometric Recognition Using Rank Level Fusion," Proc. of IEEE CVPR, 2007, pp. 43-51.
- Jain, A. K., Flynn, P. J. & Ross, A. eds., 2007, “Handbook of biometrics”, Springer.
- Jain, A. K., Nandakumar, K., & Nagar, A., 2008, “Biometric Template Security”, EURASIP Journal on Advances in Signal Processing, vol. 2008, Article ID 579416.
- Li, S. Z. & Jain, A. K. eds., 2005, “Handbook of face recognition”, Springer.
- Prabhakar, S. Pankanti, S., & Jain, A. K., 2003, “Biometric recognition: security & privacy concerns”, IEEE Security & Privacy Magazine, 1(2), pp. 33-42.
- Ross, A., Nandakumar, K., & Jain, A.K., 2006, “Handbook of multibiometrics”, Springer.
- J. Bhatnagar, and A. Kumar, "Estimating Minimum Sample Size Requirements for Reliable Identification," Proc. of IEEE CVPR, 2006, pp. 18- 25.
- Rowe, R. K., 2005, “A multispectral sensor for fingerprint spoof detection Sensors”, 22(1), pp. 1-4.
- Wayman, J., Jain, A. K., Maltoni, D., & Maio, D. eds., 2005, “Biometric systems: technology, design and performance evaluation”, Springer.
