Region management in terms of sustainable development

Author: Kirillova Svetlana Aleksandrovna, Kantor Olga Gennadiyevna
Journal: Economic and Social Changes: Facts, Trends, Forecast @volnc-esc-en
Section: Development strategy
Article in issue: 5 (29) т.6, 2013.
Free access
The article considers the approach towards the improvement of the management of regional development, which is based on determining the character and direction of the influence of a number of factors on regional development by applying the method of principal components. The approbation of the suggested approach to the statistical data of Russian regions for 2000-2010 in terms of the region's major subsystems indicated the absence of progressive development tendencies, as well as made it possible to determine the character and the direction of the influence of the investigated factors, which in the regional management practice permit taking the regions to the sustainable development pathway, to be determined.
Sustainable development, safe and balanced development, regional development management, method of principal components, vector of generalized influence, vector of development, factors of regional efficiency
Short address: https://sciup.org/147223516
IDR: 147223516 | UDC: 332.05
Text of the scientific article Region management in terms of sustainable development
The intensification of globalization processes, growth of cross-country and interregional competition, combined with increasing constraints on further development as a consequence of the accumulated economic, environmental and social issues, determine the necessity of transferring Russian regions to the sustainable development pathway.
The main requirement of such transition is to improve the system of territorial management, focused on the achievement of the main development goal – survival of the region, the enhancement of its viability.
Despite apparent simplicity, there are many interpretations of the term “sustainable development”.
Classical understanding of “sustainable development”, was suggested in the 1987 report “Our common future”, where it was defined as “the development that meets the needs of the present without compromising the ability of future generations to meet their own needs” [7, p. 50].
According to A.P. Tyapukhin and A.T. Raimova, “sustainable development” is “socioeconomic and ecological development, aimed at the maintenance of peace on the planet, reasonable satisfaction of human needs with the simultaneous improvement of the living standards of the present and future generations, careful resource management and the preservation of natural environment” [11, p. 21]. T.V. Uskova defines the sustainability of socio-economic system as its ability to function and develop steadily in the long term [12].
In the Macmillan Dictionary of Modern Economics sustainable development is understood as “maximization of net profits from economic development, while preserving natural resources... The latter is understood by the economists – proposers of the theory…, as the use of renewable natural resources with the intensity, not exceeding the regenerative capacity of the resources, and the use of non-renewable resources with optimal efficiency, which implies the substitution of the use of natural resources with the technological progress” [9, p. 481].
According to V.A. Koptyug, the concept of sustainable development “suggests the achievement of the rational equilibrium of social-economic development of humanity and the preservation of the environment, as well as requires a sharp decrease in the economic disparity between advanced and developing countries by means of both technological process and the rationalization of resource use” [6].
It is necessary to highlight the evolution of ideas concerning the category “sustainable development” from the concept interpretation in terms of environmental aspects and the need to ensure the reproduction of limited renewable and non-renewable resources to the consideration of sustainability mainly from the perspective of its socio-economic aspects.
The authors are more familiar with the concept of O.K. Tsapieva that considers balanced, safe and efficient development, providing the achievement of the set goals and priorities of social, environmental and economic issues to be the main imperative of sustainable development [13].
Understanding the essence of sustainable development from the perspective of safe and balanced development of the region’s major subsystems – economy, ecology, social sphere – improvement of the system of regional development is to be carried out taking into account the ratio of output development parameters of the region’s basic subsystems (economic, social and environmental) and some extremely critical values, on the one hand, and the fulfillment of the requirement of development of these subsystems on a parity basis, on the other hand.
The parameters of safe development, defined on the basis of the indicators rather widely used at present [1, 5, 8], suggests that the development of Russian regions for a long time have been carried out beyond its critical limit values (tab. 1) .
With regard to balanced development, it should be noted that at present this kind of record is not sufficiently developed in regional studies, which determines the relevance of the topic development.
While the use of critical limit values of indicators in the practice of regional management allows the fixed estimate of the development of various subsystems as components of the regional systems to be obtained, the assessment of the regions’ state in terms of balanced development provides not only the identification of the equitable development of
Table 1. Correspondence of the indicators of socio-economic development of the Russian Federation with the critical limit values
|
No. |
Name of indicator |
Indicator |
2000 |
2011 |
|
1. |
Volume of capital investments, as a percentage of GDP |
25.0 |
20.25 |
23.81 |
|
2. |
Depreciation of fixed assets, % |
40.0 |
43.5 |
46.3 |
|
3. |
Share of machine-building in the industry, % |
25.0 |
20.5 |
14.0 |
|
4. |
Share of manufacturing sectors in the industry, % |
70.0 |
No data |
65.1 |
|
5. |
Share of unprofitable enterprises, % |
25.0 |
39.8 |
30.0 |
|
6. |
Production profitability, % |
15.0 |
18.9 |
9.6 |
|
7. |
Return on assets, % |
12.0 |
7.6 |
6.5 |
|
8. |
Inflation rate, % |
15.0 |
20.2 |
6.1 |
|
9. |
Monetization rate M2 at the year-end, as a percentage of GDP |
50.0 |
11.98 |
35.86 |
|
10. |
Overall external debt, as a percentage of GDP at the end of the year |
25.0 |
61.67 |
31.20 |
|
11. |
Share of foreign capital investments, % |
25.0 |
26.48 |
55.05 |
|
12. |
Ratio of the volume of foreign trade turnover, as a percentage of GDP |
30.0 |
57.78 |
43.15 |
|
13. |
Share of innovation enterprises, % |
40.0 |
8.8 |
10.4 |
|
14. |
Share of innovation, % GDP |
3.2 |
No data |
6.3 |
|
15. |
Expenditures on research activities, as a percentage of GDP |
3.0 |
0.24 |
0.56 |
|
16. |
Share of public environmental expenditures, as a percentage of GDP |
5.0 |
1.47 |
0.74 |
these subsystems, but also the focus and nature of changes occurring in the region under the influence of various factors.
A region is a complex socio-economic system, the development of which is a multidimensional and multifaceted process of multidirectional character. A priori the category “development” is identified with positive orientation changes. Nevertheless, the development can be positive (progress), negative (regress), stagnant (slack). In fact, the progress in certain areas is often combined with regress or stagnation in others. Jointly these processes form the so-called vector of regional development, reflecting the cumulative result of the current regional trends, the direction and extent of which depend on the results of the development of its subsystems.
As the development and activities of regions are affected by many factors of the internal and external environments, the improvement of the regional management system suggests the identification of factors affecting the processes, the nature and extent of their influence, to be considered as a matter of high priority.
According to the concept of development stages, each stage has its own set of factors, mainly ensuring the development [10, p. 114115]. Thus, territorial systems located at the first stage, develop due to production factors, primarily unskilled labour and natural resources. The territorial development at this stage depends primarily on well-functioning public and private institutions, adequate infrastructure, macroeconomic stability, and healthy and literate workforce.
The income level of population has been increasing in the process of economic development, so the territories move on to the next phase, in which the development is primarily provided by efficiency, more efficient production processes, quality improvement of products (services). At this stage the development is increasingly determined by the quality of human capital – level of secondary and higher education and training, the availability of effective market mechanisms, well-functioning labour market, developed financial markets, the large size of the domestic and foreign markets, as well as the ability to use the existing technologies with the maximum benefit. And finally, the transition of territories to the third stage implies the possibility of its support at the expense of innovation activity, production of new unique products (services) with the use of modern production technologies.
In terms of sustainable development this concept needs to be adjusted considering the following circumstances: firstly, the objectively existing limited resources condition the requirement to use the resources efficiently in order to maximize the ability of systems to exist at all stages of development, and secondly, the need to ensure a balance between economic growth, social justice and environmental security [2, 3].
Traditional approaches of correlationregression analysis and econometric modeling, applying multiple regression methods for establishing interrelation between endogenous and exogenous variables are widely used, when solving the task of identifying the determinants of regional development. However, the use is complicated, on the one hand, by the limited possibility of actually identifying the independent variables, due to the fact that, as a rule, all of the factors characterizing the complex socio-ecological-economic systems, are closely related to each other, and on the other hand, by wider range of issues, resolving which is impossible, if using the above methods. An example of such problems is the task of determining the degree of influence of each considered factor on the whole system, provided that the resulting factor (or factors) is (are) not selected.
In this regard, it seems productive to use the method of principal components (MPC), which allows examining the impact of the analyzed factors on the total dispersion within the framework of the comprehensive analysis of the variability of multifactor structures. The MPC essence consists in the transition from the system description, applying a great number of measured characteristics, to the description with the use of less variables, representing the most informative system attributes. In other words, the application of MPC allows reducing the dimensionality of the original data. Taking into account the complexity of regional systems, it is this MPC feature that allows determining the effect of each factor on the overall changes in the system, providing for the consideration of a significant number of panel data. In compliance with MPC, the linearly independent combination of the most significant factors is the first major component, the combination of factors of secondary importance is the second principal component, etc.
The authors suggest an approach that, as opposed to the classical interpretation of the results of MPC application, allows considering the influence of all identified linear independent combinations of total factors (principal components) in the first place, and of each individual factor in the second place, exerted on the process of the development of a complex dynamic system that is the region.
In case the system state is described by n factors, the number of all principal components is also n, and each i -th principal component is of the form:
a 1 x i + a 2 X 2 +. . + a n x n , i = 1,n . (1)
Thus, the influence of each j -th factor in all of principal components characterizes the values \ a. j j , i = 1,n , j = 1,n . It is necessary to introduce the consideration of some aggregate, in order to record the generalized influence of each j-factor in all prin ci pal components: b j = f ( a1, . ,aj j , j = 1,n .
It is known that each i-th principal component (1) contributes to the total variance of n the system Xi, at that ^Xz = 1. Thereupon, i=1
these values can be also interpreted as the relevant characteristics of the influence, exerted by individual factors.
This interpretation allows calculating the generalized influence of each factor as the weighted average:
bj = X1 a1 + X2 a22 +.. + Xnann , j = Xn . (2)
Thus, it is possible to determine a vector, which is the vector of generalized influence of factors, whereas each component of the vector is the effect of a particular factor.
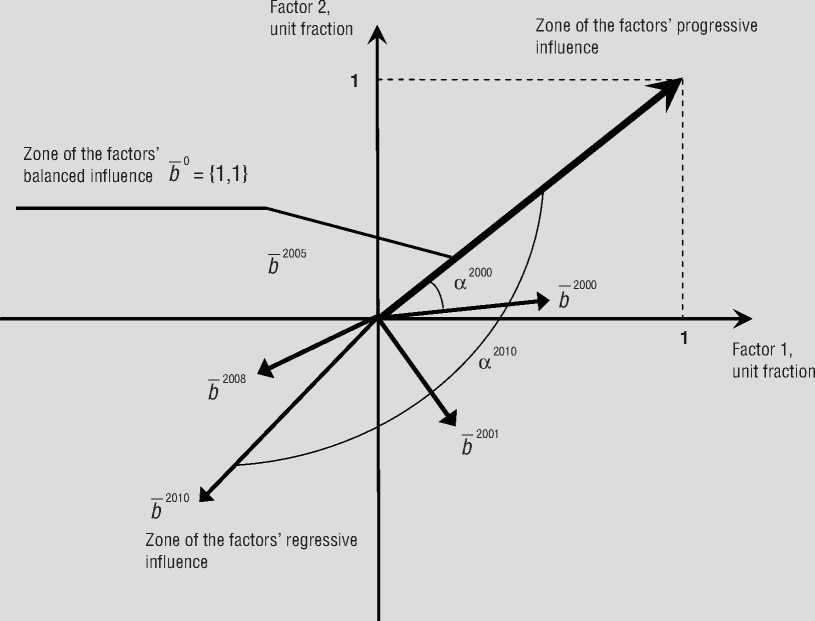
In turn, it is necessary to determine the character of regional development by logic of balanced development, in terms of economic aspects, and its social and environmental characteristics as well. In other words, regional development can be identified with a certain vector, the size and position of which in the spatial coordinate system will make it possible to interpret the character of the region’s development and balance as a whole not only quantitatively, but visually as well. Such vector is suggested to be considered as the generalized vector of the factors’ influence. A hypothetical vector, adopted as standard, the components of which are approximately the same, can be taken as the guideline, relatively to which the region’s development is identified as positive or negative, i.e. characterizes situation, in which all the considered factors exert approximately the same influence on the examined system. In the given study the vector, exerting equal impact on the constituent components was adopted as a reference vector, which will be henceforth called the vector of balanced influence.
In terms of the proposed approach the formalized representation of the character of regional development can be obtained by applying the following criteria:
– module of the generalized vector of the factors’ influence at a fixed point in time (hereinafter Cr 1) as the characteristic of its absolute value (the higher the absolute value of this vector, the greater is, obviously, the factors’ influence on the system);
– angle between the vectors of generalized and balanced influence (hereinafter Cr 2) (the smaller the angle, the more the actual influence of factors corresponds to the standard, i.e. balanced one).
The selection logic of the above mentioned criteria can be illustrated on the example of the dynamics of the hypothetical vector of the generalized influence of two factors (fig. 1) .
The range of possible positive or negative values of the vector of the generalized influence determines the zone of progressive or regressive influence of the analyzed factors, respectively. The situation, presented in figure 1, shows the gradual shift of the generalized influence of the factors ( bt ) from the progressive zone to the regressive zone of influence, accompanied by its strengthening, over the 2000–2010 period. This is proved by the increase in the values of both criteria – the angle between the vectors of the generalized and balanced influence (a2000 < a2010), and the vector of the generali- zed influence of the factors ( b2000
< b
).
With regard to earlier conducted studies [4], it seems reasonable to consider the factors influencing the regions’ development, factors of regional efficiency as the factors, determining the development of Russian regions at the present stage. The system of indicators was constructed mostly in the format of the results – costs grouped by regional subsystems (social sphere, economy, ecology, financing and management). According to the authors, the system of indicators provides the opportunity for the objective characteristics of the produc-tivity of available resources and can be used as the basis for analyzing balanced regional development.
Taking the above statements as the basis for identifying the factors, determining the balance of regional development, the authors formed the system with 33 indicators, including partial indicators, characterizing the efficiency of the use of certain types of resources (labour, investments, fixed assets), the efficiency of
Figure 1. Dynamics of the hypothetical vector of the generalized influence of factors b in 2000–2010
budget spending in the social sectors, the functioning efficiency of these industries, of the environment, the efficiency of the activities of the public control and administration authorities, the indices of living standards and life quality of the population.
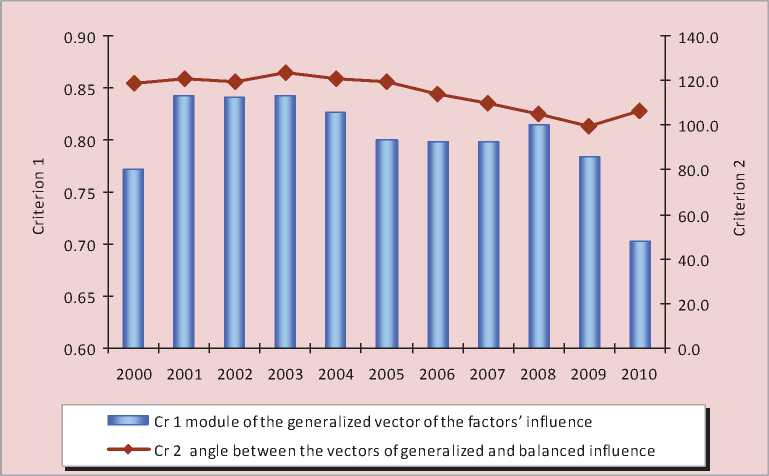
The panel data of regional efficiency for 2000–2010 throughout the regions of the Russian Federation serve as the information base for testing the offered approach. The results of applying the above approach allowed determining the absence of progressive trends in the development of Russian regions, as evidenced by the growth of the development imbalance and decreasing value of the module of the vector of the generalized influence of factors (fig. 2) .
Given that the values b, j = 1, n characte-j, rize the generalized influence of the j-th factor on the system as a whole (that is, on all principal components), it is reasonable to analyze the set of values ^, _, bj |, suggested to be considered as vector one, in order to assess the impact of each factor separately at a fixed point in time t and on the basis of the obtained information to determine the nature and extent of the influence on the regional development process in the time interval [t 1,.. , tk ].
Then the generalized influence of the j-th factor on the system in the dynamics is charac- terized by the vector and:
bj l[ 1 1 , . , t k ]
b ' -,., b ' k )
– the longer the length of the vector, the more significant is the influence of the corresponding factor;
– the more frequent is the ch a nge of the digit in the vector’s components b j ,
1 , . , t k ]
the more unstable is the influence of the j -th factor, determining it;
Figure 2. Dynamics of the balance of the development of Russia’s regions regions in 2000–2010
– the more positive/negative components the vector b j has, the more frequent
[ t 1 , - , t k ]
is the positive/negative contribution of the j -th factor to the principal components, and consequently, its positive/negative influence on the system as a whole.
In this connection, the following criteria have been applied in the study, in order to determine the extent and nature of the influence of the factors of regional development: the vector of the generalized influence of the factor b j , the number of the
[ 1 1 , - , t k ]
turning points of the vector of the factor’s influence (number of change s of the digit in the components of the vector b j ) and [ t 1 , - , t k ]
the share of the positive/negative influence of the factors (percentage o f positive/negative components of the vector b j ).
[ t 1 , - , t k ]
In order to interpret the results of the calculations, the encoding of regional rating is introduced in the study. It represents a visual assessment of the influence of the considered factors, on the examined system.
The assignment of the three-symbol code to each factor was carried out on the basis of the calculated values of the above criteria (tab. 2) .
As the shares of the negative and positive effects of the factors total 1, the value of the second symbol of the rating ‘C” automatically indicates a high proportion of the positive influence of the factor. The third symbol of the rating (“+” and “–”) reflects the sustainable character of the influence of the analyzed factor on the regional system. In accordance with the above logic, the typologisation of regional rating in terms of of the degree of the factor’s negative influence on the balanced development is suggested to be carried out the following way (tab. 3) .
Thus, the diagnostics of the influence of factors on the development of regional systems contributes to unbiased sampling and substantiation of a set of measures aimed at leading the regions to the path of balanced development. Depending on the calculated parameters of the influence, the extent, character and sequence of the developed measures are determined, in compliance with the introduced verbal scale –
Table 2. Encoding of regional rating
|
Code symbol number |
Criterion |
Variation range of the criterion value |
Code symbol value |
Degree and character of the negative influence of the factors on the balance of regional development |
|
1 |
Module of the vector of the factor’s influence |
0.581–0.797 |
A |
High |
|
0.365–0.580 |
B |
Medium |
||
|
0.147–0.364 |
C |
Low |
||
|
2 |
Share of the factor’s negative influence |
0.500–1.000 |
A |
High |
|
0.201–0.499 |
B |
Medium |
||
|
0.000–0.200 |
C |
Low |
||
|
3 |
Number of turning points |
0–4 |
+ |
Stable |
|
5–10 |
– |
Unstable |
Table 3. Matrix of the degree of the influence of the factors on the balanced regional development
The results of the calculations allowed performing the detailed analysis of the influence of the considered factors on the system and assess their significance from the position of ensuring the balanced development and overcoming the negative development trend of Russian regions (tab. 4).
The factors, negatively affecting the subsystem “Economy” include the following: labour productivity, capital productivity and the share of export in GRP with the negative impact share constituting 1.00 (AA+, BA+). This conclusion reflects the current situation of economic degradation in the country, its industrial and technological potential, functioning in the conditions of high degree of capital consumption, with little share of innovation technologies.
The second group of factors, positively affecting the development process include capital productivity, the share of gross fixed capital formation in GRP, the ratio of the volume of innovation products (works, services) to the expenditures on technological innovation (CB-, CB+).
Special attention should be paid to the factors of the management subsystem, that has negatively affected the development of regional systems (AA+) in 2000–2010, while developing measures aimed at the qualitative improvement of the system functioning.
According to the selected scheme, the group, positively affecting the subsystem “Demography” (CC+), includes the factors characterizing the efficiency of the physical reproduction of the population: “the ratio of the number of births to the number of deaths” and “the ratio of natural increase of the population to the amount of the expenditures from the consolidated budget of the RF subject on healthcare and social policy”. At the same time the mechanical reproduction of the population, reflected by the migration gain ratio, characterized by the high share (0.909) and degree (0.427) of negative influence, extremely negatively affects the development of Russian regions.
Table 4. Factors, determining the development of the regions of the Russian Federation in 2000–2010
|
№ p/p |
Indicator |
Evaluation criteria |
Rating |
Verbal assessment of the factor’s influence |
||
|
Module of the influence vector |
Number of turning points |
Share of negative influence |
||||
|
1. |
2 |
3 |
4 |
5 |
6 |
7 |
|
Economic subsystem |
||||||
|
1. |
Labour productivity, thousand rubles/person |
0.576 |
0 |
1.000 |
BA+ |
Negative |
|
2. |
Capital productivity, rubles/rubles |
0.270 |
5 |
0.364 |
CB– |
Positive |
|
3. |
Return on assets, rubles/rubles |
0.665 |
0 |
1.000 |
AA+ |
Negative |
|
4. |
Share of gross fixed capital formation in GRP, % |
0.160 |
3 |
0.364 |
CB+ |
Positive |
|
5. |
Share of export in GRP, % |
0.563 |
0 |
1.000 |
BA+ |
Negative |
|
6. |
Ratio of the volume of innovation products (works, services) to the expenditures on technological innovation, rubles/rubles |
0.181 |
4 |
0.273 |
CB+ |
Positive |
|
Subsystem of finance and management |
||||||
|
7. |
Fiscal capacity, % |
0.185 |
4 |
0.273 |
CB+ |
Positive |
|
8. |
Ratio of GRP to the number of employees of the public control and local administration authorities, billion rubles/person |
0.797 |
0 |
1.000 |
AA+ |
Negative |
|
9. |
Ratio of the GRP to the non-excludable costs of the consolidated budgets, % |
0.695 |
0 |
1.000 |
AA+ |
Negative |
|
Social subsystem |
||||||
|
Demography |
||||||
|
10. |
Ratio of the number of births to the number of deaths, % |
0.316 |
2 |
0.091 |
CC+ |
Positive |
|
11. |
Migration gain ratio |
0.427 |
2 |
0.909 |
BA+ |
Negative |
|
12. |
Ratio of natural increase of the population to the amount of the expenditures from the consolidated budget of the RF subject on health and social policy, people/thousand rubles |
0.205 |
2 |
0.091 |
CC+ |
Positive |
|
Healthcare |
||||||
|
13. |
Number of doctors and nursing staff, persons per 10000 people |
0.167 |
7 |
0.636 |
CA– |
Neutral |
|
14. |
Ratio of the healthy to the number of doctors and nursing staff, people/people |
0.250 |
0 |
0.000 |
CC+ |
Positive |
|
15. |
Ratio of the healthy to the amount of expenditures from the consolidated budget of the RF subject for healthcare, people/thousand rubles |
0.361 |
0 |
0.000 |
CC+ |
Positive |
|
16. |
Ratio of the healthy to the amount of investments in fixed capital by the type of economic activity “Healthcare’’, people/thousand rubles |
0.372 |
0 |
0.000 |
BC+ |
Positive |
|
17. |
Morbidity rate, persons/1000 people |
0.264 |
2 |
0.909 |
CA+ |
Neutral |
|
Education |
||||||
|
18. |
Ratio of graduates of specialized secondary educational establishments to the expenditures from the consolidated budget of the RF subject on general education, people/rubles |
0.244 |
3 |
0.364 |
CB+ |
Positive |
|
19. |
Ratio of graduates of specialized secondary educational establishments to the volume of investments in fixed capital by the type of economic activity “Education’’, people/thousand rubles |
0.298 |
5 |
0.273 |
CB– |
Positive |
|
20. |
Ratio of graduates of specialized secondary educational establishments to the number of population, % |
0.426 |
0 |
1.000 |
BA+ |
Negative |
End of table 4
The implementation of measures contributing to the minimization of environmental damage and reduction in the natural resource intensity of the economy will facilitate the transition of the regions to the path of sustainable development in the sphere of ecology.
Thus, the consideration of the character and degree of the influence of various factors on the balanced development in the practice of regional management will allow increasing the validity of the adopted decisions in terms of the significance of achieving the priorities of not only economic development, but also, of socio-environmental development, which is especially important during the transition to post-industrial stage, while the monitoring of the critical limit indicators of regional development will allow the reliable information about the performance of the accepted decisions to be obtained.
References Region management in terms of sustainable development
- Glazyev S.Yu., Lokosov V.V. Evaluation of critical limit values of the indicators of the state of Russian society and their use in the management of socio-economic development. Herald of the Russian Academy of Sciences. 2012. Vol. 82. No.7. P. 587-614.
- Zyryanov A.I. Lanscape contrast borders and territorial socio-economic systems. Perm, 1995.
- Zyryanov A.I. The region: spatial relations between nature and society. Perm: Perm State University, 2006.
- Kirillova S.A., Kantor A.G. Identification of Russian regions from the point of view of spatial heterogeneity. Region: economy and sociology. 2013. No. 2(78). P. 48-65.
- Tatarkin A.I., Kuklin A.A., Myzin A.L. et al. Comprehensive technique of diagnosing the economic security of the territorial entities of the Russian Federation: preprint. Moscow-Yekaterinburg: RAS Ural Depatment, 1998.
- Koptyug V.A. U.N. Conference on environment and development (Rio de Janeiro, June, 1992). Informational review. Novosibirsk, 1992. P. 19-20.
- Our common future: Report of the World Commission on Environment and Development. Мoscow: Progress, 1989.
- Ryabova T.F., Kolpakova T.V. Criteria and indicators of the economic safety ensuring. Ekonomika, statistika i informatika. 2007. No. 2.
- Macmillan Dictionary of Modern Economics. Мoscow: INFRA-M, 2003.
- Strategic planning and audit of the region's socio-economic development. Мoscow: Economics, 2012.
- Tyapukhin A.P., Raimova A.T. Essence, structure and evolution of the management system of the region's sustainable development. National interests: priorities and safety. 2009. No. 19(52). P. 21-29.
- Uskova T.V. Theory and methodology of managing the sustainable socio-economic development of the region: Doctor of Economics thesis abstract. Specialty 08.00.05 -Economics and management of the national economy (regional economics). Vologda, 2010.
- Tsapieva O. K. Sustainable development of a region: theoretical foundations and the model. Problems of modern Economics. 2010. No. 2(34).
