Regional public debt: trends and formation specifics

Author: Minakir Pavel A., Leonov Sergei N.
Journal: Economic and Social Changes: Facts, Trends, Forecast @volnc-esc-en
Section: Public administration efficiency
Article in issue: 4 (64) т.12, 2019.
Free access
The paper shows that current problems in the Russian economy are largely internal; external factors only multiply them. A significant reason for the emergence of regional public debt in modern Russia lies in the instability of the main types of budget revenues amid growing expenditure obligations. Their growth was significantly dominated by the directives of the federal center, including the first and second editions of the President’s May Decrees, which are, as a rule, only partially supported with transfers from the federal budget or not supported with them at all. At the same time, the structure of regional budgets has been experiencing a continuous increase in the share of mandatory social expenditures and a continuous decrease in the share of capital investments. We show that in these conditions constituent entities of Russia borrow funds to address social issues rather than to stimulate regional investment development. The “residual” principle of financing the social sphere is replaced by the “residual” principle of financing the regional economic sphere of production development and regional infrastructure. It is empirically established that the investment activity of regional authorities involves intensification of debt activity. Having compared the volume and dynamics of debt obligations of Russia’s constituent entities with the provision of expenditures with budget revenues we see that the rapid growth of debt obligations of the authorities of Russia’s constituent entities and the increase in the debt burden on sub-federal budgets pose an actual threat to the stability of territorial budget systems and economic security of regions and the state. We show that territorial convergence of regional public debt in the context of federal districts hides the territorial divergence of regional debt that has increased under the load of obligations to implement the May Decrees and under the lingering and extremely high differentiation of regional budget revenues.
Regional public debt, debt burden, investments, social obligations, budget transfers, drift of economic and social obligations, economic security
Short address: https://sciup.org/147224202
IDR: 147224202 | UDC: 336.27 | DOI: 10.15838/esc.2019.4.64.2
Text of the scientific article Regional public debt: trends and formation specifics
The fundamental change in Russian economic and social trends, which occurred at the turn of the first and second decades of the 21st century, touched almost all components of national socio-economic dynamics. The displacement of positive trends by negative ones is manifested mostly in the decrease in investment activity [1], slowdown in people’s income growth, negative growth of people’s incomes, and changes in the nature of consumer behavior [2], general stagnation, reduction in aggregate demand and the subsequent decline in growth rates until the emergence of negative values in 2015–2016.
Attempts to link the reversal of trends with external economic and political shocks seem unconvincing. The decline in aggregate demand, the decline in investment activity, and the slowdown in income growth began at a time when world oil prices were still high, and not only the Russian but also the world economy started to recover (see, for example, [3]). Moreover, economic stagnation continued after the end of the period of falling oil prices, recovery of the federal budget surplus, resumption of growth of international reserves and overcoming the banking crisis. This indicates the presence of fundamental internal reasons for the changes in socio-economic trends in Russia.
One of the manifestations of the reversal of development trends and stabilization of negative expectations of both investors and households consists in the continuing growth of public debt, which reflects the increasing gap in the revenue potential of the federal budget on the one hand, and expenditure obligations in the social and investment spheres (including military spending, spending on internal security and the maintenance of an expanding administrative and bureaucratic apparatus) on the other hand. For the period from 2011 to 2019, total (external and internal) public debt of the Russian Federation increased from 5.2 to 13.2 trillion rubles, or in 2.5 times in current prices and taking into account the official exchange rate of the ruble. At the same time, internal debt increased from 4.1 to 10 trillion rugles (in 2.4 times), and external debt increased from 35.8 to 51.3 billion US dollars (in 1.4 times)1. The increase in federal internal debt in 2011– 2019 amounted to 5.9 trillion rubles given the total deficit of the federal budget for this period amounting to 3.4 trillion rubles.
Since the mid-2000s, Russia has returned to the practice of the 1990s: it transfers the responsibility for maintaining economic growth to the regional level and finances the growing spending powers that are not backed with adequate revenue items [5]. This led to an increase in the federal public debt and debt obligations at the regional and municipal levels. It is due to the fact that a significant part of responsibility for the implementation of social standards was transfered to regional budgets; besides, the regions were forced to intensify their investment activities.
The state of affairs in regional finance is exacerbated by the fact that since the 1990s there is a lingering problem of scarcity of resources of regional authorities to finance economic and social development in their regions; and this problem has recently manifested itself in the form of proposals for the implementation of the “model budgets” system. Presented as a way to improve the system of intergovernmental transfers, this idea actually provokes the further “divergence” of the regions in terms of their own revenue security and in general in terms of socio-economic development [6].
The present paper considers issues related to regional public debt, which becomes not only one of the challenges of spatial economic equilibrium, but also an important factor in Russia’s acieving its socio-economic development goals, given the more and more prominent shift of the center of gravity of the overall economic and social development of the Russian Federation toward the regional level; in particular, the evidence to this fact can be found in the Strategy for Spatial Development of the Russian Federation until 2025, which was adopted this year2.
Public debt: emergence of the theory and political implications
Naturally, the institution of public debt is present not only in Russia; it is considered an integral form of existence and development of the state fiscal system. The problem of formation and development of this institution is covered in extensive scientific and journalistic literature, which should also be taken into account, given the impact of public debt on all aspects of economic and social life (see for example, [7–11]). At the same time, assessments of the content and practical consequences of the formation of public debt have undergone significant changes in a relatively short period of time. From the initially negative attitude of economic science and society of different countries toward national debt and state loan, over time this attitude drifted more toward the “acceptable standard” in full accordance with the Overton Window – an approach, in which the attitude to any phenomenon, event, or theory is gradually changing from negative to extremely loyal, and is later perceived as the norm3.
Public debts historically arose as a result of non-performance of monetary obligations on the part of the authorities, due to non-payment of salaries, specificed amounts of money to suppliers, etc.; so the very existence of debt was a sign of economic insolvency arising from extreme inability to conduct business affairs or from inappropriate wastefulness. Public debt was perceived as the government’s desire to get “easy” money instead of working to save it.
The economic theory and practice have been critical of the very idea and implications of public debt formation from the very beginning of industrial capitalism until the 1930s.
A. Smith stated: “The progress of the enormous debts which at present oppress, and will in the long-run probably ruin, all the great nations of Europe has been pretty uniform. Nations … have generally begun to borrow upon what may be called personal credit, without assigning or mortgaging any particular fund for the payment of the debt; and when this resource has failed them, they have gone on to borrow upon assignments or mortgages of particular funds” [12, p. 651]. Sharply negative assessment of the national debt in connection with the peculiarities of its repayment and the impact on economic behavior gave and D. Ricardo pointed out that “no sinking fund can be efficient for the purpose of diminishing the debt, if it be not derived from the excess of the public revenue over the public expenditure” [13, p. 206], and the system of borrowing “tends to make us less thrifty – to blind us to our real situation” [13, p. 205].
S.Yu.Witte considered it unacceptable that a state debt be formed in the framework of a functioning economy: “When the state embarks on a path of taking loans, it immediately affects its further solvency and discredits the whole range of its previous debt obligations, for the credibility of payments rests upon a good financial situation in the country” [14]. According to Witte, state loan can be taken only in emergency circumstances as a temporary measure to cover the deficit.
The First World War led to a radical revision of the role of the state in the economy by shifting the vector of public perception of public debt to the point of it being “acceptable”. But the Great Depression of the 1930s made the most significant adjustments to the estimates of government borrowing: the arguments of Bodin, Petty, Stewart, Pinto, and A. Hamilton in the perception of government borrowing became more popular (see [15]); in addition, public opinion on state loans shifted to the second stage of the Overton Window – from “unthinkable” to “radical”.
The theory of J.M. Keynes made the final revolution, if not in the theoretical postulates regarding public debt, then certainly in the minds of a large part of politicians, because it explained the ability of public debt to stimulate economic growth. Keynes advocated the policy of deficit financing, as it helped invest additional funds in the development of new production and stimulate consumption growth. The idea of increasing public debt was made popular thanks to Keynes’ arguments and explanations according to which unproductive spending financed by government loans could enrich society. Some theorists and the vast majority of politicians and financiers reacted positively to those of Keyness ideas that prove that the costs financed by loans and, accordingly the increase in the debt of state and local authorities are beneficial to the expansion of investment and increasing the propensity to consume [16, p. 195].
The new view on the nature of public debt proposed by Keynes became popular and for a long time it served as an excuse and even an incentive for active government borrowing. In the early 1970s, the International Monetary Fund officially recognized the normal 3% (of GDP) level of the deficit, which is directly related to the growth of public debt. After that the existence of public debt was perceived as the “norm” by the public consciousness. By the end of the 1970s, largely as a result of debt policy, problems with inflation and unemployment aggravated in many countries (especially in the United States); such a situation significantly undermined the dominance of the “Keynesian era” and accelerated a transition to neoclassical economic policies. Nevertheless, the position of public debt as one of the most important instruments of public economic policy remained unshakable.
Despite the fact that the end of the 20th and the first decade of the 21st century clearly showed that public debt in the context of globalization of financial markets turned into one of the most powerful drivers of financial and economic crises of national (USA, UK, Mexico, Russia, Greece, Republic of Korea, etc.), global and sub-global scale (1997–1998, 2007–2008), this instrument of economic policy has virtually no alternatives. Probably, this is why decision makers in practical financial and economic policy are reluctant to question the claims about the positive impact of public debt on economic growth, although debt-servicing costs have always been seen by economists as counterproductive and forming a “debt trap” into which all debt-burdened states, as well as most of their regions, are drawn.
In 2018, public debt exceeded 40% of GDP in more than 120 countries and 80% in 38 countries4. At present, Russia’s public debt in accordance with short-term forecasts mostly falls within the intervals of relative security in terms of macroeconomic stability (Tab. 1) , but at the same time there is a tendency toward increasing the debt burden.
As can be seen, public debt in Russia is characterized as stable. This is largely due to the low share of external debt in its total volume. However, in this case we do not mean the entire external debt of the state, but only the part of it that is associated with the borrowing of the state itself (without regional borrowing) and the Central Bank (Tab. 2). No doubt, the total amount of external debt is much larger due to the obligations of the private sector and public commercial structures.
The “chronically positive” balance of payments, even in the context of another economic downturn, which began in 2014 under the influence of external financial and political shocks that were superimposed on the negative investment and consumer trends in the domestic market, led to a gradual decrease in the level of total external debt (denominated in foreign currency). At the same time, federal budget, having the same “chronical deficit” until 2018 caused an increase in domestic debt denominated in rubles; moreover, there was an increase in foreign debt in ruble terms due to the devaluation of the national currency.
In general, Russia’s public debt is steadily increasing; and in recent years, in order to cover budget deficits, there has been a transition in government borrowing from the external to internal market. In general, the increase in the
Table 1. Indicators of public debt stability in Russia, %
Indicator 2016 2018 2019 (estimate) 2021 (forecast) Threshold value Russia’s public debt, % of GDP 12.9 13.6 14.9 16.5 <50 Proportion of internal debt in its total volume 72.0 71.4 73.8 77.1 >50 Proportion of public debt servicing expenses in total federal budget expenditures 3.8 4.7 4.7 5.8 <10 Ratio of the annual amount of payments for the repayment and servicing of public debt to federal budget revenues 9.2 8.0 9.9 10.1 <10 Ratio of annual amount of payments for the repayment and servicing of external public debt to the annual volume of exports of goods and services 1.4 1.4 2.1 0.7 <25 Source: Public debt in the world and in Russia – a problem or a necessity? Available at: gosudarstvennyiy-dolg-v-stranax-mira-i-v-rossii-problema-ili-neobxodimost-20190319-14090/ (accessed: 11.07.2019).
4 Public debt in the world and in Russia – a problem or a necessity? Available at: gosudarstvennyiy-dolg-v-stranax-mira-i-v-rossii-problema-ili-neobxodimost-20190319-14090/ (accessed: 11.07.2019).
Table 2. Size and dynamics of Russia’s public debt
Year Balance of payments, billion USD Federal budget balance, billion RUB External debt, billion USD/billion RUB Internal debt, billion RUB (at the end of the year) Total public debt, billion RUB total Government and Central Bank 2013 33.0 -323 636.4 77.0/2464 4998 7462 2014 15.5 -375 727.1 54.4/2611 5722 8333 2015 67.5 -1962 599.5 50.0/3350 7241 10591 2016 23.7 -2956 518.5 51.2/3328 7307 10635 2017 32.2 -1331 511.7 49.8/3237 8003 11240 2018 112.3 2741 518.9 48.6/3110 9137 12247 2019* 33.7 1885 453.7 50.7/3194 10029** 13223** * Estimate. ** As of July 1, 2019. Sources: calculated with the use of: Internal public debt of the Russian Federation. Available at: public_debt/internal/ (accessed: 6.07.2019); Statistics: Russia’s foreign debt. Available at: / Статистика:Внешний_ долг_России (accessed: 6.07.2019); Public debt of the Russian Federation. Available at: Бюджет/ (accessed: 6.07.2019); External debt of the Russian Federation (analytical presentation). Available at: (accessed: 6.07.2019); The volume of internal public debt of the Russian Federation. Available at: / (accessed – 6.07.2019); https://www. (accessed: 6.07.2019). amount of public debt, of course, is directly dependent on the ratio of the rate of growth of budget revenues to the rate of increase in budget spending. The former is determined by the growth rate of the economy and the “tax liquidity” of the economic structure; the latter depends on the level of social expectations and the degree of nationalization of the economy. Obviously, this is why internal public debt continued growing in 2018–2019, despite the change in the sign of the balance of revenues and expenditures from negative to positive.
Regional public debt
The main part of the regional public debt is formed at the level of Russia’s constituent entities, whose debt accounts for more than 85% of the total consolidated debt of the regions, and is mainly associated with budget deficit, which have become chronic for a significant number of regions. Budget deficits were formed as a result of instability of the main types of budget revenues, the amount of which depends significantly on the general economic dynamics in a particular subject of the Russian Federation. Instability and slowing income growth amid the consequences of the 2009 crisis and the subsequent stagnation of the economy were superimposed on a stable increase in the expenditure part of regional budgets, including those generated by the directives of the federal center to implement the first and second editions of the “May Decrees” of the President. The conflict between the instability of income growth and the monotonous growth of spending has led to the “emissions” of regional public debts in certain periods of time, when spending at the regional level needs to be increased, and the adjustment at the federal level has not been made yet.
Therefore, in general, for the period of 2008–2018, the ratio of federal and regional public debt looks favorable for the latter. On average, the growth rate of regional debt is much lower than the growth rate of federal debt. During this period, the size of federal public debt increased sevenfold, and the value of consolidated regional public debt – 3.7-fold (Tab. 3) . At the same time, if in 2008 consolidated regional debt was 49.2% of the level of federal debt, then by the beginning of 2019 this share was 26.2%.
Table 3. Regional public debt (as of December 1 of the corresponding year, billion rubles)
Indicator 2008 2011 2013 2014 2015 2016 2017 2018 Provision of expenses with own revenues of the consolidated budget of the subject of the Russian Federation, % 87.7 77.4 77.2 75.5 77.4 81.1 84.0 83.8 Russia’s internal public debt 1301 2940 4998 5722 7241 7307 8003 9137 Consolidated regional debt 640 1272 1740 2104 2509 2548 2458 2394 Including: debt of RF subjects 535 1072 1491 1822 2191 2208 2142 2055 municipal debt 105 198 249 282 318 340 343 339 debt burden of the federal budget 14.0 25.9 38.2 39.5 53.0 54.3 53.0 46.9 Debt burden of the budgets of RF subjects 10.3 20.0 33.0 35.4 36.5 33.8 30.5 25.3 Calculated with the use of the following sources: Revenues of the Federal budget of the Russian Federation. Available at: https://www. (accessed: 13.07.2019); Regions of Russia. Socioeconomic indicators, 2018; The volume of public debt of the subjects of the Russian Federation and the debt of municipalities. Available at: (accessed: 25.06.2019); Regions of Russia. Socio-economic indicators – 2008. Available at: (accessed: 14.07.2019). Note. Debt burden is the ratio of public debt to tax and non-tax revenues of the budget in the reporting year, excluding gratuitous receipts.
On average, debt burden at the regional level has decreased over the past decade, while it has grown at the federal level (see Tab. 3, Fig. 1). In general, this is contrary to a widespread thesis about the “exploitation” of RF subjects by the federal center, which transfers social obligations and a significant part of state investment costs to the regions. On the contrary, as evidenced by the comparative dynamics, the growth of regional debt and the debt burden on regional budgets after 2015 began to decline with a corresponding increase in these parameters for the federal debt.
However, the well-being of the average picture hides two substantive problems. First, it is the above-mentioned asynchrony in the time of growth of regional spending on the implementation of federal standards and
Figure 1. Dynamics of public debt in Russia, billion rubles
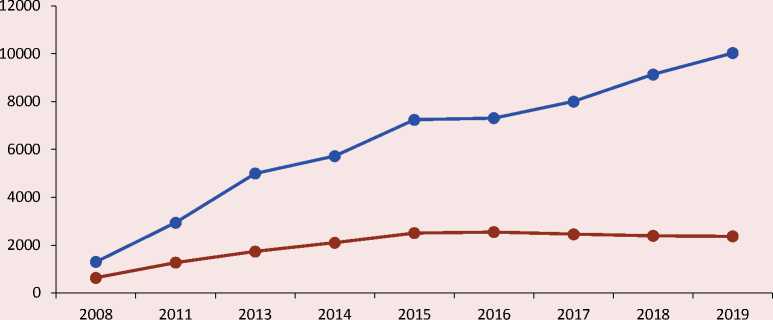
—•— RF debt —•— Regional debt
Built according to the data from Table 3.
regulations on the one hand, and federal compensation for this increase, including due to the increase in the size of federal public debt, on the other hand. This asynchrony generates “debt impulses” in the regions, which form the growth of regional debt.
Second, the degree of differentiation of the size and quality of public debt in the context of regions is extremely high. In general, the level of debt burden (ratio of public debt to tax and non-tax revenues of the budget) remains high, and in some regions the amount of debt is comparable to or even exceeds the amount of own revenues of regional budgets (Tab. 4). In 2010–2018, only one or two subjects of the Russian Federation had no debt obligations5. In 2010, the level of debt burden in the range of 0.01–50% was observed in 58 RF subjects, 50.01–100% – in 22 regions, and it exceeded the limit rate of 100% only in two subjects (the Republic of North Ossetia–Alania and the Republic of Mordovia). In 2015, the situation worsened: the number of regions falling in the range of 0.01–50% decreased more than twice (to 26 subjects) while the number of regions in the range of 50.01–100% (43 subjects of the Russian Federation) almost doubled. The number of RF subjects that violated the budget legislation, i.e. those where the debt burden exceeded 100%, reached fourteen6. At the same time, during the period under review there was an increase in the average debt load for the subjects of the Russian Federation to 36.5% and the maximum regional debt load increased from 125.5% in 2010 to 182.5% in 2015 (in both cases we are talking about the Republic of Mordovia).
An impprtant event took place in 2016– 2018: twelve RF subjects left the critical zone, in which the debt burden exceeds 100%; moreover, average debt burden in RF subjects decreased to 25.3%, which is almost comparable with the level of 2012. At that, debt burden remains 50–100% in nearly half of the regions
Table 4. Grouping of RF subjects according to the level of public debt burden in 2010–2018
Indicator 2010 2011 2012 2013 2014 2015 2016 2017 2018 Number of RF subjects 83 83 83 83 83 85 85 85 85 Percentage of RF subjects with debt burden among them: 0.0 (no debt) 1 1 1 1 2 2 2 2 2 0.01–10.0 13 12 10 7 4 7 7 7 12 10.01–25.0 18 16 14 8 7 5 6 10 7 25.01–50.0 27 31 25 23 15 14 16 19 22 50.01–75.0 17 12 21 21 26 20 21 21 24 75.01–100.0 5 9 10 16 19 23 25 19 16 More than 100.01 2 2 2 7 10 14 8 7 2 Average debt burden, broken down by RF subjects, % 21.8 20.0 26.1 33.0 35.4 36.5 33.8 30.5 25.3 Maximum debt burden, broken down by RF subjects, % 125.5 175.2 179.7 172.1 144.4 182.5 176.0 225.7 236.9 Calculated with the use of: The volume of public debt of the subjects of the Russian Federation and the debt of municipalities. Available at: (accessed: 14.07.2019); Information on the execution of the consolidated budget of the subject of the Russian Federation and the budget of the territorial state extra-budgetary fund. Available at: https://roskazna. ru/ispolnenie-byudzhetov/konsolidirovannye-byudzhety-subektov/ (accessed: 14.07.2019).
5 Yamalo-Nenets Autonomous Okrug had no regional public debt in 2010, Nenets Autonomous Okrug in 2011–2013, Nenets Autonomous Okrug and the Sakhalin Oblast – in 2014, the Sakhalin Oblast and Sevastopol – in 2015–2018.
6 It can be assumed that the actual number of such regions significantly exceeded the fixed number (14), since, according to the budget legislation, the debt burden should not be higher than 50% for highly subsidized regions.
(40 of 85 RF subjects); as for the Republic of Mordovia, it remains a leader according to the dept indicator, and the amount of its debt burden is 236.9% (it is the lowest indicator by the end of 2018) despite the introduction of “direct external control”7.
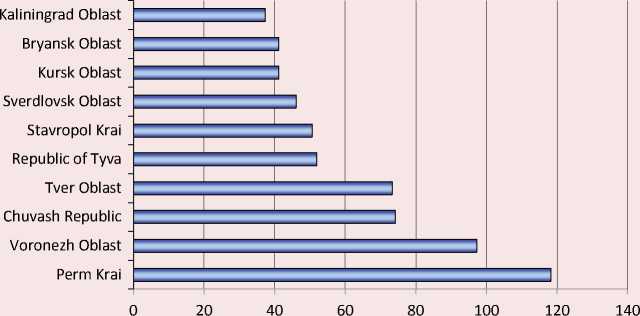
The low level of debt burden, when public debt is less than 10% of the tax and non-tax revenues of the budget, was observed in less than 13 RF subjects during 2010–2018. Although the mere fact of RF subject’s exceeding the threshold budget standard of debt burden at the beginning of the financial year does not indicate the verge of bankruptcy, because it is necessary to take into account the time structure of the debt, specifics of debt payments schedule and the possibilities of the regional budget, but regular borrowing to cover the costs and to finance the budget deficit before the new year makes the process of stabilizing the financial situation more difficult for many regions. For example, in December 2018, the total debt load of RF constituent entities grew by 7.4% due to the fact that the 36 regions have been active in raising new debt funds; moreover, 10 leading regions had the rate of growth of public debt in the range from 40 to 120% (Fig. 2).
A slight decrease in the growth rate of both public and municipal debt in 2016–2018 is due to a number of economic and political reasons.
First, we can assume that in the context of financial instability, regional governments are beginning to save more and consider credit risks more carefully. Second, for the budgets of RF subjects, the year 2018 was the most prosperous in comparison with previous years, which was due to the increase in prices for export resources and the provision of federal financial support in connection with the presidential election. Revenues of consolidated budgets increased relative to 2017 by 15% due to an increase in
Figure 2. Growth rate of public debt in December 2018, %
Source: National Rating Agency (.
profit tax revenues (by 23%) and gratuitous revenues from the federal budget (by 22%)84. The increase in transfers in 2018 was the most significant over the last decade (even in the year of the previous presidential election, it was only 12%). The regions received the maximum transfer supplement in the fourth quarter, which is probably due to a decrease in the ratings of the authorities in the second half of 2018 and the governors’ elections in a number of regions in September. Thanks to the increase in 2018 transfers by 22% and in own revenues by 14%, only 15 RF subjects ended the year with a budget deficit (there were 47 such regions in 2017). The most significant budget deficits were recorded in the Republic of Mordovia (17% of revenues), Khabarovsk Krai (8%), in the Moscow and Sakhalin95 oblasts and in the Jewish Autonomous Oblast (5%).
Despite the overall growth of budget revenues in 2018 by 15%, consolidated regional debt decreased by only 3.9%. Debt burden was reduced in 57 RF subjects and most significantly – in the least problematic regions. There was a significant increase in debt burden in the regions with budget deficits: in the Moscow Oblast (by 32.4%), Khabarovsk Krai (by 19.4%), and in the Republic of Mordovia (by 13%).
At the same time, the share of mandatory social expenditures in the structure of regional budgets is constantly increasing and the share of capital investments is decreasing. The social orientation of regional budget expenditures is a global trend [17; 18], but the overall
-
8 Information on the execution of consolidated budgets of subjects of the Russian Federation as of January 1, 2019. Available at: http://www.minfin.ru/ru/perfomance/regions/ monitoring_results/analysis/
-
9 The budget of the Sakhalin Oblast suffered significant losses of revenues due to the fact that most part of tax revenues from the project “Sakhalin-2” was transferred to the federal budget and was not compensated by the increase in transfers by 17.9 billion rubles in 2018 (over 11% of total revenues of the oblast) (see [2, p. 55]).
minimization of the investment component of budgets is a trend directly opposite to the formation of economic prerequisites for strategic planning practice. In other words, regions borrow not to stimulate investment development, but to address social issues, and they focus not on the development strategy, but on the survival strategy. The “residual” principle of financing the social sphere is replaced by the “residual” principle of financing the regional economic sphere, the development of production and regional infrastructure.
One of the consequences of the formation of debt dependence of regions is the transformation of the concept of “criterion of the effectiveness of debt policy’. Theoretically, the purpose of the regional debt policy is to establish and maintain the mechanism for emergency (debt) financing of socio-economic development; that is, the policy itself should be conservative and aimed at reducing debt obligations. It is provided by the establishment (existence) of an advanced socio-economic economic system in the region, ensuring the sustainability of territorial-budget system in the absence of gratuitous receipts from the federal budget. It means that the creation (development) of such a system is carried out on the basis of financial borrowing. In reality, the debt policy (which is usually conducted as a forced measure) carried out in the regions leads to an increase in debt obligations, an increase in the debt burden on the budget and in the cost of debt servicing and repayment, as it is aimed at fulfilling certain social obligations. As a result, the regions begin to consider such a policy effective.
Structure of the state debt in RF constituent entities
Let us consider the changes in the structure of public debt in the context of components of public debt and in the context of federal districts and subjects of the Russian Federation.
The structure of components of the state debt of RF subjects has not changed significantly for the ten-year period (Tab. 5) . The most significant sources of financing the deficit of regional budgets are direct government borrowings of RF subjects in the form of bonds of domestic government loans and credit resources. However, in different periods there were changes in the ratio of these components, which can be arranged in the following sequence according to the degree of preference and the costs of their servicing: government guarantees, budget loans, securities (bonds), and bank loans.
Responding to the increasing complexity of the macroeconomic situation, in particular the increase in the key rate after 2014, the government increased its participation in the formation of “cheap” debt of regions by increasing the share of budgetary credits (from 19.7% in 2010 to 35–43% in 2016–2019). The share of commercial loans, having passed the peak of 41.6–42.5% in 2015–2016, stopped at 28.8%. The share of securities, which was steadily declining from 2010 (42.4%) to 2016 (18.7%), has grown from 19.4% (2017) to 25% (2019) in the last three years. Other debt instruments, including government guarantees, have become low in demand, and their share has steadily declined from 13.5% (2010) to 3.0% (2019).
The fact that the structure of public debt of constituent entities of the Russian Federation remains quite stable over the last three years, can indicate that in the current macroeconomic situation and the spatial distribution of parameters of financial stability and competitiveness of the subjects of the Russian Federation this structure is the most rational one (and possibly the only rational one), because the ability of regions to raise commercial loans and issue regional securities (bonds) is limited by high cost of these funding sources. Therefore, the program of the Ministry of Finance to substitute bank loans with budgetary loans was a necessary measure to reduce the cost of regional debt, and in essence, to shift regional debt to the federal level, which to some extent explains the fact that the growth rate of federal debt exceeds that of regional debt.
However, the question concerning the possibility of the federal center to adhere to this non-market instrument of borrowing remains open, although for a number of RF subjects the program of providing federal
Table 5. Structure of public debt of RF subjects by types of liabilities, % (at the beginning of the year)
|
Year |
Public debt of RF subjects by types of liabilities |
||||
|
Government securities |
Loans from credit institutions |
Budget loans from other budgets of the budget system of the Russian Federation |
State guarantees |
Other debt obligations |
|
|
2010 |
42.4 |
24.3 |
19.7 |
13.5 |
0.1 |
|
2011 |
37.2 |
21.2 |
31.0 |
10.6 |
0.0 |
|
2012 |
29.3 |
25.6 |
35.8 |
9.3 |
0.1 |
|
2013 |
27.8 |
32.4 |
31.5 |
8.2 |
0.0 |
|
2014 |
25.9 |
39.8 |
27.1 |
7.2 |
0.0 |
|
2015 |
21.2 |
42.5 |
31.0 |
5.3 |
0.0 |
|
2016 |
18.7 |
41.6 |
34.9 |
4.4 |
0.4 |
|
2017 |
19.4 |
34.4 |
42.1 |
3.8 |
0.3 |
|
2018 |
23.7 |
28.8 |
43.6 |
3.5 |
0.4 |
|
2019 |
25.0 |
28.8 |
42.6 |
3.0 |
0.6 |
Source: own calculations according to the Ministry of Finance.
loans to regional budgets remains the only real model for maintaining the stability of their budget systems. For example, budget loans account for up to 100% of the total amount of their debt obligations10 for the Vladimir Oblast, the republics of Ingushetia and Crimea, Altai Krai, the Kaluga Oblast, and part of Primorsky Krai.
Territorial structure of the debt
After 2010, the regions began sharply increasing their budget spending in connection with the requirements of the federal center to fulfill the “May Decrees” of the President. This led to a significant increase in the debt activity of the regions and, accordingly, an increase in the total amount of regional public debt by 2019 by almost 2.5 times (Tab. 6). At the same time, the highest rates of debt growth were observed in those federal districts, which in 2010 were characterized by the lowest share of total regional debt.
Statistically this is reflected in the “alignment” of federal districts in terms of the share in the national debt by 2019. If in 2010 the maximum amount of debt (Central Federal District) exceeded the amount of minimum debt (North Caucasian Federal District) in 35 times, then by 2019, the gap has narrowed to 6.6 times, although the difference between the maximum and minimum values of the aggregate tax and non-tax revenues remained at two-digit value (24.6 times). And even if we exclude budget revenues for the city of Moscow (which does not actually form the public debt) from the amount of revenues for the Central District, the difference will still be 21.7 times.
Naturally, there is even more differentiation in tax and non-tax revenues of the budgets of RF subjects. Even if we exclude from the calculation the cities of Moscow and Saint Petersburg and the Moscow Oblast, whose income significantly exceeds the income of most of the “rich” regions because they use capital rent and its agglomeration effect, then budget revenues of the richest (Khanty-Mansi National Okrug) and the poorest (Altai Republic) of the Russian Federation subjects differ in 65.6 times. This was shown as a striking
Table 6. Public debt of RF subjects in the context of federal districts (at the beginning of the year)
|
Federal district |
Total debt, billion RUB |
Territorial structure of the debt, % |
Growth rate of the debt, fold 2019/2010 |
Tax and non-tax revenues, billion RUB, 2019 |
Debt burden, %, 2019 |
||
|
2010 |
2019 |
2010 |
2019 |
||||
|
Central |
509.7 |
493.6 |
57.2 |
22.4 |
0.97 |
3441.0 |
14.3 |
|
Northwestern |
57 |
213.8 |
6.4 |
9.7 |
3.75 |
1057.0 |
20.2 |
|
Southern |
30.2 |
253.9 |
3.4 |
11.5 |
8.41 |
525.4 |
48.3 |
|
North Caucasian |
14.6 |
74.3 |
1.6 |
3.4 |
5.09 |
139.7 |
53.2 |
|
Volga |
149.6 |
531.6 |
16.8 |
24.1 |
3.55 |
1162.9 |
45.7 |
|
Ural |
27.2 |
140.8 |
3.1 |
6.4 |
5.18 |
1026.2 |
13.8 |
|
Siberian |
70.8 |
292.5 |
7.9 |
13.3 |
4.13 |
749.0 |
39.0 |
|
Far Eastern |
31.7 |
205.9 |
3.6 |
9.3 |
6.50 |
573.6 |
35.9 |
|
Total |
890.8 |
2206.4 |
100 |
100 |
2.48 |
8720.8 |
25.3 |
Calculated with the use of: The volume of public debt of the subjects of the Russian Federation and the debt of municipalities. Available at: (accessed: 14.07.2019); Information on the execution of the consolidated budget of the subject of the Russian Federation and the budget of the territorial state extra-budgetary fund. Available at: https://roskazna. ru/ispolnenie-byudzhetov/konsolidirovannye-byudzhety-subektov/ (accessed: 14.07.2019).
Table 7. TOP 10 RF constituent entities according to “debt criteria” as of January 1, 2019
RF subjects with the maximum amount of debt Amount of public debt, billion RUB Debt burden, % RF subjects with the maximum debt burden of the budget Amount of public debt, billion RUB Debt burden, % Krasnodar Krai 140.2 66.6 Republic of mordovia 56.2 236.9 Moscow Oblast 128.8 28.1 Kostroma Oblast 20.4 115.2 Krasnoyarsk Krai 103.9 52.3 Pskov Oblast 16.3 92.0 Republic of Tatarstan 95.0 40.4 Smolensk Oblast 29.3 90.4 Nizhny Novgorod Oblast 75.1 55.9 Republic of Khakassia 21.8 90.4 Sverdlovsk Oblast 72.8 32.6 Chukotka Autonomous Okrug 10.4 90.3 Republic of Mordovia 56.2 236.9 Jewish Autonomous Oblast 5.2 89.8 Samara Oblast 54.7 37.5 Kurgan Oblast 16.6 88.3 Volgograd Oblast 51.1 72.7 Udmurt Republic 47.0 85.7 Republic of Sakha-Yakutia 50.6 36.4 Republic of Karachay-Cherkessia 5.3 84.7 Total 828.4 45.0 Total 228.5 108.0 Calculated with the use of: The volume of public debt of the subjects of the Russian Federation and the debt of municipalities. Available at: (accessed: 14.07.2019); Information on the execution of the consolidated budget of the subject of the Russian Federation and the budget of the territorial state extra-budgetary fund. Available at: https://roskazna. ru/ispolnenie-byudzhetov/konsolidirovannye-byudzhety-subektov/ (accessed: 14.07.2019). contrast between the concentration of regional debt, on the one hand, and the concentration of debt burden, on the other (Tab. 7).
The main part of regional debt (38%) falls on ten RF subjects, in the budgets of which about 30% of tax and non-tax revenues of all regional budgets are consolidated, except for the budget of the city of Moscow, which allows them to keep the average debt burden at quite an acceptable level (45%). But ten RF constituent entities whose average debt burden is 108%, varying from 85 to 237%, accounted for only 10.5% of the total regional debt, but the total revenues of their budgets account for only 3.3% of tax and non-tax revenues of all regional budgets with the exception of the budget of the city of Moscow.
It is believed [19–21] that an increase in the share of investment spending in the regional budget leads in the long term to an increase in the region’s own revenues and its economic potential. This hypothetically means that debt activities of RF constituent entities are stimulated not only by an increase in spending on social and infrastructure obligations, but also by an increase in investment spending. To check this assumption let us compare official data of the Ministry of Finance of Russia on the largest public debt of RF constituent entities and the data of the National Investment Climate Rating, published annually by the Agency for Strategic Initiatives (hereinafter – the National Rating)11, which reflects the state of the investment climate and the motivation of regional authorities to adopt policies to improve the investment climate in regions.
Let us compare the debt parameters of a group of eight regions that are consistently on the list of top 15 in terms of the integrated assessment of the investment climate, and seven regions with the lowest integrated assessments given by the National Investment Climate Rating (Tab. 8) .
The assumption that the active debt policy pursued by the authorities of RF subjects is closely related to investment policy should be confirmed by the fact that the regions leading in
Table 8. Public debt of RF subjects (at the beginning of the year), billion rubles
Subject 2010 2012 2015 2018 2019 Regions that are constantly on the list of Top 15 regions according to the National Investment Climate Rating Republic of Tatarstan 36.7 80.3 93.2 93.3 95.0 Republic of Chuvashia 8.2 9.0 12.3 14.1 12.9 City of Moscow 243.1 234.1 161.7 34.3 30.0 Tyumen Oblast 0.7 1.4 0.3 1.6 3.6 Kaluga Oblast 11.1 16.3 24.4 30.2 28.7 Tula Oblast 5.5 6.2 15.9 18.7 17.9 Krasnodar Krai 7.0 39.9 136.3 149.1 140.2 Ulyanovsk Oblast 2.1 5.2 17.4 25.1 24.9 Total debt of eight RF subjects 314.4 392.4 461.5 366.4 353.2 Total debt of 83 RF subjects 890.9 1171.8 2089.5 2315.4 2206.3 Debt share of eight RF subjects,% 35.3 33.5 22.1 15.8 16.0 Regions with the lowest integral estimates of the National Investment Climate Rating Republic of North Ossetia-Alania 4.0 6.4 8.6 9.3 9.1 Ryazan Oblast 7.8 15.0 27.1 24.4 22.8 Altai Republic 1.3 1.7 2.0 1.5 1.5 Amur Oblast 3.0 11.6 28.2 27.7 27.4 Zabaikalsky Krai 3.6 5.3 20.0 28.3 27.6 Irkutsk Oblast 9.2 4.5 11.8 18.6 12.3 Republic of Tyva 0.1 0.4 2.0 2.3 2.0 Total debt of seven RF subjects 29.0 44.9 99.7 112.1 102.7 Debt share of seven RF subjects,% 3.3 3.8 4.8 4.8 4.7 Compiled with the use of the following sources: National Regional Investment Climate Ranking. Available at: rating/ (accessed: 14.07.2019); The volume of public debt of the subjects of the Russian Federation and the debt of municipalities. Available at: (accessed: 14.07.2019).
terms of investment climate should have more significant indicators in terms of public debt.
According to Table 8, this assumption is confirmed on the way out of the crisis in 2010. According to the National Rating of Regions, total debt of eight leading regions which were producing 31.1% of GRP of the country, was 314.4 billion rubles, or 35.3% of the regional public debt of Russian regions, and almost 11 times the debt of seven regions with the worst conditions for investment.
However, at the stage of growing social pressures of regional budgets (2012–2015) and the subsequent period of savings, debt policy of regions with the developed investment climate has become more rational, which led to a reduction in the rate of growth of public debt in these groups of regions and to a reduction in the share of the “best” regions in the total value of public debt. By 2019, the share of regions with the best state of the investment climate according to the rating has decreased more than twice – up to 16%.
Consequently, debt policy of regions was closely related to the investment policy they pursued only at the stage of recovery from the crisis of 2008–2010. It was during this period that the investment activity of regional authorities implied the intensification of loan and debt activities with the focus on the growth of regional debt; this can be interpreted as an attempt to financing economic development with the help of borrowing. However, at the stage of growth of social burden of regional budgets (2012–2015) and the subsequent period of savings, the social orientation of regional public debt comes to the fore in the borrowing policy of the regions.
Conclusion
The problem of public debt is more acute for the subjects of the Russian Federation than for the country as a whole; and this is due to both economic and political reasons. In modern Russia there is a discrepancy in the interpretation of the concept of “criterion of the effectiveness of debt policy”. If debt policy leads to an increase in debt obligations and debt burden on the budget and raises the costs of debt servicing and repayment, but at the same time is aimed at fulfilling certain social obligations, then in modern Russian conditions, regional authorities begin to interpret such a policy as effective.
The structure of expenditures of budgets of RF subjects in modern conditions meets interests of the current consumption connected with social development of regions. The predominance of unproductive spending hinders the development of the economic potential of the region and prevents its own tax base from increasing. The “residual” principle of financing the social sphere is replaced by the “residual” principle of financing the regional economic sphere, and development of production and regional infrastructure.
The stability of the structure of public debt in RF constituent entities for the last three years shows that the federal center sees the situation as quite acceptable, but it is hardly possible to interpret it as such from the point of view of ensuring debt sustainability of the regions. The question concerning the possibility of the federal center to support this situation in order to reduce the cost of regional debt obligations, even by artificial means (budget loans), remains open.
Territorial convergence of regional public debt in the context of federal districts hides the regional divergence of the debt load, which has increased under the obligations to fulfill the May Decrees and at the lingering unusually high differentiation of regional budget revenues.
It is shown that the active debt policy pursued by the governments of RF subjects consistently included in the Top 15 of the National Rating of Investment Climate is poorly related to their investment policy. More precisely, at the stage of recovery from the crisis of 2008–2010, the investment activity of regional authorities of RF subjects with the best indicators of investment climate actually assumed that the borrowing and debt activity would be boosted and regional debt would increase, which was interpreted as debt financing of economic development. However, the growing social burden on regional budgets (2012–2015) and the subsequent period of the policy of saving resulted in the fact that “advanced” regions have adopted more discreet and rational debt policy.
References Regional public debt: trends and formation specifics
- Stroev P.V., Vlasyuk L.I. Debt burden of regions and regional policy. Finansy: teoriya i praktika=Finance: Theory and Practice, 2017, vol. 2, no. 5, pp. 90-92. (In Russian).
- Zubarevich N.V. Socio-economic development of regions: results of 2018. Ekonomicheskoe razvitie Rossii=Economic Development of Russia, 2019, vol. 26, no. 3, pp. 52-55. (In Russian).
- Minakir P.A. The Russian crisis: expectations vs facts. Prostranstvennaya ekonomika=Spatial Economics, 2018, no. 1, pp. 7-15. (In Russian). DOI: 10.14530/se.2018.1.007-015
- Shevchenko M.V., Petrosyan A.A. Current state and structure of public debt in Russia. Ekonomicheskie issledovaniya i razrabotki=Economic Research and Development, 2018, no. 1, pp. 7-16. (In Russian).
- Minakir P.A. Regional strategies and imperial ambitions. Prostranstvennaya ekonomika=Spatial Economics, 2015, no. 4, pp. 7-11. (In Russian).
- Afanas'ev R.S., Bogdanov L.N., Gulidov R.V., Leonov S.N. "Model" budgets: consequences for the subjects of the Russian Federation. Prostranstvennaya ekonomika=Spatial Economics, 2019, vol. 15, no. 1, pp. 132-156. (In Russian).
- DOI: 10.14530/se.2019.1.132-156
- Belov A.V. Effektiven li tsentralizm? Optimizatsiya byudzhetnykh otnoshenii v Rossiiskoi Federatsii [Is Centralism Effective? Optimization of Budget Relations in the Russian Federation]. SAARBR CKEN: LAP, LAMBERT Academic Publishing, 2012. 188 p.
- Kudrin A.L., Sokolov I.A. Budget rules as a tool of balanced budget policy. Voprosy ekonomiki=Economic Issues, 2017, no. 11, pp. 5-32. (In Russian).
- Kachanova E.A., Korotina N.Yu. Methodological aspects of assessment of the Russian model of budgetary federalism from positions of asymmetry of economic criteria. Sotsium i vlast'=Society and Power, 2018, no. 5, pp. 71-81. (In Russian).
- Vallikh K. (Ed.). Rossiya i problemy byudzhetno-nalogovogo federalizma [Russia and the Issues of Fiscal Federalism]. Moscow: Izvestiya, 1993. 207 p.
- Albouy D. Evaluating the Efficiency and Equity of Federal Fiscal Equalization. NBER Working Paper 16144. Issued in July 2010, Revised in May 2012. Available at: http://www.nber.org/papers/w16144 (accessed: 6.03.2019).
- Smith A. Issledovanie o prirode i prichinakh bogatstva narodov [An Inquiry Into the Nature and Causes of the Wealth of Nations]. Moscow: Izd-vo sots.-ekon. lit-ry, 1962. 681 p.
- Ricardo D. Sochineniya: v 4-kh t.: nauchnoe izdanie: per. s angl. T. 1.: Nachala politicheskoi ekonomii i nalogovogo oblozheniya [Works: in 4 Volumes. Scientific Edition. Translated from English. Volume 1: On the Principles of Political Economy and Taxation]. Moscow: Gos. izd-vo polit. lit., 1955. 306 p.
- Witte S.Yu. Konspekt lektsii o narodnom i gosudarstvennom khozyaistve, chitannykh ego imperatorskomu vysochestvu velikomu knyazyu Mikhailu Aleksandrovichu v 1900-1902 godakh
- [Summary of lectures on national and state economy, read to his Imperial Highness Grand Duke Mikhail Alexandrovich in 1900-1902]. Fond ekonomicheskoi knigi "Nachala", 1997. Available at: https://www.e-reading.mobi/bookreader.php/100825/ Vitte_-_Konspekt_lekcii_o_narodnom_i_gosudarstvennom_hozyaiistve.html (accessed: 6.03.2019).
- Mart'yanov A.V. Public debt management: retrospective analysis of theoretical aspects of political economy. Sibirskaya finansovaya shkola=Siberian financial school, 2009, no. 1, pp. 59-62. (In Russian).
- Keynes J.M. Obshchaya teoriya zanyatosti, protsenta i deneg [The General Theory of Employment, Interest and Money]. Translated from English. Moscow: Progress, 1978. 497 p.
- Kelleher C.A., Yackee S.W. An empirical assessment of devolution’s policy impact. The Public Studies Journal, 2004, vol.32, pp. 253-270.
- Boadway R., Shah A. (Eds.). Intergovernmental Fiscal Transfers: Principles and Practice. Public Sector. Washington, D.C.: The World Bank, 2007. 624 p.
- Soldatkin S.N. Efficiency of regional debt policy through the prism of investment activity. Regional'naya ekonomika: teoriya i praktika=Regional Economy: Theory and Practice, 2015, no. 30, pp. 46-57. (In Russian).
- Leonov S.N. Assessment of the effectiveness of management tools for socio-economic development of the region. Regionalistika=Regional Studies, 2018, vol. 5, no. 6, pp. 53-69. (In Russian).
- DOI: 10.14530/reg.2018.6.53
- Soboleva G.V., Popova I.N. Promotion of economic development of regions by means of budgetary and tax policy. Vestnik Sankt-Peterburgskogo universiteta. Ser. 5. Ekonomika=Bulletin of St. Petersburg University. Series 5. Economics, 2014, no. 1, pp. 5-26. (In Russian).
