Regional system of economic and social factors in the formation of innovation development resources

Author: Donichev Oleg A., Fraimovich Denis Yu., Grachev Sergei A.
Journal: Economic and Social Changes: Facts, Trends, Forecast @volnc-esc-en
Section: Innovation development
Article in issue: 3 (57) т.11, 2018.
Free access
Accelerated reorientation of the Russian economy on innovation development and the implementation of new industrialization and import substitution tasks are major strategic problems for Russia; finding the solutions to these problems will make it possible to overcome the lag in socio-economic development and eliminate the consequences of the economic crisis and sanctions of Western countries. Therefore, the goal of the study is to identify the key resource indicators that determine the level of use of innovation potential of territorial systems and to build on this basis our own approach in order to analyze and adjust modernization development in regions. Research methods are based on the use of economic and mathematical methods, factor and correlation analysis. We identify factors that have the greatest impact on innovation indicators. We assess the degree of their impact on innovation development. The list of factors we have identified is used to assess the degree of differentiation of regions within the Central Federal District according to the level of resource provision of innovations...
Innovation development, resource provision, region, analysis of factors
Short address: https://sciup.org/147224066
IDR: 147224066 | UDC: 332.1 | DOI: 10.15838/esc.2018.3.57.6
Text of the scientific article Regional system of economic and social factors in the formation of innovation development resources
The necessity to deal with the implications of the global economic crisis and ensure the conditions for neutralizing the impact of the sanctions imposed by Western countries brings to the fore the task of organizing import substitution and, as a consequence, reindustrialization in key sectors.
In this regard, socio-economic policy in Russia and its regions is focusing on improving the efficiency of economic activity and accelerating the rate of its development with the help of innovation, cutting-edge scientific achievements, advanced technology and equipment. Its goal is to boost regional systems that form resource-based conditions of innovation development to ensure effective impact of activities of organizations, promote production and productivity growth, and improve the standard of living and quality of life.
Thus, the formation of the resource potential of the regional system becomes one of the most important aspects for its functioning. Meanwhile, it is necessary to take into account other factors and conditions in the formation of socio-economic and innovation space in the territories.
The goal of the study is to identify key socioeconomic and resource indicators that determine the level of use of innovation potential of territorial systems and to design our own approach for the purposes of analyzing and adjusting modernization development in regions.
The present work has the following objectives:
-
1) to study a methodological scientific base that reveals different directions of resource support of innovation development in regions;
-
2) to substantiate our own methodological approach to the monitoring of indicators and to the selection of key factors in regional resource potential that influence innovation development on a quantitative basis;
-
3) to interpret the results of the analysis and to identify possible directions of their use in the work of regional and federal authorities.
Domestic and foreign practice of resource support of innovation development of regions
The works of Russian and foreign scientists have formed a significant methodological foundation that makes it possible to analyze objectively the level of development of socioeconomic and innovation potential in regions.
It should be noted that the prospects and processes of economic development in Russia and in its regions are considered and analyzed by many Russian scientists.
These include L.S. Blyakhman, S.Yu. Glazyev, R.S. Grinberg, V.V. Ivanov, N.I. Ivanova, D.E. Sorokin, A.G. Fonotov [1–8]. Western researchers, such as M. Armstrong, G. Becker, R. Beatty, J. van Dane, G. Mensch, R. Nelson, M. Porter, J. Silverberg, L. Turrow, R. Forster, R. Holt, J. Schumpeter [9–19] studied the issues of innovation development.
However, it should be emphasized that the above mentioned authors address the problems of formation, development and implementation of innovation on a national and to a lesser extent – regional scale. The issues of providing resources for innovation developments are recognized as an important factor in innovation development, but there are not many individual studies on these problems. In the Russian economic science and in dissertations, these aspects have also received insufficient attention in recent years.
We can provide a number of examples of dissertations on the issues of providing resources for innovation developments: Doc. Sci. dissertations of S.V. Yurin (Moscow, 2010) and O.S. Chechina (Saint Petersburg, 2017); Cand. Sci. dissertations of Yu.V. Markina (Chelyabinsk, 2012), S.S. Kalashnikova (Voronezh, 2013), and P.A. Sukhanova (Perm, 2015) 1 .
Analyzing the publications of Russian and foreign authors on the issues of resource support of innovation activity, we can distinguish some of their features.
For example, we agree with V.V. Kislitsina and colleagues on the fact that the functioning of a regional system should provide for positive dynamics of formation of its social, resource, economic and environmental potentials [20, p. 369]. S.N. Kukushkin emphasizes the importance of analyzing economic performance at different levels of economic systems management in order to identify the scale and structure of innovation development, while at the same time paying attention to the critical issue of their limited use and insufficient amount of resources available for these processes, lack of financial sources, and high economic risk [21, p. 109; 115].
Other authors, in particular, E.A. Yakovleva and colleagues, O.Yu. Patrikeeva and S.V. Kryukov, without refuting the above arguments, point out that when financial and material resources for innovation production are insufficient, then the role of the government rapidly becomes more important through the appropriate tax and depreciation policy, allocation of loans and subsidies, creation of complex funds, and personnel training. And we can not but agree with this. At the same time, it is emphasized that socio-economic development of regions depends largely on the performance of regional authorities. The activities of the authorities to attract and use all types of resources, including investment, in their territory contribute to the expansion of the use of advanced technologies and modern equipment, forming the growth of production, tax revenues and improving the quality of life [22, 23]. We believe that the role of regional authorities should continue to grow from the standpoint of strengthening innovation development of territories.
However, assessing the importance of state support to innovation development, V.V. Belsky points out negative implications of this phenomenon for the regions, as the majority of state-owned enterprises engaged in science and technology are focused on addressing issues of the federal level and are separated from actual needs of the regions and their social and economic environment; that is why local authorities should understand the rationality of location of productive forces [24, p. 170].
In this regard, a group of scientists including O.A. Khokhlova, A.A. Alkhazov, V.A. Stolbov, A.R. Bakhtisin and colleagues emphasize the fact that the region as the owner and manager of local resources is interested in satisfying the needs of the territory; the criteria of these needs are multiplication of regional wealth, improvement of environmental situation, creation of new jobs, promotion of its own competitiveness, development of human capital, achievement of the balance of traditional and innovative prerequisites for economic development. Based on this, it is reasonably concluded that the set of promising opportunities, both being implemented and being developed, for productive use of resources for innovative development of the territory is formed by the resource potential of the region [25–28].
In this regard, A.N. Shvetsov clarifies that the tasks of ensuring innovation development and creating conditions for economic growth also have the territorial dimension, which is very important for Russia. The need for innovative incentives is widespread and enormous, but only a few selected regions can actually use opportunities offered at the federal level. It seems that this situation can have negative consequences, since co-financing on the part of the region is a mandatory requirement for the allocation of federal funds for innovative projects; and regions in most cases do not have financial resources.
It turns out that funds are not allocated to those who need them most, but to those who can co-finance them; this situation enhances interregional and intraregional disparities [29, p. 41].
O.S. Sukharev, sharing these concerns, adds another important problem hampering the development of innovation orientation of the economy; this problem is insufficient orientation of Russia’s financial and banking system toward the needs of the real sector of economy and toward strengthening its capacity to create innovation and commercialization [30, p. 135]. We believe that this is one of the most important obstacles to resource support of innovation progress.
Similar proposals are expressed by E.B. Lenchuk who argues that post-industrial economy is not the one in which there is no production, but the one in which the real sector is dominated by intellectual labor and high technology based on the latest knowledge. At the same time, the transition to a new model of economic growth is associated with addressing the task of “new industrialization”, which involves the revival and further development of the real sector of the economy on the most advanced technological basis [31, p. 22].
Having studied the issues concerning the provision of resources to innovative processes and the increasing role of socio-economic systems in this activity, A.V. Gladysheva and her colleagues have found out that, for example, human resources in conjunction with innovation approaches to management form not only competitive advantages, but also conditions for high competitive positions of the regions themselves [32, p. 35]. And human resource management from the standpoint of knowledge economy or cognitive economy formation, according to E.I. Kudryavtseva, together with cognitive management technologies which formed the methodology of human capital management, opens the possibility of combining the competences of employees in the direction of the core competence of an organization [33, p. 63].
This line of reasoning leads us to recognizing the importance of the works of foreign authors such as economists H. de Groot, J. Poot, and M. Smit who analyze the processes of innovation development of regions and provision of these activities with appropriate resources. These scientists believe that active use of innovation resources ensures sustainability in the formation and development of the regional economic system [34].
E. Zimmermann believes that resources allocated to the improvement of innovative potential are a condition that supports the development of this system, which is of particular importance in the appropriate regulation and management [35].
J. Hauser, G. Tellis, and A. Griffin believe that innovations can change their appearance due to the variety of resources used; they can make appropriate modifications to the products in different markets, while replacing the previously existing ones with fundamentally new product offerings [36].
Moreover, according to V. Zemlickiene, innovation development of regions is composed of and depends greatly on how its enterprises use innovation and resources in their practice and get fundamentally new products on the market at their expense, outstripping their competitors and strengthening the capacity of the region [37].
Innovation technologies emerging in the course of ongoing research are a source of production modernization for economic sectors. But they can not always bring the desired result. In this regard, according to T. Bresnahan and M. Trajtenberg, great opportunities are provided by the so-called general purpose technologies. If they participate in the processes of regular upgrading and modernization with the necessary improvements, they are able to use other technologies, improving them [38].
-
H. Godoe believes that the development of technological innovation depends largely on the provision of financial and resource support to research, as well as on the demand from the market. Many technological innovations are absolutely rational as a result of increasing the dynamics of technological regimes. However, “radical” innovations can be the result of intuition [39].
Thus, the analysis of domestic and foreign practice of resource support of innovative development of regions has shown that regions are not only the owners but also the managers of resources for innovative development, and regions ensure their involvement and rational use, too. The extent to which the region is provided with resources for these purposes determines the degree of innovation in its economy and ultimately economic growth.
Research methodology and substantiation of its choice
In the course of the research we propose to analyze the influence of the aggregate part of the indicators we selected that affect the innovative characteristics, and to determine the status and significance of their impact on the level of innovative development.
In the beginning this analysis will be carried out on the economy of the Russian Federation as a whole; then we determine the degree of resource impact on innovative development of regions within the Central Federal District; after that we rank the regions of the Central Federal District and identify the leading regions from the standpoint of innovative factors. We choose this approach since it will allow us to analyze the state of the resource support in the whole country and compare it with the situation in the federal district and in the region and, thus, to identify the weakest directions of resource support of innovative activity in the regions.
We select 13 indicators for 2010–2015 throughout the Russian Federation in order to determine the regularities in the economy and their impact on the formation of economic, social, technological and other resources that ensure the formation of conditions for innovative development (Tab. 1) .
Initially these values are brought in line with comparable prices through the recalculation of the indicators of deflator indices for the economy as a whole. Based on the results obtained, we calculate chain indices, which allow us to compare the calculations made and determine trends in the economy.
Table 1 shows that gross domestic product in comparable prices grew very slowly in 2010–2015: from 1.2% in 2011 to 2% in 2015, the total index of gross regional product experienced even more significant fluctuations: it was negative in 2011 and 2014, it was at the level of 2.4 and 5.9% in 2012 and 2013, and increased by 23.7% in 2015 compared to 2014. With regard to fixed assets in the economy and their annual growth, we note that these indicators also grew very unevenly. For example, fixed assets increased by 11.2% in 2011, by 2.8% in 2012, by 0.7% in 2013, by 2.1% in 2014, and by only 95.8% in 2015 in relation to the previous year. Investments in fixed assets at the beginning of the period grew a little, and their fall was 8.2 and 9%, respectively, in 2014–2015. As for the innovative indicators characterizing the economy, we can say that, for example, the volume of shipped innovative goods experienced a slight increase at the beginning of the period and reached negative values -3.8% and -3.2% by 2014–2015. Expenditures on research and development decreased accordingly and in 2015 amounted to 99.7% from the level of 2014. Expenditures on technological innovation has been growing at an unstable rate, amounting to the same 99.7% in 2015 compared to the previous year. As for the social indicators of government’s performance, then their ability to provide resources for innovative development of economic sectors is also experiencing the impact of the crisis and, according to most estimates, either has a very insignificant growth, or is in the negative zone. Thus, it can be noted that in recent years of crisis, the capacity of the Russian economy to provide resources for innovative development has decreased significantly.
Table 1. Major socio-economic indicators for the Russian Federation for 2010–2015 (in comparable prices)
|
Indicator |
2010 |
2011 |
2012 |
2013 |
2014 |
2015 |
|
GRP, billion RUB |
18.9 |
17.9 |
18.4 |
19.5 |
15.9 |
19.7 |
|
Chain index |
0.946 |
1.024 |
1.059 |
0.817 |
1.237 |
|
|
GDP, billion RUB |
38687768 |
39165036 |
39483822 |
40595001 |
41111454 |
41928474 |
|
Chain index |
1.012 |
1.008 |
1.028 |
1.013 |
1.02 |
|
|
Fixed assets in economy, billion RUB |
71787.7 |
79847.4 |
82049.8 |
82603.4 |
84336.5 |
80804 |
|
Chain index |
1.112 |
1.028 |
1.007 |
1.021 |
0.958 |
|
|
Commissioning of fixed assets, billion RUB |
144.4 |
144.5 |
148.7 |
155.3 |
159.5 |
160.7 |
|
Chain index |
100.093 |
1.029 |
1.045 |
1.027 |
1.008 |
|
|
Investment in fixed assets, billion RUB |
9728.9 |
11788.0 |
12674.6 |
12981.3 |
11780. 8 |
10721.1 |
|
Chain index |
1.212 |
1.075 |
1.024 |
0.908 |
0.91 |
|
|
Volume of shipped innovative goods, billion RUB |
14187.5 |
14760.4 |
15430.0 |
15644.6 |
15042.7 |
14555.9 |
|
Chain index |
1.04 |
1.045 |
1.014 |
0.962 |
0.968 |
|
|
R&D expenditures, billion RUB |
811.3 |
816.5 |
858.0 |
872.1 |
917.0 |
914.7 |
|
Chain index |
1.006 |
1.051 |
1.016 |
1.051 |
0.997 |
|
|
Expenditures on technological innovation, billion RUB |
811.3 |
816.5 |
858.0 |
872.1 |
917.0 |
914.7 |
|
Chain index |
1.006 |
1.051 |
1.016 |
1.051 |
0.997 |
|
|
Average per capita incomes, RUB |
18958 |
20780 |
23221 |
25928 |
27766 |
30474 |
|
Chain index |
1.096 |
1.117 |
1.117 |
1.071 |
1.098 |
|
|
Average annual number of employed people, thousand people |
64493 |
67644 |
67968 |
67901 |
67813 |
68389 |
|
Chain index |
1.049 |
1.005 |
0.999 |
0.999 |
1.008 |
|
|
Average monthly nominal salary of working organizations, RUB |
32479.5 |
31256.6 |
32656.1 |
34652.6 |
35159.6 |
34030 |
|
Chain index |
0.962 |
1.045 |
1.061 |
1.015 |
0.968 |
|
|
Average pensions, RUB |
11589.2 |
10971.7 |
11083.9 |
11536.1 |
11670.4 |
11986 |
|
Chain index |
0.947 |
1.01 |
1.041 |
1.012 |
1.027 |
|
|
Retail trade turnover, million RUB |
25596786 |
25552479 |
26228835 |
27550271 |
28517448 |
27538371 |
|
Chain index |
0.998 |
1.026 |
1.05 |
1.035 |
0.966 |
Source: our own development based on the Russian Statistics Yearbook, 2016: Statistics Collection. Rosstat. Moscow, 2016. 725 p.
Results
In order to identify specific features in the development of socio-economic systems of different levels, it seems appropriate to analyze macro-systems of the national, district and regional levels. Taking into account the fact that individual indicators do not directly influence the growth of innovation, and others are actually the final ones, we have made a list of nine statistical indicators (Tab. 2), on the basis of which it is possible to assess the structure of resource support of innovative development. We include a set of nine indicators in the analysis, first, due to their explanatory value that allows us to identify the results achieved in the socio-economic space of the country and the amount of resources allocated to territorial development. Second, there are no difficulties in collecting official data on this group of indicators for quite a few periods; this provides an opportunity to form qualitative conclusions both in terms of current efficiency and the dynamics of changes in the selected key parameters.
Research findings of the scientists mentioned above show that successful innovative activity has a positive impact on the overall economic performance of territories.
Table 2. Table of indicators assessing resource impact on innovative development
|
Investment in fixed assets |
Х1 |
|
Organizations engaged in R&D |
Х2 |
|
Domestic current expenditure on research and development by type of work |
Х3 |
|
Innovative activity of organizations |
Х4 |
|
Expenditures on technological innovation |
Х5 |
|
Volume of innovative goods, works, services |
Х6 |
|
Value of fixed assets |
Х7 |
|
Depreciation of fixed assets |
Х8 |
|
Average annual number of employed people |
Х9 |
Table 3. Coefficients of correlation between the factors and the outcome indicator*
|
Factor |
Correlation coefficient to GDP (national level) |
Correlation coefficient to GRP (district level) |
Correlation coefficient to GRP (regional level) |
|
Х1 |
0.99 |
0.99 |
0.99 |
|
Х2 |
-0.68 |
-0.65 |
-0.85 |
|
Х3 |
-0.24 |
-0.26 |
-0.31 |
|
Х4 |
0.73 |
0.44 |
0.39 |
|
Х5 |
-0.84 |
-0.29 |
-0.29 |
|
Х6 |
0.95 |
0.91 |
0.91 |
|
Х7 |
0.99 |
0.99 |
0.99 |
|
Х8 |
0.32 |
-0.23 |
0.02 |
|
Х9 |
0.83 |
0.91 |
-0.92 |
|
* Significant factors are highlighted in bold. |
|||
Therefore, it is possible to use the value of gross domestic product for the national level and the value of gross regional product for the level of a single region as a general criterion for assessing economic performance. Thus, those resources that correlate with the final indicator of development can be assessed as having an impact on competitiveness and innovation factors.
The level of impact of the factors on the final result can be assessed by calculating the correlation coefficients of the factors specified in Table 2 relative to gross domestic product and gross regional product at the national level, the level of the federal district (Central Federal District) and at the regional level (Vladimir Oblast), respectively. The correlation coefficients we have calculated are presented in Table 3 .
While analyzing the values obtained we should note that the correlation coefficient values whose modulus is close to one indicate the presence of a strong correlation between the values. Accordingly, at the national level, X3 (domestic current expenditure on research and development by type of work) and X8 (depreciation of fixed assets) should be excluded from the previously defined list of indicators, because the correlation coefficients are less than 0.5 (in modulus), which indicates a weak correlation.
It should be noted that the sets of indicators at the level of the Central Federal District and the Vladimir Oblast are identical, but they differ in composition from that of the national level. At the district and regional levels, indicators X3 (domestic current expenditure on research and development by type of work), X4 (innovative activity of organizations), X5 (expenditures on technological innovation), and X8 (depreciation of fixed assets) should be excluded from the initial set due to their weak correlation with the result indicator.
These conflicting assessments may be due to different levels of management, control and funding of ongoing processes. For example, depreciation of fixed assets and, accordingly, their replacement relates more to the level of a single enterprise (micro level). As well as the issues of working out a policy to increase overall innovation activity among firms belong to the national level and have a weak connection with the value of the resulting indicator at the regional level.
The list of the factors can be divided into three groups:
– organizational factor (X2, X4, X9);
– financial and investment factor (X1, X5, X3);
– production factor (X6, X7, X8).
We have arranged the factors into groups with the help of factor analysis, which allows us to solve two important problems of our study: to describe the object of measurement both comprehensively and in a compact way. With the use of this method it is possible to identify hidden variable factors responsible for the presence of linear statistical correlations between the variables under consideration.
With the help of this analysis we can reduce the number of indicators and prove their socioeconomic unity. We have carried out the factor analysis on certain groups of indicators at the national level. The results are presented in Table 4.
Thus, each of the formed groups of indicators is a single socio-economic phenomenon; in addition, they describe a certain amount of general variability (the proportion of dispersion due to significant factors): 76% – o rganizational factor, 84% – financial and investment factor, 75% – production factor.
As a result, we have reduced the final list of indicators, and now it is as follows:
– federal level – X1, X2, X4, X5, X6, X7, X9;
– regional level – X1, X2, X6, X7, X9.
Thus, in order to carry out the analysis at the level of individual constituent entities of
Russia we should choose the factor model of the district level rather than the model of the national level, because trends in the development of the district coincide with the particular case of the region.
The identified list of factors was used to assess the differentiation of regions within the Central Federal District by the level of resource impact.
The initial data were normalized, which allowed us to solve the problem of the presence of different units of measurement for comparison and analysis of the results.
Normalization was carried out by calculating the ratio of the actual value of the indicator of the i-th region for the year j ( Xij ) to the maximum indicator for this period among the selected subjects ( Xmax ) (1):
X
norm
X ij
X max
Table 5 contains an example of normalized indicators in the context of Russia’s constituent entities. The remaining calculated normalized indicators were determined similarly.
In order to identify a single indicator for the block (according to the list given above), we determined a single indicator based on the formula for calculating the geometric mean. The data obtained are shown in Table 6 .
The analysis has shown that Moscow (#18) and the Moscow oblast (#10) are permanent leaders in all the selected factors for the entire period under consideration; it is due to their
Table 4. Results of the factor analysis
|
Organization factor |
Finance and investment factor |
Production factor |
|||
|
Indicator |
Factor coefficient |
Indicator |
Factor coefficient |
Indicator |
Factor coefficient |
|
Х2 |
0.85 |
Х1 |
0.89 |
Х3 |
0.84 |
|
Х4 |
-0.94 |
Х5 |
0.86 |
Х6 |
-0.97 |
|
Х9 |
-0.82 |
Х8 |
0.88 |
Х7 |
-0.94 |
|
Prp.Totl |
0.76 |
Prp.Totl |
0.84 |
Prp.Totl |
0.75 |
Table 5. Normalization of the data broken down by regions within the Central Federal District (organizations engaged in research and development)
|
го |
ГО см |
ОО ГО |
со |
со |
ГО ГО |
СП со |
го см |
го го |
ю го |
00 |
со |
го ю |
g |
|||||
|
о CM |
||||||||||||||||||
|
ГО см |
ГО |
ю ГО |
со |
ОО |
СО |
ОО |
со ГО ГО |
см |
го |
го |
ю го |
СП го |
со |
g |
||||
|
о CM |
||||||||||||||||||
|
СП см |
го |
со |
СО |
СО |
см |
ГО см со |
СП |
го |
а |
g |
||||||||
|
о CM |
||||||||||||||||||
|
го |
см ГО |
g |
см |
со |
о |
ГО см |
СП ОО ГО |
го |
ОО |
СП го |
го |
LO |
g |
|||||
|
о CM |
||||||||||||||||||
|
ГО |
ГО ГО |
g |
ГО см |
о |
со |
со |
го |
го го |
го |
со |
ОО го |
СП го |
g |
|||||
|
о CM |
||||||||||||||||||
|
см |
ГО см |
ГО ГО |
со |
СП |
о |
см |
ГО |
ГО со |
СП |
го го |
СП го |
00 |
со |
СП го |
g |
|||
|
о CM |
||||||||||||||||||
|
СП см |
СП см |
ОО ГО |
со |
см |
о |
ГО см |
см ГО ГО |
СП |
го |
го |
го |
го |
го |
го |
g |
|||
|
о со см |
||||||||||||||||||
|
см ГО |
со ГО |
СП |
g |
ГО см |
со |
СП го |
го го |
СП |
СП го |
го LO |
го |
СП го |
g |
|||||
|
о со см |
||||||||||||||||||
|
го |
ГО ОО |
со ГО |
СО |
СМ |
го |
го |
го |
го |
го |
го |
g |
|||||||
|
а со см |
||||||||||||||||||
|
СП см |
ОО ГО |
СО |
СП см |
ГО |
см |
го го |
го |
со |
СП го |
го ю |
со |
го го |
g |
|||||
|
о о см |
||||||||||||||||||
|
СП см |
ОО ГО |
см |
СО |
СП см |
ГО |
го |
го го |
со |
СП го |
го ю |
со |
го го |
g |
|||||
|
а со см |
||||||||||||||||||
|
о |
о |
о |
о |
о |
о |
о |
о |
о |
о |
g |
||||||||
|
ст |
с5 m |
Ё |
Е о |
о 5 |
-И. |
g S |
о о |
5 |
Е со |
Е |
о |
о н |
I |
Table 6. Final indicators of resource impact of selected factors on innovative development
|
о |
О |
СТ LO |
ОО |
ОО со |
ст |
s |
oo CO |
ст |
oo |
s |
LO co |
co co |
g |
CT |
s |
g |
g |
CT |
g |
E > |
O |
CT |
oo CT |
CT |
s |
CT |
s |
CT |
s |
|
ст |
СО |
CD |
g |
о |
s |
g |
CT |
CT |
oo oo |
oo oo co |
CT |
CT |
LO |
LO |
LO |
CT co |
g |
CT |
oo |
CT |
CT |
g |
CT |
oo |
CO |
||||
|
СТ |
S |
CD |
LO |
О |
s |
g |
CT |
oo |
oo |
oo co |
CT |
CT |
CT |
CT LO |
СП LO |
CT LO |
CT co |
g |
CT |
CT CT |
CT |
CT |
CT |
СП CT |
CT |
A |
|||
|
CD |
СО |
lo |
СП LO |
О |
CT |
CT |
LO |
co |
СП oo co |
co CT |
CT |
CT |
g |
СП LO |
g |
g |
g |
CT |
CT |
oo CT |
CT |
СП |
СП |
О |
A |
||||
|
О |
СО |
S |
СП LO |
О |
s |
g |
CT |
s |
co |
CT co |
co CT |
CT |
CT |
g |
СП LO |
g |
g |
g |
CT |
О |
g |
CT |
oo CT |
CT |
я |
CT |
|||
|
ст |
СО |
S |
g |
О |
CT |
co |
CT |
s |
s |
oo CT co |
CT CT |
CT |
CT |
oo |
g |
g |
g |
g |
CT |
CT |
Я |
О |
CT |
CT |
я |
CT CT |
|||
|
СТ СТ |
g |
s |
g |
СТ |
s |
oo co |
СП |
g |
LO oo |
oo co |
CT |
CT |
СП CT |
СП |
g |
g |
co |
g |
СП CT |
CT |
CT |
CT |
OO СП |
Q |
CT CT |
oo |
CT |
||
|
g |
LO |
S |
g |
oo |
ID |
g |
oo CT |
co oo |
oo co |
g |
CT |
CT |
CT |
CT |
§ |
CT co |
g |
g |
Ст |
СП |
CT |
LO |
oo |
CT |
|||||
|
g |
ОО LO |
со |
g |
О |
oo LO |
g |
oo CT |
s |
co |
ст co |
CT |
CT |
LO CT |
CT |
CT |
СП LO |
g |
g |
Ст |
CT |
oo CT |
CT |
CT |
CT |
CT CT |
||||
|
g |
g |
g |
ст |
О |
S |
S |
oo CT |
oo LO |
oo oo |
co |
CT CT |
CT |
CT |
СП |
CT |
СП LO |
СП LO |
g |
g |
CT |
СП |
oo CT |
CT CT |
CT |
CT |
CT |
CT CT |
||
|
g |
S |
g |
ст |
О |
S |
S |
oo CT |
oo LO |
s |
co |
CT CT |
CT |
CT |
СП |
CT |
СП LO |
g |
g |
g |
CT |
СП |
oo CT |
CT CT |
CT |
CT |
CT |
CT CT |
||
|
о ст m |
о м |
о Ё |
О |
о |
о |
о 1 о |
о 5 |
о |
о g 5 |
о о |
о |
о E co |
о E |
о |
о H |
о I |
g 5 |
о CT |
о m |
о Ё |
о |
о |
о |
о 1 о |
о 5 |
End of Table 6
|
ст |
ст |
СТ ОО |
С\1 ОО |
СО |
ст |
СТ |
ст |
ОО |
g |
Q- |
ст |
oo oo |
g |
Q |
g |
g |
LO |
g |
g |
co |
oo |
CT |
OO CXJ |
g |
g |
|||||
|
g |
ОО |
ОО |
СП ОО |
СО |
ст |
S |
g |
СТ |
g |
s |
s |
S |
s |
g |
g |
oo co |
oo |
g |
CT |
CXJ |
CT |
CT |
ст |
CXJ |
g |
|||||
|
ОО |
ст |
со |
ОО |
ОО LO |
СТ |
ст |
S |
s |
g |
g |
oo |
LO OO |
s |
ro |
СП OJ |
g |
g |
s |
я |
CT g |
g |
CT |
CT |
CT |
CXJ oo |
CT OO |
OO |
g |
||
|
ст |
со |
2 |
ОО ОО |
S |
g |
СП СО |
со |
g |
CT |
CXl |
LO oo |
СП oo |
g |
oo |
CD |
О |
g |
g |
CT |
oo |
oo |
oo oo |
CT |
CT |
g |
|||||
|
ст |
ОО |
О |
СТ |
g |
ст |
ст |
СП |
ст |
g |
g |
g |
g |
OJ LO |
о |
я |
OO |
CT |
LO |
я |
LO oo |
CT co |
OO |
oo |
g |
||||||
|
СП ОО |
ОО ОО LO |
СП С\1 |
S |
ст |
ст |
ОО |
ОО СП |
СП СП |
g |
О |
oo oo |
oo |
co СП |
oo LO |
OO OJ |
СП |
OJ oo |
CT |
co oo |
CT |
oo |
CT CXJ |
CT |
g |
oo CXJ |
g |
||||
|
СТ |
С\1 СП |
g |
CXJ |
СП ОО |
S |
ст |
g |
СТ |
g |
СП |
s |
oo |
LO |
g |
s |
s |
OJ oo |
oo |
co |
§ |
CT CXI |
CT |
CT LO |
CT |
О |
s |
CXJ |
g |
||
|
о |
ОО ОО |
ОО |
оо |
С\1 ОО |
СТ |
S |
S |
СТ |
g |
g |
§ |
о |
я |
oo |
OJ oo |
co |
g |
g |
CD |
oo oo |
я |
CT oo |
co |
О |
CXJ |
CT oo |
g |
|||
|
ст |
ст |
ст |
g |
S |
CXJ |
ОО ОО |
S |
S |
ОО со |
g |
g |
СП |
oo |
s |
oo |
oo oo |
oo LO |
s |
OO CT |
2 |
oo |
CT |
co oo |
CT |
g |
OO CT |
CT |
g |
||
|
g |
ст |
ст ОО |
о |
С\1 ОО |
С\1 ОО |
S |
ст |
ОО СП |
g |
g |
я |
c^ |
СП oo |
co |
g |
g |
Ю |
CT CT |
g |
LO oo |
CT |
co oo |
g |
О |
g |
CT |
g |
|||
|
g |
ст |
ст ОО |
о |
S |
С\1 ОО |
С\1 ОО |
S |
g |
ОО СП |
g |
CT |
g |
g |
о |
s |
я |
g |
oo |
СП |
CXJ |
LO oo |
g |
g |
CT |
g |
g |
CD |
g |
||
|
о |
о g 5 |
о о |
о 5 |
о Е со |
о Е |
о |
о н |
о I |
g 5 |
о CT |
о m |
о Ё |
о |
о |
о |
о 1 о |
о 5 |
о |
о g 5 |
о о |
о |
о E co |
о E |
о |
о H |
о I |
g 5 |
clear leadership in the initial data, which are quantitative (Fig. 1). We should point out the Voronezh Oblast (#4), which is also a leading region and it clearly stands out among the rest of the subjects.
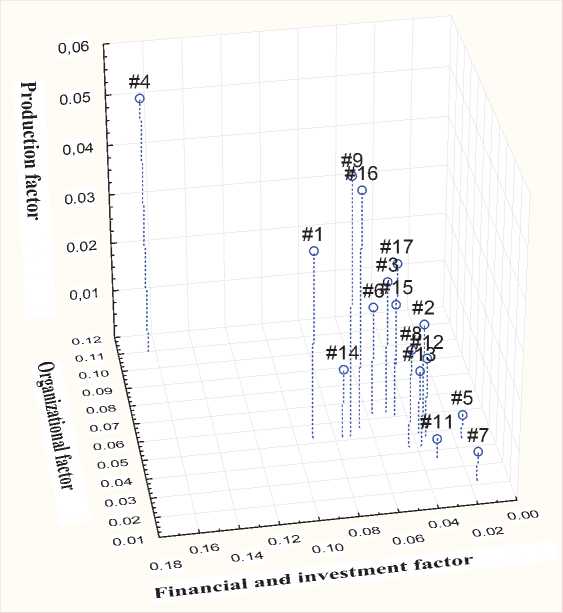
In order to differentiate the other regions into groups we designed a three-dimensional scattering diagram for 2015 (final period) (Fig. 2) under condition that the identified leading subjects were excluded.
While analyzing the graph we identified leading regions (the indicators of which tend to the maximum for all the three factors): these regions are the Belgorod, Lipetsk, Voronezh and Tula oblasts.
The Orel, Ivanovo and Kostroma oblasts, whose development indicators are minimal, can be considered as lagging behind.
Conclusion
Summing up the results of this study, we should emphasize that we have formed a tool that makes it possible to assess the resource component associated with the provision of innovative development. The list of criteria we formed has been adjusted on the basis of the differences revealed in the factor models of development of social and economic systems at the appropriate levels of administrative subordination. The analysis has revealed significant deviations in the list of factors characterizing the features of their innovative development in the national, district and regional indicators. At the same time, we have found out that the structures of innovation assessment factors in the federal district and in the constituent entity of Russia are the same.
Figure 1. Scattering diagram of regions within the Central Federal District, 2015
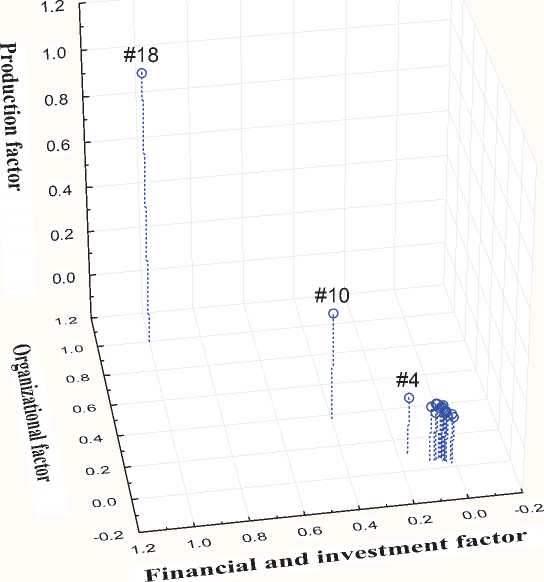
Figure 2. Scattering diagram of regions within the Central Federal District, except Moscow and the Moscow Oblast, 2015
|
Belgorod Oblast |
1 |
Lipets Oblast |
9 |
|
Bryansk Oblast |
2 |
Oryol Oblast |
11 |
|
Vladimir Oblast |
3 |
Ryazan Oblast |
12 |
|
Voronezh Oblast |
4 |
Smolensk Oblast |
13 |
|
Ivanovo Oblast |
5 |
Tambov Oblast |
14 |
|
Kaluga Oblast |
6 |
Tver Oblast |
15 |
|
Kostroma Oblast |
7 |
Tula Oblast |
16 |
|
Kursk Oblast |
8 |
Yaroslavl Oblast |
17 |
References Regional system of economic and social factors in the formation of innovation development resources
- Blyakhman L.S. New industrialization: its nature, political-economic basis, socio-economic background and support. Problemy sovremennoi ekonomiki=Issues of Modern Economy, 2013, no. 5, pp. 65-74.
- Glazyev S.Yu. Aktual'nye problemy razvitiya rossiiskoi ekonomiki . Saint Petersburg: SPbGUP, 2017. 48 p.
- Golichenko O.G. Opportunities and Alternatives of Russian Innovative Development. Innovatsii=Innovations, 2013, no. 5, pp. 154-159..
- Grinberg R.S. The economy of modern Russia: The results of market reforms and reindustrialization problems. Problemy teorii i praktiki upravleniya=Theoretical and Practical Aspects of Management, 2017, no. 7, pp. 8-24..
- Ivanov V.V. Scientific and technological development in Russia in the context of industrial revolution. Innovatsii=Innovation, 2016, no. 6 (212), pp. 3-8..
- Ivanova N.I., Danilin I.V. Science and innovation as drivers of world development. Politicheskaya nauka pered vyzovami global'nogo i regional'nogo razvitiya. Ser. "Rossiiskaya politicheskaya nauka: Istoki i perspektivy" . Moscow, 2016. Pp. 324-342.
- Sorokin D.E. Russia's economy: concepts and realities. In: Fenomen rynochnogo khozyaistva: vektory i osobennosti evolyutsii . London, 2017. Pp. 20-25..
- Fonotov A.G. Strategiya-2035. Zhelaemoe. Vozmozhnoe. Dostizhimoe Strategy-2035. What is desired. What is possible. What is achievable. Innovatsii=Innovations, 2016, no. 6 (212), pp. 24-31..
- Armstrong M. Strategicheskoe upravlenie chelovecheskimi resursami . Translated from English. Moscow: Infra-M, 2002. 328 p.
- Becker G.S. A Theory of Social Interactions. NBER, WP42, 1974. 55 p.
- Beatty R.W., Bernardin H.J. Performance Appraisal: Assessing Human Behavior at Work. Kent Human Resource Management Series. Boston: Kent, 1984. 72 p.
- Van Dein Ya. What phase of the Kondratiev cycle are we in? Voprosy ekonomiki=Issues of Economy, 1992, no. 10, pp. 79-80.
- Mensch G. Tekhnologicheskii pat: innovatsii preodolevayut depressiyu . Moscow, 2001. P. 35.
- Nelson R.R. The Sources of Economic Growth. Wiley, Harvard University Press, 2000. 336 p.
- Porter M.E., Kramer M.R. Strategy and society: the link between competitive advantage and corporate social responsibility. Harvard Business Review, 2006, December, pp. 78-92.
- Silverberg G., Verspagen B. Brewing the Future: Stylized Facts about Innovation and Their Confrontation with a Percolation Model. Paper presented at the EMAEE Conference, Augsburg, 2003, April 10-12.
- Thurow L. The Zero-sum Society: distribution and the possibilities for economic change. London, 1981. 199 p.
- Myrdal G. Challenge to Affluence. New York, 1963. 156 p.
- Schumpeter J. Teoriya ekonomicheskogo razvitiya . Moscow: Eksmo, 2007. 864 p.
- Kislitsyna V.V. Formation of the integrated approach to the assessment of the socio-economic development of regions. Ekonomika regiona=Economy of Region, 2017, vol. 13, no. 2, p. 369..
- Kukushkin S.N. Innovation activity of Russian economy: problems, features, ways to address them. Vestnik REU im. G.V. Plekhanova= Vestnik of the Plekhanov Russian University of Economics, 2014, no. 6, pp. 109-115..
- Yakovleva E.A. Innovative development of Russian economy (concept of import substitution). Vestnik finansovogo universiteta=Bulletin of the Financial University, 2016, no. 6, pp. 54-62..
- Patrakeeva O.Yu., Kryukov S.V. System-dynamic model of regional economy (on the example of the Rostov Oblast). Problemy prognozirovaniya=Studies on Russian Economic Development, 2016, no. 3, pp. 71-76..
- Belskiy V.V. Regional market of scientific and technical products as an element of the regional innovative subsystem. Vestnik Instituta ekonomiki RAN=Herald of RAS Institute of Economics, 2017, no. 1, pp. 170-182..
- Alkhazov A.A. The effect of small and medium business upon the economic potential of a region. Vestnik finansovogo universiteta=Bulletin of the Financial University, 2016, no. 5, pp. 37-44..
- Khokhlova O.A., Sibirskaya E.V., Stroeva O.A. Invariant content of development of regional economic systems. Vestnik REU im. G.V. Plekhanova=Vestnik of the Plekhanov Russian University of Economics. 2014. №3. S. 65-77.
- Stolbov V.A. Regional Potential and Regional Capital: "Possibility" -"Reality" -"Necessity". Ekonomika regiona=Economy of Region, 2016, vol. 12, no. 4, pp. 1014-1027..
- Bakhtizin A.R., Bukhvald E.M., Kol'chugina A.V. Alignment of regions in Russia: illusions of the program and reality of the economy. Vestnik Instituta ekonomiki RAN=Herald of RAS Institute of Economics, 2016, no. 1, pp. 76-91..
- Shvetsov A.N. "Points of growth" or "black holes"? (concerning application effectiveness of "zonal" tools for government boosting of territories' economic dynamics. Rossiiskii ekonomicheskii zhurnal=Russian Economic Journal, 2016, no. 3, pp. 40-61..
- Sukharev O.S. Questions of Strategy for Russia's Development. Federalizm=Federalism, 2016, no. 1, pp. 133-154..
- Lenchuk E.B. Formation of personnel potential for innovative economy. Ekonomicheskoe vozrozhdenie Rossii=Economic Revival of Russia, 2017, no. 1, pp. 22-26..
- Gladysheva A.V. Human resources and innovations as the most important components of competitive advantages of a company. Sotsial'no-ekonomicheskie yavleniya i protsessy=Social and economic phenomena and processes, 2014, vol. 9, no. 11, pp. 34-38..
- Kudryavtseva E.I. Cognitive economy and cognitive management: the new concept of human resources management. Upravlencheskoe konsul'tirovanie=Management Consulting, 2014, no. 4, pp. 62-69.
- De Groot H., Poot J., Smit M. Agglomeration externalities, innovation and regional growth: theoretical perspectives and meta-analysis. In: Capello R. (Ed.) Handbook of Regional Growth and Development Theories. Cheltenham: Edward Elgar Publishing Limited, 2009. 529 p.
- Zimmermann E.W. What we mean by resources. In: Drummond L. (Ed.). Texas Looks Ahead. Austin (Texas), 1944. 136 p.
- Hauser J., Tellis G.J., Griffin A. Research on innovation: a review and agenda for Marketing Science. Marketing Science, 2006, vol. 25, no. 6, pp. 687-717.
- Zemlickiene V. Analysis of high-technology product development models. Intellectual Economics, 2011, vol. 5, no. 2, pp. 283-297.
- Bresnahan T.F., Trajtenberg M. General purpose technologies: "engines of growth"? Journal of Econometrics, 1995, vol. 65, no. 1, pp. 83-108.
- Godoe H. Innovation regimes, R&D and radical innovations in telecommunications. Research Policy, 2000, vol. 29, no. 9, December, pp. 1033-1046.
