Regional tax gap and assessment of its determining factors

Author: Pugachev Andrey A.
Journal: Economic and Social Changes: Facts, Trends, Forecast @volnc-esc-en
Section: Public finance
Article in issue: 3 т.13, 2020.
Free access
Reduction of the tax gap at the regional level contributes to development of tax potential and the increase of regions’ budget security. The purpose of the article is to study the tax gap at the regional level in the Russian Federation (RF) on the basis of a comprehensive assessment of factors that determine it. Approaches to the determination of the tax gap at regional and national levels are summarized. Factors that form the tax gap are defined. Due to the purpose of the study, it includes the amount of taxes and fees’ arrears, the amount of additional taxes and fees in case of tax inspections’ continuous coverage of taxpayers, and the scale of the shadow economy. The developed methodology for analyzing the structure and dynamics of regional tax gap factors is presented. It allows assessing its size, structure, and the work quality of region’s tax and financial authorities. Besides, it allows identifying opportunities for reducing the tax gap. A variant of grouping entities of the Federation regarding the state and prospects of reducing the tax gap, formed on the basis of the ratio of its level and dynamics, is proposed. Grouping of regions helps to conduct its comparative analysis according to the tax gap and its determining factors. The potential for reducing the tax gap in Russia by improving the quality of tax administration has been largely implemented. The work with tax arrears opens up opportunities for financial and tax authorities. The shadow economy has the largest share in the tax gap, which actualizes the importance of conducting the comprehensive work of the state to legalize it.
Tax gap, tax competition, tax potential of the region, factors of the tax gap, tax arrears, shadow economy, tax control
Short address: https://sciup.org/147225470
IDR: 147225470 | UDC: 336.71.078.3 | DOI: 10.15838/esc.2020.3.69.7
Text of the scientific article Regional tax gap and assessment of its determining factors
Development of regions’ tax potential is necessary for smoothing spatial differentiation [1, p. 58–59], aligning budget security, and fulfilling the state’s announced contribution to economic development within slowing growth rates in Russia when the real GDP growth rate has not been exceeding 1–2% since 2013 (in case of 2015 recession)1. It is possible, first, through expanding the tax base without increasing the tax burden. For example, by activating tax competition of regions for mobile tax bases or reducing the tax gap.
Tax competition for mobile tax bases implies fair competition between state authorities of entities of the federation through establishing taxes and taxation conditions, when the choice of a particular policy by each authority affects the distribution of the mobile tax base [2, p. 1]. Currently, in Russia, regional tax competition is at the stage of formation. We assume that, with the help of tax competition tools, state authorities of federation’s entities try to inspire investors’ interest in the region by compensating for shortcomings of the investment climate, economic and geographical location, resource base, infrastructure development, and business environment. The process of a horizontal tax competition in Russian regions requires a separate study.
The tax gap at regional and national levels is not sufficiently explored in domestic studies, and, in practice, assessments exist (in tax authorities), but it is not official despite the fact that the amount of tax gap factors is significant: tax arrears exceed 1 trillion rubles, or 8.4% of the RF consolidated budget’s revenue, or 1.1% of GDP2, and the shadow economy, according to official data, reaches 12–15% of GDP3, according to unofficial sources – 23–44% [3, p. 9]. At the same time, for example, statistics on the tax gap have been published for decades in the EU at the state level4. The United States was the first country to begin measuring the number of taxpayers, who fulfill and do not fulfill tax obligations, and potential lost tax revenues back in 1963 [4, p. 121].
The purpose of the study is to fill the gap in the definition of the tax gap at the RF regional level, which exists in domestic financial science, through a comprehensive assessment of factors that form the tax gap.
Approaches to defining the tax gap and its interconnections with other categories
In modern financial science and practice, a unified approach to the definition of the tax gap has not been formed. This category is reviewed in theoretical and applied terms. Within a theoretical or scientific approach, the tax gap is understood, extremely generally, as the difference between actual tax revenues to the budget system and accrued taxes, or a potential possible level of tax revenues. In this case, the tax gap is reviewed at the macro-level, so the approach may also be called macroeconomic. At the same time, with development of methods of tax control and administration, in particular, with the introduction of SUR ASK NDS-2, the term “tax gap” became widespread in financial and economic activities. The practical approach assumes that the tax gap is interpreted as discrepancies in data on tax declarations of counterparty organizations in the same operations. In other words, the tax gap here is a sign of incorrect calculation of tax liabilities, illegal application of tax deductions with the emergence of discrepancies in the reflection of same operations by counterparties. Thus, according to the practical approach, the tax gap is reviewed at the micro-level, but it is also generally associated with the difference between paid and accrued level of tax payments.
How do researches define the tax gap? O.A. Mironova, F.F. Hanafee regard the tax gap as the difference between the sum of tax payments which could come in the budget system on the condition of full settlement of all tax legislation norms and timely transfer of taxes, on the one hand, and, on the other hand, the tax sum actually paid up in the reporting period. Scientists emphasize that this difference may occur due to deliberately hidden by taxpayers tax bases, their failure to fulfill tax obligations, the usage of illegal tax minimization schemes and, as a result, the lack of sufficient tax payments’ inflow into the budget [5, p. 112].
D.Y. Shakirova and V.N. Zasko give the following definition. The tax gap is the difference between the amounts of actually received taxes and estimated amounts of tax sums that could be received by the budget system, if taxpayers fully complied with the legislation on taxes and fees [6, p. 163].
Foreign scientists Raczkowski K. and Mro’z B. define the tax gap as the difference between owing taxes that taxpayers had to pay over a certain period of time, and the amount of tax that was actually brought to the state budget [7, p. 546].
The US Chamber of Commerce gives the following interpretation. The tax gap is the difference between the amount of taxes that taxpayers should have paid and what they have actually paid voluntarily and on time5.
The tax gap may also be reviewed within individual taxes. It is noted in the European Commission’s Project group report on the tax gap that the tax gap on corporations’ revenue is the difference between potential liabilities, i.e. a tax that would have been collected if all taxpayers had complied with tax laws, and actual tax payments. The corporate income tax gap may be represented as a percentage of GDP, as a percentage of potential liabilities, or as absolute values [8, p. 22].
Besides, in scientific studies, there is a common usage of the term “gap” in relation to tax management: for example, “tax gap management”. In this context, it is about the management of specific imbalances natural for the tax system: between the effects of taxation on progressive and flat scales; in the sphere of foreign economic activity, depending on VAT; tax benefits; between budget revenues and expenditures; in time lags between GDP creation and generation of tax revenues [9, p. 23].
Thus, approaches to determining the tax gap are largely similar among domestic and foreign researchers. It is based on categories of taxpayers’ tax liabilities and actual tax receipts. Main criteria are completeness and timely fulfillment of tax obligations. At the same time, the criterion of timeliness is not underlined in all definitions, for example, it is absent in the definition of D.Y. Shakirova and V.N. Zasko, as well as in the European Commission Project group report on the tax gap. We consider this criterion to be significant, since it is important not only to fully fulfill tax obligations but also to pay it within the time set by law.
Summarizing various approaches, we believe that the tax gap may be defined as the difference between actual tax revenues and estimated ones that could replenish the budget if all taxpayers complied with the legislation. In other words, as the difference between actual tax revenues and tax potential.
It is also important to determine the interconnection between tax potential, tax gap, and tax limit categories.
We understand tax potential as the component of the structure of budget and financial potential which is the maximum amount of revenue of the budget system, potentially accumulated in the form of taxes, fees, and other mandatory payments from economic entities on a given territory within the current model of tax federalism for a certain period of time, mediated by tax authorities, in accordance with the state’s tax policy and considering the level of economic development6.
Tax potential is not the same as the tax limit. The usage of the term “tax limit” is associated with the theory of tax incidence in the 1970s. A. Laffer illustrated the interconnection between the amount of tax revenues and the value of tax rates [10]. The usage of the “limit” category is caused by the definition of the extremum point of the specified function, which means the tax rate that maximizes tax revenues. Therefore, the tax limit should be considered as maximum tax payments that may be withdrawn. It includes the tax potential within the current tax system and the tax gap.
Figure 1. Graphical representation of the interconnection between concepts “tax potential” – “tax gap” – “tax limit”
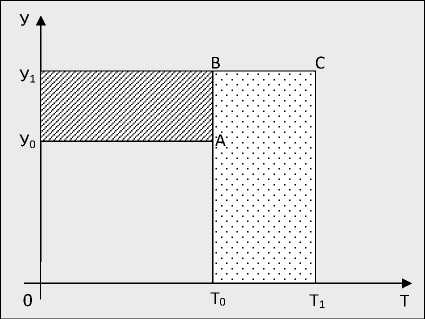
Source: Pugachev A.A. Development of the Region’s Tax Potential within Improving Tax Federalism: diss. … cand. of econ. sci.: 08.00.10. Yaroslavl, 2016. P. 42.
The ratio of these categories is schematically shown in Figure 1 .
On the abscissa axis, tax rates are deferred (T), on the ordinate axis – the tax base level (У). Т0 is a current tax rate at which taxpayers declare the tax base У0, while the actual tax base is У1. Rectangle 0У0АТ0 represents an actual tax paid or realized tax potential, and rectangle 0У1ВТ0 represents a nominal tax potential. The difference between the tax potential and actual tax revenues, which is the area of the rectangle У0У1ВА, represents the tax gap. The tax limit will be reached (hypothetically), if the tax rate Т1 at which, according to A. Laffer, the maximum budget revenue is generated, is applied to the actual tax base of У1. Its value is defined by the rectangle 0У1СТ1.
It seems that today, in financial science, the value of the ratio of realized and nominal tax potential increases just like possibilities of its usage in the practical sphere. The corresponding ratio, disclosed by the definition of “tax effort”, is used by foreign researchers. For example,
-
L. Alfirman [11] defines tax effort as the ratio of actually accumulated tax revenues to estimated (potential) tax revenues. This position is shared by R.M. Bird, J. Martinez-Vazquez, B. Torgler [12]. Accordingly, these categories are directly related to the tax gap: the indicator of the tax gap is implemented in its calculation.
Tax gap factors
The tax gap is the difference between the nominal and realized tax potential, and it is determined by the impact of the scale of the shadow economy, corruption, tax evasion, quality of tax administration, and other factors. The definition of the list of these factors may vary depending on research objectives. Let us review some identification options and classifications of tax gap factors.
A large number of states are interested in quantitative assessment of the tax gap. Currently, countries of the former Soviet Union also joined them. However, officially published methodological designs are presented only by the USA, individual countries of Latin America, and the EU [13, p. 136].
While determining the tax gap, the department of Tax Revenue and Customs in Great Britain takes into account losses caused by activities of organized criminal groups, participation of economic entities in the shadow economy, the usage of tax evasion schemes, distortion of a taxable object, interpretation of tax consequences of complex economic operations, errors, and negligence of the necessary level of caution and non-payment7.
The US Chamber of Commerce assesses the tax gap according to three factors: understatement of tax obligations on timely filed tax declarations; underpayment of taxes owed due to timely filed declarations; understatement of tax obligations by evading payments with the absence of a tax declaration8.
Scientists identify main factors of the tax gap: the shadow economy and criminal business, abuse of offshore zones, errors, or negligence of taxpayers [14, p. 7; 19, p. 60]. A set of tax gap factors may differ depending on research objectives – it causes scientific discussions. For example, the provision of tax benefits and losses of organizations are reviewed as factors [16, p. 137].
Thus, researchers’ approaches to determining a set of factors of the tax gap are very similar. These include the shadow economy, tax evasion, and the quality of tax control and administration.
Information and methodological basis for the study of factors that determine the tax gap
The author’s methodology for analyzing the structure and dynamics of tax gap factors at the regional level includes the following stages.
-
1. Collection of statistical data and determination of tax gap estimated components.
-
2. Calculation of indicators.
-
3. Analysis of the structure and dynamics of the tax gap.
-
4. Assessment of the results and drawing conclusions on the components of the tax gap and the prospects of its reduction.
In this study, the tax gap includes amounts of owed taxes, fees, and other mandatory payments administered by the Federal Tax Service (FTS), amounts of additional taxes and fees based on the results of tax audits, and estimated data on the scale of the shadow economy. In another words, according to factors which are represented by available statistical data. The first two components are based on official statistical and analytical data of FTS RF – according to following reports: no.1-NM “Report on the accrual and receipt of taxes, fees, insurance premiums, and other mandatory payments to the budget system of the Russian Federation”, no.4-NM “Report on arrears of taxes, fees, insurance premiums, penalties and tax sanctions to the budget system of the Russian Federation”, no.2-NK “Report on the results of control work of tax authorities” 9. The third component is based on official Rosstat data on the share of non-observed economy in GDP, and it includes operations of the shadow and informal sector that are not observed by direct statistical methods10. The shadow sector is formed by taxpayers who deliberately avoid paying taxes or complying with legislation [17, p. 46–47]. The informal sector is a productive activity carried out by households that are not registered as organizations, sole proprietors, or self-employed citizens.
Each of these factors is defined separately. To calculate tax and fee arrears at all levels of the budget system at the end of the year without arrears that should not be collected by tax authorities, its components must be deducted from total tax arrears:
– deferred (installment) payments,
– arrears suspended for collection,
– arrears recovered by bailiffs, according to the resolution on initiation of Executive production,
– arrears that cannot be recovered by tax authorities.
The potential for additional taxes and fees in case of 100% coverage of taxpayers by audits is determined by the reverse account based on the amount of additional accrued taxes according to the results of tax audits and the share of taxpayers covered by tax audits.
The tax potential of the non-observed economy is calculated as the product of the share of the unobservable economy and the amount of tax revenues of all levels of the budget system from taxpayers in a given region. The tax gap calculation scheme, used in this study, is represented by the formula (1).
Tax gap = T D + TPTК + TPSE , (1)
where Tax gap is the tax gap,
TD – the tax gap according to tax arrears,
TPTK – potential of additional tax assessment, if audits cover 100% of taxpayers,
TPSE – tax capacity of the non-observed economy.
Each of the components is calculated using the following formulas (2) – (4).
TD = TTD - TDa - TDb - TDc - TDe, (2)
where TTD – total tax arrears,
TDa – tax arrears suspended for collection by the tax authorities,
TDb – tax arrears that cannot be collected by tax authorities,
TDc – tax arrears collected by bailiffs,
TDe – deferred (installment) payments .
TPTK = 1^(1-^ , (3)
d where TP is the amount of additional tax accrual based on the results of tax audits, d is the percentage of taxpayers covered by tax audits.
TPSE = TR x SE, (4)
where TR is the amount of tax revenues of the consolidated budget of the Russian Federation from taxpayers in a region (full realized tax potential),
SE is the share of non-observed economy.
Let us define assumptions for assessing the tax gap.
First, we define the tax gap of each region for the consolidated budget of the Russian Federation as a whole, that is, as a complete tax gap for all taxes and fees regardless of the distribution of tax revenues across the levels of the budget system.
Second, while estimating the share of the non-observed economy in regions, the assumption that the share of the non-observed economy in federal subjects is equal to the average share of non-observed economy in Russia is used. This assumption is caused by the lack of official statistics on non-observed economy within the Russian Federation’s constituent entities. However, it is necessary to understand that the difference may be significant [18, p. 2017–2018]. According to the methodology of Rosstat, economic operations that are not observed by direct statistical methods include shadow, illegal, and operations in the informal sector. Illegal operations are prohibited, and Rosstat does not currently count in non-observed economy. The absence of its accounting does not affect the tax gap, since prohibited activities do not form the tax potential, and taxation is not provided for it.
Third, we assume that full coverage of all taxpayers by tax audits will increase the additional accrual of taxes and fees proportionally to the additional assessment with the actual coverage of taxpayers by tax audits. Considering current trends and the quality of control work of tax authorities, the usage of a risk-based approach to tax audits, it can be assumed that the level of additional charges for non-covered tax audits of taxpayers will be lower than for the covered one. This is caused by the usage of a risk-based approach by FTS units, which assumes that site inspections are aimed at those taxpayers who, most likely, made violations of tax legislation while calculating and paying taxes which is defined by tax authorities as the result of pre-inspection analysis. In this regard, while calculating the share of taxpayers covered by tax audits, onsite and off-site inspections are considered as reflected in the report no. 2-NK. At the same time, it is likely that, with further development of tax administration and control, new tax schemes and identification mechanisms will be identified, which were not previously known to tax authorities, that will further increase the collection of taxes and fees and reduce the tax gap. For example, currently used tax schemes for corporate income tax, through splitting, or, on the contrary, consolidation of businesses, including the largest taxpayers, which causes huge damage to regional budgets and especially ones with a mono-structured tax base due to the lack of transparency in the administration of profits of major corporations [19, p.113].
Fourth, when calculating the share of taxpayers covered by tax audits, it is assumed that 1 taxpayer has 1 tax audit per year, which may often be different. The usage of this approach is dictated by the lack of relevant statistical data on tax audits in the context of taxpayers.
Fifth, the used approach does not take into account behavioral responses of taxpayers to the actions of authorities to change tax legislation, reduce the tax gap, and improve tax administration. The latter assumption is probably common to all tax gap calculations today
Analysis of the structure and dynamics of tax gap factors at the regional level
Let us consider the implementation of the second stage of the methodology for analyzing the structure and dynamics of tax gap factors on the example of the Yaroslavl Oblast which is an old industrial region located in the North of the European territory of Russia. It is a part of the Central Federal District, with indicators of socio-economic development close to national average ones11.
At the second stage, indicators are calculated. Table 1 shows the calculation process and results for 2011 and 2015–2017. The most relevant statistical GRP data are data for 2017, which determined the boundary of the analyzed period. To ensure the possibility of analyzing the dynamics of indicators, 2011 was the earliest in retrospect, for which all the necessary statistical data on current forms of reporting of the FTS and Rosstat are available.
Table 1. Algorithm for determining the structure and dynamics of factors that form the tax gap, on the example of the Yaroslavl Oblast
|
Indicators |
2011 |
2015 |
2016 |
2017 |
Growth rates, 2017 to 2011 |
|
1. Tax and fee arrears to all levels of the budget system at the end of the year, mil. rub., incl. |
5 965.9 |
7 488.9 |
16 323.6 |
11 181.9 |
1.87 |
|
1.1. collected by bailiffs, mil. rub. |
1 322.0 |
1 380.4 |
1 289.4 |
1 300.4 |
0.98 |
|
1.2. deferred payments, mil. rub. |
3.9 |
0.8 |
19.6 |
21.4 |
5.49 |
|
1.3. suspended for collection, mil. rub. |
1 035.1 |
1 042.6 |
9 052.7 |
1 585.7 |
1.53 |
|
1.4. impossible to collect, mil. rub. |
49.1 |
26.9 |
31.8 |
39.2 |
0.80 |
|
2. Tax gap in tax arrears, mil. rub. (1 – 1.1 – 1.2 – 1.3 – 1.4) |
3 382.8 |
4 991.6 |
5 771.8 |
8 146. 4 |
2.41 |
|
3 Amount of taxes and fees additionally accrued according to the results of tax audits, mil. rub. |
1 677.2 |
1 282.0 |
1 623.0 |
1 316.4 |
0.78 |
|
4. Percentage of taxpayers covered by tax audits, % |
52.6 |
42.7 |
56.9 |
79.3 |
1.51 |
|
5. Potential for additional taxes and fees in the case of 100% coverage of taxpayers by audits, mil. rub. (3 X ((100%-4) / 4)) |
1 508.8 |
1 722.8 |
1 229.1 |
344.3 |
0.23 |
|
6. Share of non-observed economy in GRP, % |
14.6 |
13.2 |
13.2 |
12.7 |
0.87 |
|
7. Realized tax potential – the amount of tax revenues of budgets of all levels of the budget system from taxpayers in the region, mil. rub. |
70 747.2 |
105 749.0 |
125 652.1 |
142 075.1 |
2.01 |
|
8. Tax potential of non-observed economy, mil. rub. (6 x 7) |
10 329.1 |
13 958.9 |
16 586.1 |
18 043.5 |
1.75 |
|
9. Ta gap, mil. rub. (2 + 5 + 8) |
15 220.7 |
20 673.3 |
23 587.0 |
26 534.3 |
1.74 |
|
10. GRP, mil. rub. |
286 967.5 |
443 054.1 |
472 344.0 |
510 631.5 |
1.78 |
|
11. Tax gap in tax arrears, % to tax gap (2 / 9 x 100%) |
22.23 |
24.15 |
24.47 |
30.70 |
1.38 |
|
12. Tax gap in tax arrears, % to realized tax potential (2 / 7 x 100%) |
4.78 |
4.72 |
4.59 |
5.73 |
1.20 |
|
13. Tax gap in tax arrears, % to GRP (2 /10 x 100%) |
1.18 |
1.13 |
1.22 |
1.60 |
1.36 |
|
14. Potential for additional taxes and fees in the case of 100% coverage of taxpayers by audits, % to tax gap (5 / 9 x 100%) |
9.91 |
8.33 |
5.21 |
1.30 |
0.13 |
|
15. Potential for additional taxes and fees in the case of 100% coverage of taxpayers by audits, % to realized tax potential (5 / 7 x 100%) |
2.13 |
1.63 |
0.98 |
0.24 |
0.11 |
|
16. Potential for additional taxes and fees in the case of 100% coverage of taxpayers by audits, % to GRP (5 /10 x 100%) |
0.53 |
0.40 |
0.26 |
0.07 |
0.13 |
End of Table 1
Indicators 2011 2015 2016 2017 Growth rates, 2017 to 2011 17. Tax potential of non-observed economy, % to tax gap (8 / 9 х 100%) 67.86 67.52 70.32 68.00 1.00 18. Tax potential of non-observed economy, % to realized tax potential (8 / 7 х 100%) 14.6 13.2 13.2 12.7 0.87 19. Tax potential of non-observed economy, % to GRP (8 / 10х 100%) 3.60 3.15 3.51 3.53 0.98 20. Tax gap, % to realized tax potential (9 / 7 х 100%) 21.51 19.55 18.77 18.68 0.87 21. Tax gap, % to GRP (9 /10 х 100%) 5.30 4.67 4.99 5.20 0.98 Calculated by: Data on forms of statistical tax reports. Federal Tax Service of Russia. Available at: activities/statistics_and_analytics/forms/#t2 (accessed: November 30, 2019); Adjustment of gross value added of economic operations that are not observed by direct statistical methods. Federal Tax Service of Russia. Available at: (accessed: November 30, 2019); Gross regional product by entities of the Russian Federation in 1998–2017. Federal State Statistic Service of the Russian Federation. Available at: (1).xls (accessed: November 30, 2019).
Based on conducted calculations, the third stage analyzes the dynamics and structure of the tax gap.
In general, the tax gap in the Yaroslavl Oblast increased from 15.2 to 26.5 billion rubles, i.e. by 11.3 billion rubles. Since the data are presented in nominal terms, it is necessary to consider relative indicators. The growth rate of the tax gap was 74.3% against the background of 77.9% GRP increase and a 101% increase of full realized potential, which indicates a positive trend of outpacing the growth rate of tax revenues and GRP over the growth rate of the tax gap. It is also confirmed by the continuing reduction of the tax gap from 5.3% to 5.2% of GRP or 21.51% to 18.68% of tax revenues to the consolidated budget of the Russian Federation from regional taxpayers. It is worth noting, however, that, in 2016 and 2017, the ratio of the tax gap to GRP increased from 4.67% to 5.2%.
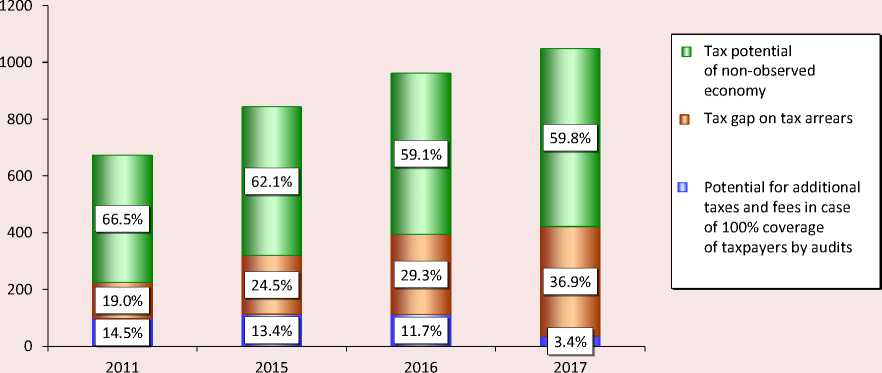
Figure 2. Structure and dynamics of factors forming the tax gap of the Yaroslavl Oblast in 2011, 2015–2017
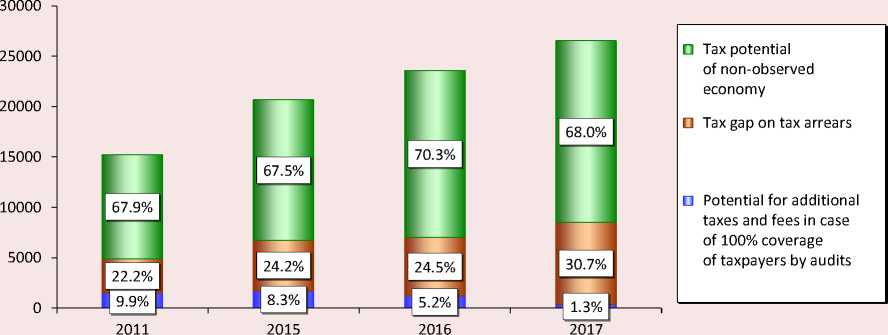
The ordinate axis shows the value of the tax gap in billion rubles, and % shows the share of factors in the tax gap.
Source: own compilation according to data in Table 1.
For each of three components of the tax gap, as well as for the final result, it is possible to calculate the ratio with the realized full tax potential of a region, which is the sum of tax revenues of budgets of all levels of the budget system from reginal taxpayers, and the GRP. The structure and dynamics of tax gap factors in the Yaroslavl region in 2011, 2015–2017 are presented in Figure 2 .
The growth of the tax gap of the Yaroslavl Oblast is caused by the dynamics of the tax potential of the non-observed economy and the gap of tax arrears. In the studied period, the combined share of these factors in the tax gap increased from 90.1% to 98.7%. At the same time, the share of the tax potential of the shadow economy remains stable in the range of 67.5–70.3%, and, in absolute terms, the increase was 7.3 billion rubles (from 10.3 to 18 billion rubles) despite the decrease of the share of the non-observed economy in GRP. The tax gap in tax arrears has increased significantly from 22.2% to 30.7%, or by 4.7 billion rubles. (from 3.4 to 8.1 billion rubles). At the same time, the potential for additional taxes and fees in case of 100% coverage of
Figure 3. The ratio of factors, forming the tax gap, to the GRP of the Yaroslavl Oblast in 2011, 2015-2017, %
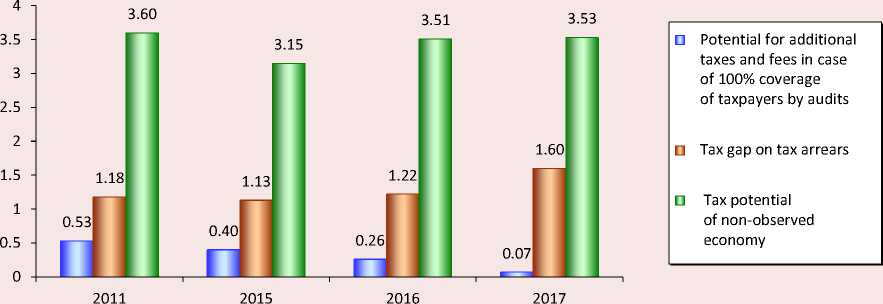
Source: own compilation according to data in Table 1.
Figure 4. The ratio of factors, forming the tax gap, to the fully realized tax potential of the Yaroslavl Oblast in 2011, 2015-2017, %
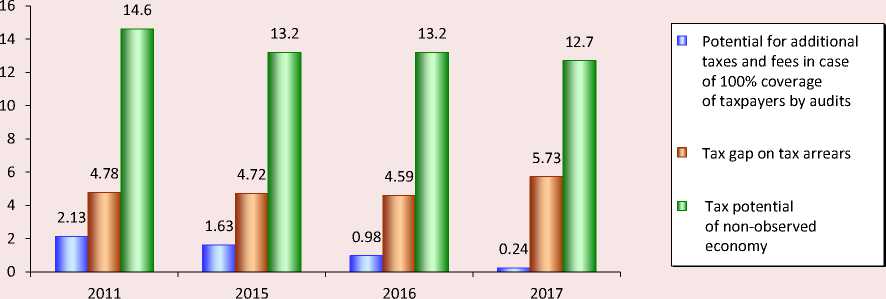
Source: own compilation according to data in Table 1.
taxpayers by tax audits has decreased from 1.5 to 0.3 billion rubles, and, currently, it does not actually affect the formation of the tax gap. This dynamic is caused by the work of FTS RF to improve tax control. The coverage of taxpayers by tax audits increases with the decrease of the number of on-site inspections, and the volume of predicative analytical procedures of tax authorities also increases.
The correlation of the Yaroslavl Oblast’s tax gap factors with the GRP and fully realized tax potential is shown in Figures 3 and 4 , where the ratio in a percentage is deferred along the ordinate axis.
The ratio of tax gap factors and GRP indicates the reduction of the potential for additional taxes and fees based on the results of tax audits and the increase of the tax gap for tax arrears in the Yaroslavl Oblast. The tax gap in 2017, in comparison to 2011, decreased in relation to GRP and tax revenues. For tax authorities, prospects for reducing the tax gap nowadays are not related to tax control but to the sphere of working with tax arrears, which forms about 30.7% of the tax gap. The key area of reducing the tax gap is the work on legalizing the shadow economy, which, even according to official statistics, reduces slowly. It requires the implementation of state measures. The analysis of tax gap factors was conducted for each region separately, for federal districts, and for the Russian Federation as a whole. For CFD, the results are shown in Figure 5.
In general, the dynamics and structure of tax gap factors in CFD are similar to those in the Yaroslavl Oblast. The difference is a more significant, almost twofold increase of the share of the tax gap for tax arrears; the share of the tax gap for the shadow economy in CFD is lower by 8.2 percentage points (59.8% vs. 68% in the Yaroslavl Oblast). It is characterized by a higher quality of work of tax authorities of the Yaroslavl Oblast with debt and a more positive level of solvency of taxpayers in comparison with CFD as a whole.
Figure 5. Structure and dynamics of factors forming the tax gap of the Central Federal District in 2011, 2015–2017
The ordinate axis shows the value of the tax gap in billion rubles, and % shows the share of factors in the tax gap. Source: own calculation according to FTS RF and FSSS RF.
Table 2. Dynamics of the tax gap in federal districts of the Russian Federation in 2011, 2015–2017
|
Federal districts |
Tax gap, billion rub. |
Tax gap, % to fully realized tax potential |
Tax gap, % to GRP |
|||
|
2011 |
2015 |
2016 |
2017 |
2017 |
2017 |
|
|
Central |
673.30 |
843.30 |
962.03 |
1 047.93 |
21.25 |
4.01 |
|
Norhwestern |
184.44 |
268.04 |
306.24 |
316.24 |
15.20 |
3.86 |
|
North Caucasian |
89.92 |
114.15 |
122.58 |
73.60 |
38.95 |
3.95 |
|
Southern |
99.15 |
149.12 |
164.58 |
155.46 |
16.76 |
2.90 |
|
Volga (Privolzhsky) |
294.41 |
392.56 |
417.42 |
453.39 |
16.13 |
4.11 |
|
Ural |
398.94 |
513.11 |
479.39 |
583.95 |
14.12 |
5.47 |
|
Siberian |
191.02 |
238.09 |
251.20 |
271.54 |
16.51 |
3.50 |
|
Far Eastern |
84.29 |
128.00 |
129.28 |
111.07 |
17.80 |
2.86 |
|
RF |
2 026.92 |
2 678.34 |
2 858.65 |
3 028.37 |
17.46 |
4.04 |
For reference: data for по SFD in 2015 were given taking into account CFD affiliated with SFD since 2016.
Source: own compilation according to FTS RF and FSSS RF.
Summary data on the dynamics of the tax gap for the Russian Federation and federal districts are shown in Table 2.
In Russia, the tax gap in 2011–2017 increased in nominal prices by 1.5 times: from 2 to 3 trillion rubles. In relation to tax revenues of the consolidated budget of the Russian Federation, the tax gap decreased from 20.9% to 17.5%, or by 3.4 percentage points, as did the ratio of the tax gap to GDP from 4.5% to 4%. In general, this is a positive trend, indicating a faster growth rate of tax revenues and GRP in relation to the tax gap. For comparison, we would like to note that, in the United Kingdom, the tax administration estimates the gap at 5.6% of tax revenues [6]; in EU countries, researchers estimate up to an average of 10.7% of GDP (1.6–13.8%) [16, p. 67]. However, it needs to be considered that this difference in levels is caused not only by the difference of the gap but the difference between methods of its calculation, primarily due to the difference estimates of the shadow economy.
In absolute terms, there was also the increase of the tax gap in federal districts with the exception of the North Caucasian Federal District, where, in 2017, it decreased by 40%, or 49 billion rubles, while its ratio to the realized tax potential remains the highest in the country (39%) with an average level in relation to GRP. The general reason for this situation is the low level of tax potential implementation and the low tax burden in regions of the NCFD. The minimum level of the tax gap in relation to GRP is observed in SFD and FEFD. The dynamics of the ratio of the tax gap with studied indicators is shown in Figure 6.
For the entire studied period, the maximum tax gap in relative terms was formed in the NCFD. The relative size of the tax gap reduced in all federal districts. Let us review the ratio of the structure of the tax gap of federal districts in Figure 7 , where the share of each factor in the tax gap is represented.
In all federal districts, there was the reduction of the share of the potential for additional taxes and fees in case of 100% coverage of taxpayers by inspections, which confirms the improvement of the quality of tax authorities’ control activities. The highest share remains in NCFD – 17.6%, and the lowest – 1.4% – in UFD. The share of the non-observed economy in the tax gap (68%) remains high: its increase was noticed in NWFD, NCFD, SFD, and SFD (Southern). The maximum share of the non-observed economy in the tax gap is in UFD – 90% in 2017. It shows that the potential of reducing the tax gap at the expense of work
Figure 6. Dynamics of the ratio of the tax gap with the full realized tax potential and the GRP of federal districts in 2011, 2015–2017, %
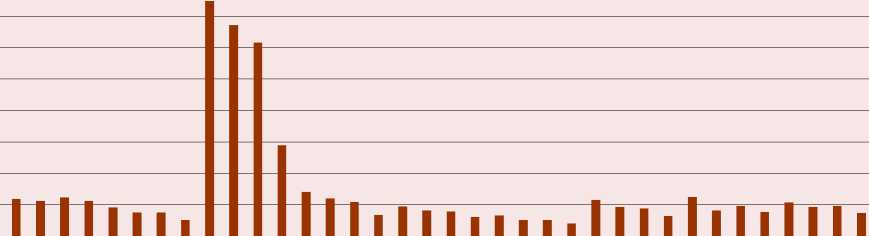
MFFFFFrrrFFFFFFFFFFFFFFFFFFFFFFFFF

CFD NWFD NCFD SFD PFD UFD SFD FEFD RF
-
■ Tax gap, % to GRP
-
■ Tax gap, % of fully realized tax potential
Source: own calculation according to FTS RF and FSSS RF.
Figure 7. Structure of tax gap of federal districts in 2011, 2015–2017, %
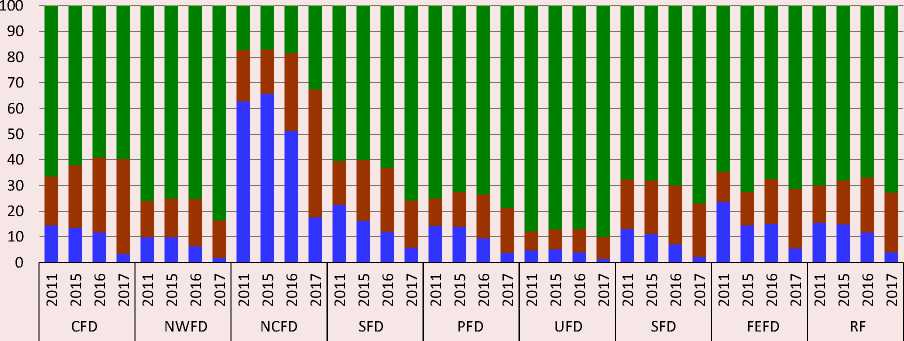
■ Tax potential of the non-observed economy
■ Tax gap on tax arrears
■ Potential for additional taxes and fees in case of 100% coverage of taxpayers by audits
Source: own calculation according to FTS RF and FSSS RF.
of tax authorities is greatly implemented. The share of the tax gap on tax arrears also increased by 8.5 p. p.: from 22.2 to 30.7%. Its largest growth was recorded in CFD, NCFD where it is the highest in the country – 49.8%, as well as in FEFD. The share of the tax gap on tax arrears remains low and minimal in UFD – 8.6% in 2017.
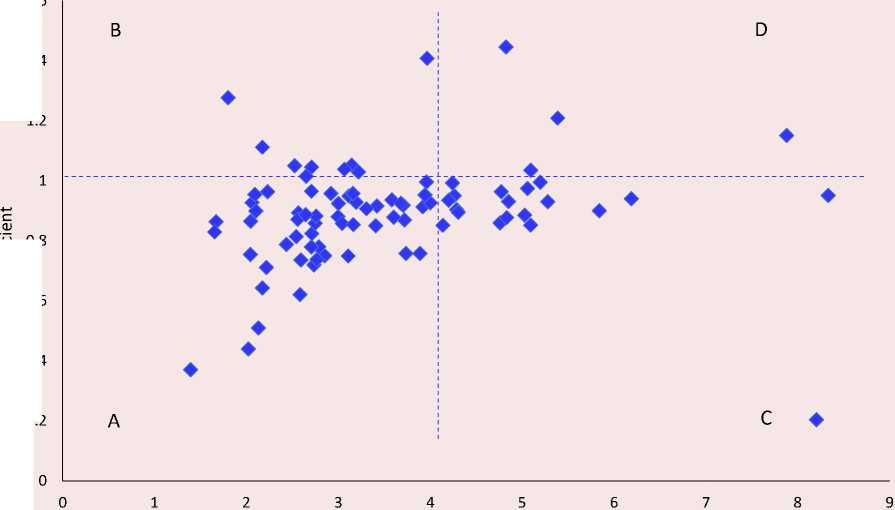
The assessment of the tax gap at the regional level assumes the possibility of grouping regions by the level of the tax gap considering the tendency to reduce or, on the contrary, increase it. This classification may be based on the ratio of the level of the tax gap to the GRP and the coefficient of advance of the growth rate of the tax gap in relation to the growth rate of the realized tax potential.
The growth rate may be calculated in comparison with previous year or for a certain period. According to the first indicator – the level of the tax gap to the GRP – the division is relative to its average value for the country, for example, above average and below average. At the same time, it is possible to choose the division into a different number of groups with defined distribution boundaries. According to the second indicator – coefficient of the advance of the tax gap growth in relation to the growth rate of the realized tax potential – classification is conducted in relation to 1. It means that regions with the faster growth of tax capacity, or decreasing gap, and regions with growing tax gap are defined. Thus, there are 4 groups of regions:
-
A: with a low level of the tax gap and a tendency to its further reduction,
-
B: with a low level of the tax gap and a tendency to its further increase,
Figure 8. Grouping of federal entities by the level and dynamics of the tax gap in 2017
1.6
1.4
0.6
0.4
0.2
1.2
0.8
о
Ratio of the tax gap to GRP,%
Source: own calculation according to FTS RF and FSSS RF.
-
С: with a high level of the tax gap and a tendency to its further reduction;
-
D: with a high level of the tax gap and a tendency to its further increase.
Let us review the distribution of Russian regions in 2017 (coefficient of advance of the growth rate of the tax gap in relation to the growth rate of the realized tax potential in 2017 in relation to 2016, Fig. 8 ).
Most regions of the Russian Federation (52) in 2017 were placed in group A. The distribution of regions is given in Table 3 .
Presented classification of regions allows us to draw conclusions about the quality of work of regional tax and financial authorities to reduce the tax gap based on the ratio of its level and dynamics. This ratio, taking into account the factor analysis of the tax gap, also allows proposing recommendations for reducing the tax gap in regions by working with one or another factor that forms it. To decrease the non-observable economy in the shadow sector, it is advisable, for example, to reduce cash payments, in the informal sector – an experiment with the introduction of a tax on professional income for self-employed citizens opens up some opportunities. The reduction of the tax gap on tax arrears requires the improvement of work of tax authorities, in particular, on debt restructuring and guarantee provision of arrears, interaction with credit organizations, sale of debtors’ property, etc. The improvement of the quality of tax authorities’ control work to reduce the tax gap in a corresponding part is possible through further development of centralized approaches to tax audits and the development of a tax monitoring online system for major taxpayers with tax authorities’ access to tax and accounting records of a taxpayer within Section V. 2 of Part 1 of the Tax Code of the Russian Federation.
Table 3. Grouping of federal entities by the level and dynamics of the tax gap in 2017
|
Advance coefficient of the tax gap’s growth rate to the growth rate of the fully realized tax potential of the region |
Ratio of the tax gap to GRP, % |
|
|
Below average (<4.042%) |
Above average (>4.042%) |
|
|
Advance growth of the tax gap in relation to realized tax potential (>1) |
B: Regions with a low level of the tax gap but with a tendency to its increase 9 regions |
D: Regions with a high level of the tax gap which continues to increase 4 regions |
|
Republic of Dagestan, Chechnya, Buryatia, Khakassia, Zabaykalsky Krai and Primorsky Krai, Amur, Magadan oblasts, Sevastopol |
Smolensk, Omsk oblasts, Republic of Ingushetia and Karachay-Cherkess Republic |
|
|
Advance growth of the tax gap in relation to the tax gap (>1) |
A: Regions with a low level of the tax gap and a tendency to its further reduction 52 regions |
C: Regions with a high level of the tax gap and a tendency to its further reduction 19 regions |
|
Belgorod, Bryansk, Vladimir, Voronezh, Ivanovo, Kaluga, Kostroma, Kursk, Lipetsk, Oryol, Tambov, Tver, Tula, Arkhangelsk, Vologda, Murmansk, Novgorod, Pskov, Volgograd, Kirov, Nizhegorod, Penza, Ulyanovsk, Kurgan, Sverdlovsk, Rostov, Tumen, Chelyabinsk, Kemerovo, Novosibirsk, Sakhalin oblasts, Jewish Autonomous Oblast, Republic of Karelia, Komi, Adygea, Kalmykia, Crimea, Bashkortostan, Mari El, Mordovia, Tatarstan, Chuvashia, Altai, Tuva, Sakha (Yakutia), Altai, Stavropol, Krasnodar, Krasnoyarsk, Kamchatka, Khabarovsk krai, Chukotka AO |
Moscow, Ryazan, Yaroslavl, Kaliningrad, Leningrad, Astrakhan, Orenburg, Samara, Saratov, Irkutsk, Tomsk oblasts, Republic of North Ossetia – Alania, Kabardino-Balkaria, Udmurtia, Perm Krai, Moscow, Saint-Petersburg, Khanty-Mansi AO – Yugra, Yamalo-Nenets AO |
|
|
Source: own calculation according to FTS RF and FSSS RF. |
||
Conclusions and discussion of results
Within the study of the tax gap at the regional level in the Russian Federation and the assessment of factors that form it, the following conclusions were obtained.
-
1. It is defined that approaches to determining the tax gap by domestic and foreign researchers are largely similar. In general, the tax gap may be defined as the difference between actual tax revenues and estimated ones that could be added to the budget, if all taxpayers complied with the legislation. In other words, as the difference between actual tax revenues and tax potential.
-
2. It is proved that the tax gap is defined by the impact of the scale of the shadow economy, corruption, tax evasion, the quality of tax administration, and other factors. Identification of the list of these factors may depend on research objectives. The issue of accounting the loss of tax revenues due to tax benefits, or so-called tax expenditures, as a factor of the tax gap is debatable. Since 2016, official registers of state tax expenditures have been maintained, including regional ones11. At the same time, tax benefits form not the tax gap but the difference between the nominal tax potential and the tax limit (Fig. 1), since these are legitimate elements of reducing the tax burden for certain categories of taxpayers, so it seems that it is incorrect to include tax benefits in the tax gap.
-
3. The author’s method of the analysis of the structure and dynamics of the tax gap at the regional level, which allows, unlike existing ones, assessing the scope and the structure of the tax gap of a region in absolute and relative terms and giving opportunities for comparative
-
11 Register of tax benefits (tax expenditures) established by laws of entities of the Russian Federation for 2016–2017 with an estimate for the forecast period until 2021. Ministry of Finance of the Russian Federation. Available at: https:// www.minfin.ru/ru/perfomance/budget/policy/# (accessed: November 30, 2019).
-
4. As of January 1, 2018, the tax gap in the Russian Federation was 3.03 trillion rubles. From 2011 to 2017, the tax gap, in relation to tax revenues of the consolidated budget of the Russian Federation, decreased from 20.9% to 17.5% or by 3.4 percentage points, as did the ratio of the tax gap to GDP – from 4.5% to 4%. Despite the positive dynamics, the tax gap of 3.03 trillion rubles, or 4% of GDP, or 17.5% of tax revenues of the consolidated budget, is a significant indicator in terms of opportunities to increase budget revenues and reduce public arrears and, accordingly, the growth of public investment and social spending. The relative size of the tax gap has been reduced in all federal districts. The reduction of the share of additional tax and fee potential in case of 100% coverage of taxpayers by audits was also noted, which confirms the improvement of the quality of control activities of tax authorities. The share of the non-observed economy in the tax gap remains consistently high (68%). The share of the tax gap on tax arrears has also increased from 22.2% to 30.7%.
-
5. The author’s version of the grouping of federal entities in relation to the state and prospects of reducing the tax gap, which is based on the ratio of its level and dynamics, is proposed. This grouping of regions allows us to draw conclusions about the quality of work of regional tax and financial authorities and form recommendations for reducing the tax gap due to the work of a specific factor that forms it. For example, reducing cash payments, improving
assessment of regions on the tax gap and its defining factors, is presented. The usage of the author’s proposed allows drawing conclusions about the quality of work of tax and financial authorities in a region with debt and tax control and administration, as well as identifying and analyzing prospects and reserves for reducing the tax gap.
the work of tax authorities on restructuring and guaranteeing tax arrears, interacting with credit organizations, selling debtors’ property, developing centralized approaches to tax audits, and developing a tax monitoring system for major taxpayers.
The conducted research suggests that the potential for reducing the tax gap in Russia at the expense of improving the quality of tax authorities’ control work has been largely implemented. Work with tax arrears provides opportunities for financial and tax authorities. In general, the shadow economy has the largest share in the tax gap – up to 68%. This share is defined according to official statistical data (12–15%). If alternative estimates, which reach 23–44%, would have been used [3, p.9], then the indicator would be significantly higher in absolute and relative terms. It confirms the importance of activating comprehensive work of state bodies to legalize the shadow economy.
References Regional tax gap and assessment of its determining factors
- Voroshilov N.V., Gubanova E.S. Territorial differentiation and mechanism for its reduction. Ekonomicheskie i sotsial’nye peremeny: fakty, tendentsii, prognoz=Economic and Social Changes: Facts, Trends, Forecast, 2018, vol. 11, no. 6, pp. 57–72. DOI: 10.15838/esc.2018.6.60.4. (in Russian)
- Podviezko A., Parfenova L., Pugachev A. Tax competitiveness of the new EU member states. Journal of Risk and Financial Management, 2019, no. 12 (1), 34, pp. 1–19. DOI:10.3390/jrfm12010034.
- Avdiyskiy V.I., Bezdenezhnykh V.M. The structure of financial flows in the shadow economy and methods of their assessment. Ekonomika. Nalogi. Pravo=Economics, Taxes & Law, 2018, no. 11(5), pp. 6–15. DOI: 10.26794/1999-849X-2018-11-5-6-15. (in Russian)
- Rotz W., Murlow J., Falk E. The 1995 Taxpayer compliance measurement program (TCMP). Sample redesign: A case history. In: Turning Administrative System into Information System. Internal Revenue Service, Washington, 1994. Pp. 121–126.
- Mironova O.A., Hanafeev F.F. Tax gap: Problems of definition and regulation. Voprosy regional’noi ekonomiki=Voprosy regionalnoj ekonomiki, 2016, no. 2 (27), pp. 112–115. (in Russian)
- Shakirova D.Yu., Zas’ko V.N. The tax gap: Peculiarities of defining and world experience. Rossiiskoe predprinimatel’stvo=Russian Journal of Entrepreneurship, 2014, vol. 15, no. 18, pp. 163–170. (in Russian)
- Raczkowski K., Mro’z B. Tax gap in the global economy. Journal of Money Laundering Control, 2018, no. 21(4), pp. 545–554. DOI: 10.1108/JMLC-12-2017-0072.
- The concept of tax gaps. Report II: Corporate income tax gap estimation methodologies. In: Taxation Papers. Working Paper №73 – 2018. Fiscalis Tax Gap Project Group (FPG/041). Brussels, July 2018. 112 p.
- Kosova T., Slobodyanyuk N., Polzikova H., Šatanová A. Тax gap management: Theory and practice. Економiчний часопис-XXI, 2018, no. 11-12 (174), pp. 22–28. DOI: https://doi.org/10.21003/ea.V174-04.
- Laffer A., Seymour J. The Economics of the Tax Revolt. Harcourt Brace Jovanovich, 1979. 138 p.
- Alfirman L. Estimating stochastic frontier tax potential: Can Indonesian local governments increase tax revenues under decentralization. In: Center for Economic Analysis Working Paper, 2003, no. 03-19. 37 p.
- Bird R.M., Martinez-Vazquez J., Torgler B. Societal Institutions and Tax Effort in Developing Countries. Toronto, University of Toronto, 2004. 195 p.
- Filippovich E.S. Shklyarova M.A., Kosach O.F., Naumchik S.O. Effektivnost’ deyatel’nosti nalogovykh organov: otsenka i rezervy povysheniya [Efficiency of Tax Authorities Activity: Assessment and Reserves for Improvement]. Ed. by E.S. Filippovich. Minsk: BGATU, 2017. 256 p.
- Murphy R. The Tax Gap, Tax Evasion in 2014 – and What Can be Done about it. Public and Commercial Services Union, London, September, 2014. Available at: http://openaccess.city.ac.uk/id/eprint/16565/1/PCSTaxGap2014Full.pdf (accessed: 30.11.2019).
- Raczkowski K. Measuring the tax gap in the European economy. Journal of Economics and Management, 2015, no. 21 (3), pp. 58–72.
- Roshchupkina, V.V. The tax burden index as an indicator of the effectiveness of fiscul measures taken by the government. Ekonomika. Nalogi. Pravo=Economics, Taxes & Law, 2016, no. 2, pp. 133–141. (in Russian)
- Suslina, A.L., Leukhin, R.S. Shadow economy fight in Russia: Some aspects of common problems. Finansovyi zhurnal=Financial Journal, 2016, no. 6, pp. 46–61. (in Russian)
- Fedotov, D.Yu., Nevzorova, E.N., Orlova, E.N. A tax method to calculate the value of the shadow economy of Russian regions. Regional’naya ekonomika: teoriya i praktika=Regional Economics: Theory and Practice, 2017, vol. 15 no. 11, pp. 2015–2032. (in Russian)
- Povarova, A.I. Problems related to regional budgeting amid fiscal consolidation. Ekonomicheskie i sotsial’nye peremeny: fakty, tendentsii, prognoz=Economic and Social Changes: Facts, Trends, Forecast, 2018, vol. 11, no. 2, pp. 100–116. DOI: 10.15838/esc.2018.2.56.7. (in Russian)
