Relationships between chlorophyll potential of wheat crops and leaf area index of the plants based on reflectance spectra obtained by ground-based remote measurements

Author: Sidko Alexander F., Pisman Tamara I., Botvich Irina Yu., Shevyrnogov Anatoly P.
Journal: Журнал Сибирского федерального университета. Серия: Техника и технологии @technologies-sfu
Article in issue: 8 т.8, 2015.
Free access
The purpose of this study was a comparative study of seasonal dynamics of chlorophyll potential, leaf area index and fresh biomass of different varieties of wheat based on refl ectance spectra obtained by ground-based remote measurements. The study reports data on seasonal dynamics of refl ectance of wheat canopies composed of various wheat cultivars in the Krasnoyarskii Krai. The study presents an optical remote method for determining chlorophyll potential, S(t), of wheat plants, which is calculated based on reflectance spectra of the crops during the growing season. Chlorophyll potential of wheat plants, S(t), may serve as an indicator of their physiological state and potential biological productivity; also, it can be used to predict grain yield of wheat fields. Different wheat cultivars have different chlorophyll potentials, S(t), during the growing season. There is high positive correlation between dry and fresh wheat biomass, and chlorophyll potential, S(t), of wheat plants. A digital database has been compiled, which contains spectral data of the wheat canopies studied.
Chlorophyll potential, leaf area index, wheat
Short address: https://sciup.org/146115033
IDR: 146115033 | UDC: 528. | DOI: 10.17516/1999-494X-2015-8-8-1096-1102
Связь хлорофилльного потенциала посева пшеницы и листового индекса при наземном дистанционном зондировании
Целью данного исследования является сравнительное изучение сезонной динамики хлорофилльного потенциала, индекса листовой поверхности и свежей биомассы различных сортов пшеницы на основе спектров отражения, полученных с помощью наземных дистанционных измерений на территории Красноярского края. Исследование представляет собой оптический дистанционный способ определения хлорофилльного потенциала, S (t), из растений пшеницы, который рассчитывается на основе спектров отражения культур в период вегетации. Хлорофилльный потенциал растений пшеницы, S (t), может служить индикатором их физиологического состояния и биологической продуктивности. Различные сорта пшеницы имеют различные хлорофилльные потенциалы в течение вегетационного сезона. Существует положительная корреляция между сухой и свежей биомассой пшеницы и хлорофилльным потенциалом. Была составлена цифровая база данных, которая содержит спектральные показатели изученных посевов пшеницы.
Text of the scientific article Relationships between chlorophyll potential of wheat crops and leaf area index of the plants based on reflectance spectra obtained by ground-based remote measurements
The use of the reflectance factor, ρλ of leaves at different wavelengths may be insufficient for accurate evaluation of certain physiological parameters of plants [11]. Thus, new remote sensing techniques need to be developed to obtain more data on the physiological state of the plants. Their development is, however, hindered by the lack of experimental data collected in the field throughout the growing season.
The purpose of this study was a comparative study of seasonal dynamics of chlorophyll potential, leaf area index and fresh biomass of different varieties of wheat based on reflectance spectra obtained by ground-based remote measurements.
Material and methods
The method of determining chlorophyll potential is based on the analysis of field studies of wheat crop reflectance that have been regularly conducted for many years, by using remote sensing techniques. Field studies were performed on test plots situated in the KrasnoyarskiiKrai, during the growing season. Wheat ( Triticum acstivum L.) cultivars Skala, Ravnina, Saratovskaya, etc. were used as model crops. The areas of the test plots were 200 m2 (4 x 50) and 600 m2 (10 x 60). The photometered area varied between 0.5 and 2 m2; generally, nadir measurements were taken. The plots were located rather close to each other, i.e. in the same climatic conditions [12].
Reflectance spectra of wheat canopies were recorded from the elevated work platform at heights of 2 to 18 m under sunny conditions, using a PDSP double-beam spectrophotometer [13] (Sid’ko et al., 2000). It recorded the differential reflectance factor of the object studied and the reference surface. The scanning rate in the spectral range from 400 to 850 nm was 60 s [14].
The reflectance factor of the study object (surface), ρ λ ( ϑ , ϕ ) is defined as the ratio of the brightness of the study surface, Bλ( ϑ , ϕ ) to the brightness of the etalon, B0( ϑ , ϕ ).
ρ λ ( ϑ , ϕ ) = B λ ( ϑ , ϕ )/B 0 ( ϑ , ϕ ), (1)
where ( ϑ , ϕ ) are the polar and azimuth angles, respectively [15] (Sid`ko et al., 2013).
From the values of the reflectance factor, ρ λ calculated chlorophyll potential – parameter S. Parameter S is chlorophyll potential, determined by the amount of light in the 550-730 nm range absorbed by plants in certain periods of the growing season. Parameter S is the best indicator of the interrelationship between reflectance factor and physiological and biometric parameters of the plants. Parameter S is determined from the following equation:
S = 90 ⋅ ( ρ 730 ( t ) + ρ 550 ( t ) ) - 7 ∫ 30 ρ ( λ , t ) d λ (2)
where 90 is the multiplier equal to the half-width of the chlorophyll absorption band between 550 and 730 nm, ρ 550 and ρ 730 are average values of the reflectance factor of the wheat canopy at λ = 550 nm and λ = 730 nm, and t and t0 are boundaries of the time interval of summing S (t) for a certain period of time [10]). The method of recording was described in detail elsewhere [15].
In addition to recording of the reflectance factors (ρλ) of the wheat fields, we determined dry and fresh biomass of the plants, leaf area index (LAI), and projective cover (B). The dry and fresh biomass of wheat plants was determined gravimetrically: we cut off the aboveground parts of the plants growing on the plot of an area between 0.25 and 2 m2, weighed them and dried in a drying – 1098 – cabinet at a temperature of 100-102 °C. Wheat productivity on the reference and experimental plots was evaluated by batch measurement, by weighing the grain collected by the Sampo – 1200 selection combine with grasp width of 1 m, and by weighing grainsmanually picked from 2 m2 plots. The relative error of determination of the production was 5 %.
Leaf area index –LAI (m2/ m2), or relative surface area of a plant canopy, is defined as the total one-sided leaf area per unit ground surface area:
LAI = k∙l∙d∙ N,
Where l is leaf length, d is width of the broadest part of the leaf, k is coefficient of proportionality determined experimentally for leaves of a given species, N is the number of leaves per unit area of ground.
Projective cover, B , or leaf area density, LAD is defined as the ground area covered by plants when viewed vertically downward (nadir-viewed), which is essentially determined by the leaf area index of plants and inclination angles of plant parts. In the general case, B is determined as spaces between plants per unit area of ground:
B = 1 - e H" D ) - ( G /cos ( j )) L
where L =( LAI ), D is relative variance—the parameter characterizing the type of spatial arrangement of plant parts; j is viewing angle; G is distribution function of inclination angles of plant parts. The projective cover was determined experimentally and varied from 0.3 to 1 during the plant growing season.
-
3. Results and discussion
Calculation of chlorophyll potential, S(t) based on the curves of reflectance spectra for the wheat cultivars studied during the growing season showed clear cultivar-related differences (Fig. 1). The highest S(t) was obtained for wheat cv. “Saratovskaya” – a dark-green cultivar, and the lowest – for “Skala” – a light-green cultivar. Analysis of chlorophyll potential, S(t) of wheat canopies showed that
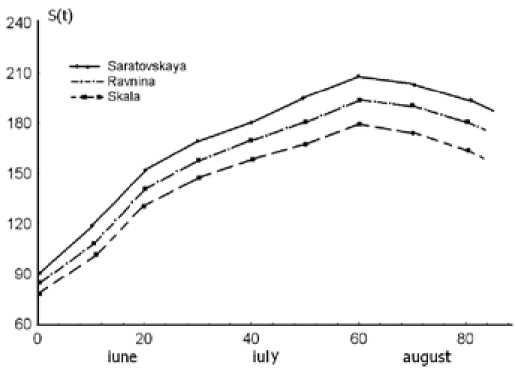
Fig. 1. Chlorophyll potential, S(t) for different wheat cultivars. The starting point is 1 June
reflectance factors in the wavelength range between 550 and 730 nm demonstrate the most considerable variations throughout the growing season.
A study of the relationship between wheat biomass and chlorophyll potential showed that larger biomass corresponded to higher S(t) (Fig. 1). Results of field measurements of the biomass correlated with the evaluation of plant productivity based on S(t) [12]. The following productivities were obtained for different wheat cultivars: for Saratovskaya – 0.285 kg•m-2, for Ravnina – 0.249 kg•m-2, and for Skala – 0.229 kg•m-2.
At the same time, we determined leaf area index, LAI, for the wheat fields (Fig. 2). Dark-green broad-leaved cultivars (Ravnina, Saratovskaya) had the highest LAI – 5.0 – 6.0 m2/m2. For other wheat cultivar (Skala), LAI varied between 3 and 4.5 m2/m2. There were 370 – 460 shoots per m2. The number of leaf layers was no more than 5 or 6. The projective cover, B varied from 0.3 (shoot emergence) to 1 (tillering and leaf-tube formation), and in the latter stage, the magnitude of B no longer influenced the reflectance factor, ρ λ.
The table gives results of the analysis of the relationship between chlorophyll potential, S(t), dry and fresh biomass of wheat plants. Chlorophyll potential, S(t), had the correlation with dry and wheat biomass.
Dynamics of fresh biomass of different varieties of wheat during the growing season is shown in Fig. 3. There are clear differences in the accumulation of fresh biomass for different wheat cultivars.
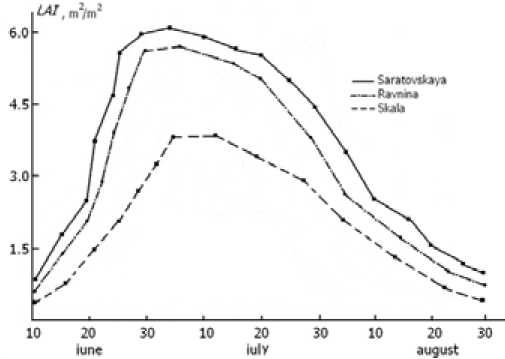
Fig. 2. Leaf area index, LAI for different wheat cultivars
Table. Correlation coefficient between chlorophyll potential, S(t) and dry biomass, M dry , and fresh biomass, M fresh , of wheat plants
|
Wheat cultivar |
M fresh |
M dry |
|
Skala |
0.861 |
0.81 |
|
Ravnina |
0.85 |
0.82 |
|
Saratovskaya |
0.815 |
0.795 |
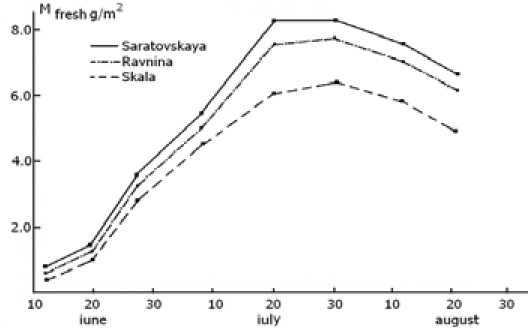
Fig. 3. Fresh biomass for different wheat cultivars
Dark-green broad-leaved cultivars (Ravnina, Saratovskaya) had the highest fresh biomass, about 7.0 – 8.0 g/m2, light-green cultivar (Skala) – about 6.0 g/m2.
Having summarized the wheat crop data accumulated over many years, such as the effects of soil treatment technologies employed before and during planting, amounts of fertilizers (N, K, P) added to the soil per m2 during the growing season, and the use of wheat cultivars with different maturation times and productivities, we correlated chlorophyll potential, ΣS(t), with the grain yield. Our results showed a high correlation between ΣS(t)and grain yield for different wheat cultivars and cultivation conditions.
-
4. Conclusion
The study of reflectance factors, ρ λ of different wheat canopies and simultaneous determination of their physiological parameters suggested a definite conclusion about the usefulness of remote sensing techniques to solve many practical issues. Among them are evaluation of the physiological state of farm crops and prediction of their biological productivity [16, 17]. Monitoring of changes in the reflectance factors of wheat canopies during the growing season showed their high information value in the red side of chlorophyll absorption band, which may be used as a clue to decode aerospace multispectral images and evaluate grain yield of wheat fields [18].
-
1. Chlorophyll potential of wheat plants, S (t), may be used as an indicator of their physiological state and potential biological productivity.
-
2. Chlorophyll potential, S(t), is different for different wheat cultivars during the growing season.
-
3. There is positive correlation between dry and fresh wheat biomass and chlorophyll potential, S(t), for different wheat cultivars.
References Relationships between chlorophyll potential of wheat crops and leaf area index of the plants based on reflectance spectra obtained by ground-based remote measurements
- Breda N. J. Journal of Experimental Botany, 2003, 54, 2403-2417.
- Soltani A., Galeshi S. Field Crops Res., 2002, 77, 17-30.
- Broge N. H., Leblanc E. Remote Sensing of Environment, 2000, 76, 156-172.
- Chen J.M., Pavlic G., Brown L., Cihlar J.et al. Remote Sens. Environ., 2002, 8, 165-184.
- Sims D. A., Gamon J. A. Remote Sensing of Environment, 2002, 81, 337-354.
- Zhang X. H., Tian Q. J., Shen R. P. Spectroscopy and Spectral Analysis, 2010, 30(6), 16001605.
- Jorgensen R. N., Hansen P. M., Bro R. Int. J. Remote Sensing, 2006, 27(5), 919-937.
- Sid’ko A. F., Pugacheva I. Yu., Shevyrnogov A. P. Dokl. Akad. Nauk, 2008, 419(3), 417-420.
- Sid`ko A. F., Pugacheva I. Yu., Shevyrnogov A. P. Issledovaniye Zemli iz kosmosa, 2009, 4, 64-70.
- Pugacheva I. Yu., Sid’ko A. F., Shevyrnogov A. P. Adv. Space Res., 2010, 45, 1224-1230.
- Andrianova Y.E., Tarchevsky I.A. Khlorofill I produktivnostrasteniy. Moscow, Nauka, 2000.
- Botvich I. Yu., Sid`ko A.F., Pisman T.I., Shevyrnogov A.P. J. Sib. Fed. Univ. Eng. technol., 2012, 5(5), 87-97.
- Sid’ko A. F., Shevyrnogov A. P. Earth. Obs. Rem. Sens., 2000, 16, 487-500.
- Sid`ko A. F., Filimonov V. C., Sid`ko F. Ya. Zhrn. Prikl. Spektroskopii, 1978, 29(5), 943-948.
- Sid`ko A. F., Botvich I.Yu., Pisman T.I., Shevyrnogov A. P. Journal of Quantitative Spectroscopy and Radiative Transfer, 2013, 129, 109-117.
- Shapira H. U., Karnieli K. A,. Bonfil D. J. Precision Agric., 2013, 14, 637-659.
- Wilson J. H., Chunhua Zhang C., and Kovacs J.M. Remote Sens., 2014, 6, 925-945.
- Shibayama M., Sakamoto T., Kimura A. International Journal of Remote Sensing, 2011, 32, 3589-3609.
