Reliability of Software Correlated Components Failure in Pakistan Industry

Author: Darakshan Anjum, Tasleem Mustafa
Journal: International Journal of Information Engineering and Electronic Business(IJIEEB) @ijieeb
Article in issue: 2 vol.9, 2017.
Free access
Now-a-days most important issue of software engineering in Pakistan industry is the correlated component failure, such failure occur when on component of the software is fail to work according to the specification and other related module to the specific component is also fail to perform the work. Due to this reason whole system destruction is possible as well as software development time and cost may be increased. The purpose of the study is to analyze the probability of software correlated component failure before the implementation and also analyze the main factor that cause of software correlated failure in Pakistan industry. Data is collected from software houses by using the data gathering techniques such as survey and interviews. After doing statistical analysis by using bar chart conclude that in Pakistan industry main reason of software failure is error in software resource analysis in addition to faults in testing of the software. To overcome these issues in future it's important to improve the testing phase of the software development process and during development of the software better techniques used for the resource allocation process.
Correlated Failure, software reliability Software testing, Error in software development phase, requirement gathering
Short address: https://sciup.org/15013501
IDR: 15013501
Text of the scientific article Reliability of Software Correlated Components Failure in Pakistan Industry
Published Online March 2017 in MECS
-
I. Introduction
With the passage of time size and complexity of software is increasing in past many decades. Due to the complexity of the software it is required to analyze to which extend software is reliable before implementation. There is inverse relationship between software reliability and fault or failure. If the numbers of faults increase then the software quality decreases. So estimate the quality of the software, it needs to check how much software is reliable (Jatain and Yukti, 2014).
Software is key feature of number of devices which are used in the world so for this perspective it’s important to estimate the quality of the software, and it also assure that high quality software is produced if software testing is perform in better manner. As the software quality perspective testing of the product play an important role, it analysis that quality of the software is different for different product and customer perspective. Discuss the different quality aspects are bellow (Ammann and Offutt, 2011).
There are number of reasons for the failure of software but the most common is the correlated component failure, observations concluded that single module failure causes the failure of other multiple module related to the previous module of the software. This type of related fault and failure are due to number of reasons such as requirements fault, coding fault, and data gathering problems (Hamill and Goseva-Popstojnova, 2009).
Our descendants not pay attention on the correlated component failure of the software because at that time software were not complex enough. Now-a-days as the software complexity is increase, correlated component failure creates problems, when the fault or failure is detected at the later stages or after the implementation phase then the development time and cost will increase. To overcome this problem, analyze the probability of correlated component failure. By studying the number of case studies, it is concluded that component failure is statistically co-related (Fiondella and Panlop, 2014).
Estimating the correlated component reliability is a useful technique but sometimes it may be difficult to analyze the probability of component failure. Different reliability growth models are used to estimate the software correlated component reliability. Through analyzing the reliability of correlated component achieving a failure-free and reliable software (Ikemoto et al. , 2013).In embedded system, software play an important role for the hardware so the failure of software cause the failure of hardware that's why in embedded systems correlated component failure cause the failure of the whole system. However many researchers concluded that mostly software failure is due to the co-related component failure (Park et al., 2012).
Software is also very important in different fields such as e-commerce, medical devices, industrial and mobile applications in which the failure of software component may cause the serious financial losses, death or the claps of whole application. so required to develop a system which is reliable while different components are integrated(Brosch et al .,2012).
Successful execution of correlated component depends on the type of operation which are perform and also based on the extent that how much internal state of the software is effected (Dai at el ., 2005).The purpose of the study is to enhance the knowledge about the software correlated component failure in Pakistan industry and purpose a method through which estimate the related component reliability before the implementation phase.
-
II. Problem Statement
Software engineering is an important branch of computer field, main focusing on the development of the software. In this research the factors which are the cause of the software failure and also the issue of software correlated component failure in Pakistan are discussed. These areas were major software engineering challenges in moving further in software based applications development.
-
III. Related Works
Jafary and Fiondella (2016) stated the multi state system (MSS) reliability modeling which estimate the reliability of both system and components, in past many decades most of the researcher claims that correlation of MSS provide bad effect on the system performance while the software is more complex. He explained a discrete universal generating function method to correlate the elements of the software with multi state components. This approach is in the diagnostic form and provides efficient performance, reliability assessment as well as sensitivity analysis on the impact of correlation. He clarified that through this strategy assess the effect of correlation on software performance, reliability and efficiency.
Nagaraju et al . (2016) stated that now-a-days social order more and more focus on the software based a service that’s why it becomes important that give more importance to the reliability and availability of the software to minimize the affect of software failure rejuvenation technique is used. This method also helps to reduce the affect of individual failure on software or system availability. He explained that though this method server availability is increased as well as cost is decrease. Proposed method is efficient and reliable and gives optimal rejuvenation period.
Febrero et al. (2016) stated that due to the widely use of the software based system now it necessary to give more alert on developing the error free software. For this purpose main focus of the developer is to develop reliable software and estimate the probability of software correlated component failure. He explained a literature research for anal sizing the importance of software reliability. He used a Standard Based Software Reliability Modeling (SB-SRM) technique to estimate the software correlated component failure. Through this qualitative method conclude that the proposed technique is also applied on complex organizations. Through this survey study also psychoanalysis that correlated component failure is main issue while dealing the software reliability. Proposed technique is efficient and reliable method to measure the importance of software reliability in any organization.
Garousi and Mantyla (2016) stated that for decrement of test code many organizations used test automation technique. through this method try to estimate the correlated software component failure by anal sizing the minimum software code, the proposed technique is also helps us to reduce the software development as well as software testing time. He explained that the given approach provide fruitful output only when it used in correct time, and context. Decision about the application of this technique is most important, because the success of the software project main focus on the software testing and estimating the software correlated component failure before implementation phase. He stated that for the implementation of this approach used Multifocal Literature Review (MLR) study through this method measure that what and when to automate the software testing. It concluded the test automation is a cheaper and easiest way to check the software reliability as well as software correlated component failure.
Saito and Dohi (2016) stated that non-parametric software reliability analysis is a huge issue. it is difficult to estimate the software reliability when there is incomplete information about software faults and failure at the development phase. The stochastic models just only provide information about software failure and faults it not give enough knowledge about unknown parameter of the model and software. The Monotone nonparametric estimator just provides information about the fulty data not about the time to failure and it also very rare to provide in practice. Now to revise this approach to test the software reliability and try to develop both estimation and predict quality of the software reliability. He experiment on thirteen project data and compare it with the previous parametric models and concluded that non-homogenous Poisson Process-based software reliability models is more efficient unique and east way to estimate the probability of software correlated component failure as well as estimation of the software reliability.
Yang et al (2016) stated that in complex and large software system software houses perform a regular upgrading so by this process faults and failure of the past rendition of the product is evacuate and the new functionalities add into the software. However when software introduced in the market it suppose that it is error free and high quality as per the customer requirement. He explained the testing in multi-release software and estimates that when there is delay in fault repair time then it means that there should be delay in software model. The proposed model is applied when software is released third time into the market. So this process of software reliability estimation is more cost effective and easy to apply in different software models. This technique is also helpful to provide software or product in time to the customer.
-
IV. Materials and Methods
Research methodology forms the basic idea on which the research is conducted. Conducting research and collecting data depends solely on research methodology. It can be defined as a method or technique of solving the problems systematically and scientifically. Moreover the purpose of research methodology is not only to describe the techniques and processes involved in data collection but also to understand the logic behind the methods that have been chosen for the purpose of any particular research (Kothari, 2006).
Two major types of research approaches used in primary are inductive and deductive approaches. The processes involved the inductive approaches.
In this research, simple random sampling based technique was used and a set of 83 companies from major locations of Pakistan were selected in such a way that the population represents overall software industry in Pakistan. For this purpose questionnaire was sent to 200 companies from Lahore, Karachi and Islamabad out of which only 83 valid responses were selected for data analysis.
Pakistan industry or the causes of the correlated component failure is discussed in this search. As we know that Pakistan is a developing country so there are so many issues in every field of life such as, resources, educated operators and etc, so in the same way Pakistan software development industry faces some major issues ,while developing the software. Some important issues which faced by the industry are discussed bellow.
-
• Badly define software security policy while developing the software
-
• Resource allocation during the software development process
-
• Complexity of the software
-
• Software design faults
-
• Badly perform the requirement gathering process
-
• Untrained or Uneducated Software Developer
-
• Untrained or Uneducated Software Operator
-
• Problems of software testing phase
-
• Software developing environment
-
• Software operating environment
-
• Late identification of the faults
-
• Complexity of the software
-
• Software design faults
These issues are discussed in the proposed research and analyze that which factor are the main reason of the software correlated failure in Pakistan industry.
-
A. Software Reliability Analysis
Table 1. Frequency of Software Reliability Analysis
|
Frequency |
Percent |
Valid Percent |
Cumulative Percent |
|
|
Agree |
41 |
49.4 |
49.4 |
49.4 |
|
Disagree |
7 |
8.4 |
8.4 |
57.8 |
|
Strongly Agree |
30 |
36.1 |
36.1 |
94.0 |
|
Strongly Disagree |
3 |
3.6 |
3.6 |
97.6 |
|
Neutral |
2 |
2.4 |
2.4 |
100.0 |
|
Total |
83 |
100.0 |
100.0 |
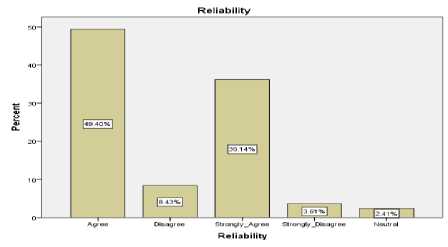
Fig.1. Software Reliability Analyses
Interpretation
-
B. Correlated Failure Analysis
Table 2 Frequency of Correlated Failures Analysis
|
Frequency |
Percent |
Valid Percent |
Cumulative Percent |
|
|
Agree |
43 |
51.8 |
51.8 |
51.8 |
|
Disagree |
8 |
9.6 |
9.6 |
61.4 |
|
Strongly Agree |
27 |
32.5 |
32.5 |
94.0 |
|
Strongly Disagree |
2 |
2.4 |
2.4 |
96.4 |
|
Neutral |
3 |
3.6 |
3.6 |
100.0 |
|
Total |
83 |
100.0 |
100.0 |
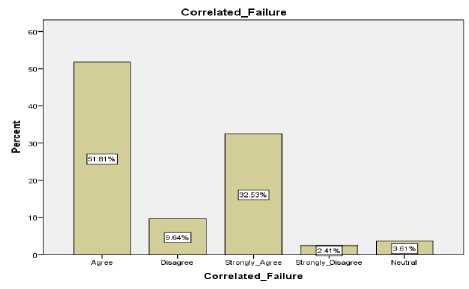
Fig.2. Correlated Failures Analysis
Interpretation
-
C. Software Complexity Analysis
Table 3. Frequency of Software complexity Analysis
|
Frequency |
Percent |
Valid Percent |
Cumulative Percent |
|
|
Agree |
36 |
43.4 |
43.4 |
43.4 |
|
Disagree |
6 |
7.2 |
7.2 |
50.6 |
|
Strongly Agree |
20 |
24.1 |
24.1 |
74.7 |
|
Strongly Disagree |
3 |
3.6 |
3.6 |
78.3 |
|
Neutral |
18 |
21.7 |
21.7 |
100.0 |
|
Total |
83 |
100.0 |
100.0 |
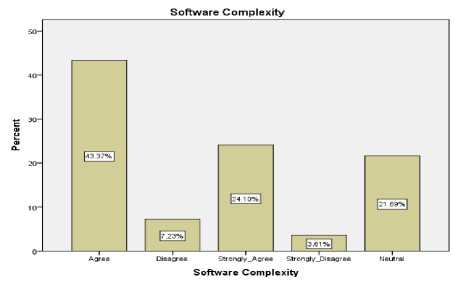
Fig.3. Software Complexity Analysis
Interpretation
-
D. Requirement Elicitation Analysis
Table 4. Frequency of Requirement Elicitation
|
Frequency |
Percent |
Valid Percent |
Cumulative Percent |
|
|
Agree |
27 |
32.5 |
32.5 |
32.5 |
|
Disagre e |
6 |
7.2 |
7.2 |
39.8 |
|
Strongl y Agree |
35 |
42.2 |
42.2 |
81.9 |
|
Strongly Disagree |
3 |
3.6 |
3.6 |
85.5 |
|
Neutral |
12 |
14.5 |
14.5 |
100.0 |
|
Total |
83 |
100.0 |
100.0 |
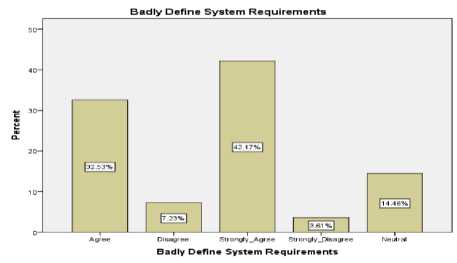
Fig.4. Requirement Elicitation Analyses
Interpretation
-
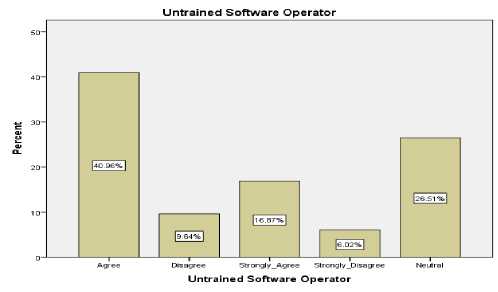
E. Software Operator Analysis
Table 5. Frequency of Software Operator Analysis
|
Frequency |
Percent |
Valid Percent |
Cumulativ e Percent |
|
|
Agree |
34 |
41.0 |
41.0 |
41.0 |
|
Disagree |
8 |
9.6 |
9.6 |
50.6 |
|
Strongly Agree |
14 |
16.9 |
16.9 |
67.5 |
|
Strongly Disagree |
5 |
6.0 |
6.0 |
73.5 |
|
Neutral |
22 |
26.5 |
26.5 |
100.0 |
|
Total |
83 |
100.0 |
100.0 |
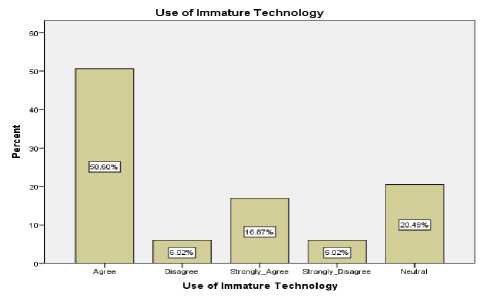
G. Software Technology Analysis
Fig.5. Software Operator Analyses
Interpretation
Table 7. Frequency of Software Technology Analysis
|
Frequency |
Percent |
Valid Percent |
Cumulativ e Percent |
|
|
Agree |
42 |
50.6 |
50.6 |
50.6 |
|
Disagree |
5 |
6.0 |
6.0 |
56.6 |
|
Strongly Agree |
14 |
16.9 |
16.9 |
73.5 |
|
Strongly Disagree |
5 |
6.0 |
6.0 |
79.5 |
|
Neutral |
17 |
20.5 |
20.5 |
100.0 |
|
Total |
83 |
100.0 |
100.0 |
-
F. Software Resource allocation Analysis
Table 6. Frequency of Software Resource Analysis
|
Frequency |
Percent |
Valid Percent |
Cumulative Percent |
|
|
Agree |
33 |
39.8 |
39.8 |
39.8 |
|
Disagree |
4 |
4.8 |
4.8 |
44.6 |
|
Strongly Agree |
37 |
44.6 |
44.6 |
89.2 |
|
Strongly Disagree |
2 |
2.4 |
2.4 |
91.6 |
|
Neutral |
7 |
8.4 |
8.4 |
100.0 |
|
Total |
83 |
100.0 |
100.0 |
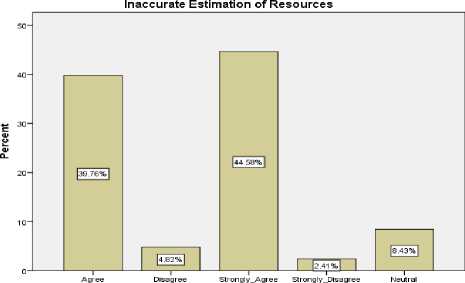
Inaccurate Estimation of Resources
-
Fig.6. Software Resource Analyses
Interpretation
-
Fig.7. Software Technology Analyses
Interpretation
-
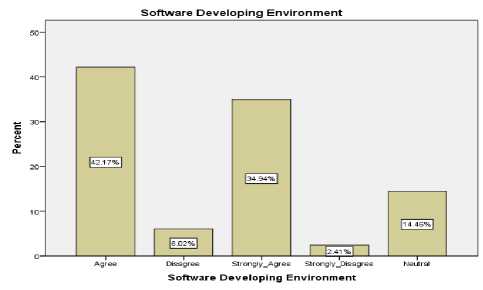
H. Software Developing Environment
Table 8. Frequency of software Developing Environment
|
Frequency |
Percent |
Valid Percent |
Cumulative Percent |
|
|
Agree |
35 |
42.2 |
42.2 |
42.2 |
|
Disagree |
5 |
6.0 |
6.0 |
48.2 |
|
Strongly Agree |
29 |
34.9 |
34.9 |
83.1 |
|
Strongly Disagree |
2 |
2.4 |
2.4 |
85.5 |
|
Neutral |
12 |
14.5 |
14.5 |
100.0 |
|
Total |
83 |
100.0 |
100.0 |
J. Software Design Analysis
Fig.8. Software Developing Environment
Interpretation
-
I. Software Operating Environment Analysis
Table 9. Frequency of Software Operating Environment
|
Frequency |
Percent |
Valid Percent |
Cumulative Percent |
|
|
Agree |
29 |
34.9 |
34.9 |
34.9 |
|
Disagree |
16 |
19.3 |
19.3 |
54.2 |
|
Strongly Agree |
11 |
13.3 |
13.3 |
67.5 |
|
Strongly Disagree |
8 |
9.6 |
9.6 |
77.1 |
|
Neutral |
19 |
22.9 |
22.9 |
100.0 |
|
Total |
83 |
100.0 |
100.0 |
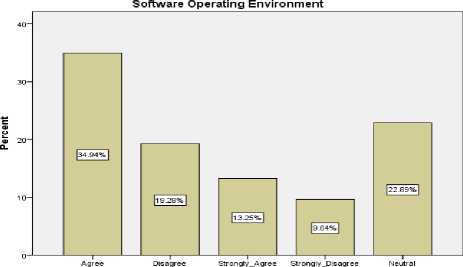
Software Operating Environment
-
Fig.9. Software Operating Environment Analysis
Interpretation
Table 10. Frequency of Software Design Analysis
|
Frequency |
Percent |
Valid Percent |
Cumulative Percent |
|
|
Agree |
29 |
34.9 |
34.9 |
34.9 |
|
Disagree |
5 |
6.0 |
6.0 |
41.0 |
|
Strongly Agree |
26 |
31.3 |
31.3 |
72.3 |
|
Strongly Disagree |
3 |
3.6 |
3.6 |
75.9 |
|
Neutral |
20 |
24.1 |
24.1 |
100.0 |
|
Total |
83 |
100.0 |
100.0 |
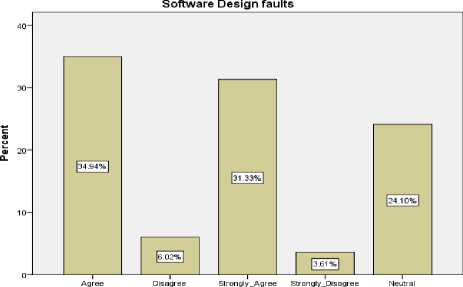
Software Design faults
Fig.10. Software Design Analyses
Interpretation
-
K. Software Fault Identification at Development Phase
Table 11. Frequency of Software Fault Identification at Development Phase
|
Frequency |
Percent |
Valid Percent |
Cumulative Percent |
|
|
Agree |
25 |
30.1 |
30.1 |
30.1 |
|
Disagree |
9 |
10.8 |
10.8 |
41.0 |
|
Strongly Agree |
32 |
38.6 |
38.6 |
79.5 |
|
Strongly Disagree |
3 |
3.6 |
3.6 |
83.1 |
|
Neutral |
14 |
16.9 |
16.9 |
100.0 |
|
Total |
83 |
100.0 |
100.0 |
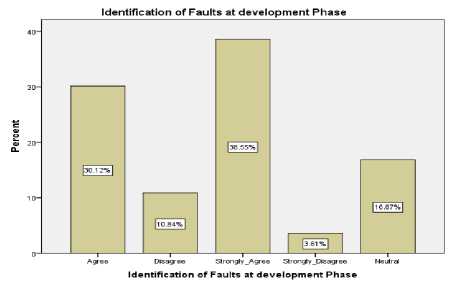
Fig.11. Software Fault Identification at Development Phase
Interpretation
-
L. Software Fault Identification at Implementation Phase
Table 12. Frequency of Software Fault Identification at Implementation Phase
|
Frequency |
Percent |
Valid Percent |
Cumulative Percent |
|
|
Agree |
26 |
31.3 |
31.3 |
31.3 |
|
Disagree |
14 |
16.9 |
16.9 |
48.2 |
|
Strongly Agree |
20 |
24.1 |
24.1 |
72.3 |
|
Strongly Disagree |
3 |
3.6 |
3.6 |
75.9 |
|
Neutral |
20 |
24.1 |
24.1 |
100.0 |
|
Total |
83 |
100.0 |
100.0 |
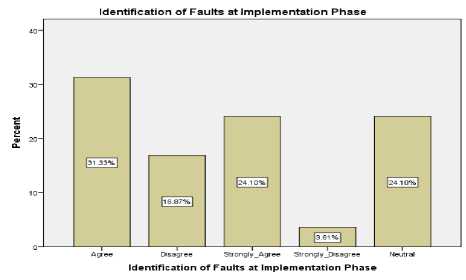
Fig.12. Software Fault Identification at Implementation Phase
Interpretation
-
M. Software Testing Analysis
Table 13. Frequency of Software Testing Analysis
|
Frequency |
Percent |
Valid Percent |
Cumulative Percent |
|
|
Agree |
38 |
45.8 |
45.8 |
45.8 |
|
Disagree |
5 |
6.0 |
6.0 |
51.8 |
|
Strongly Agree |
32 |
38.6 |
38.6 |
90.4 |
|
Strongly Disagree |
3 |
3.6 |
3.6 |
94.0 |
|
Neutral |
5 |
6.0 |
6.0 |
100.0 |
|
Total |
83 |
100.0 |
100.0 |
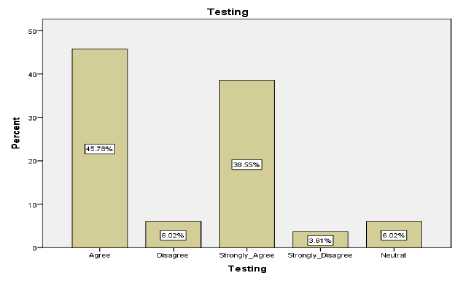
Fig.13. Software Testing Analysis
Interpretation
-
N. Security Policy Analysis
Table 14. Frequency of Security Policy Analysis
|
Frequency |
Percent |
Valid Percent |
Cumulative Percent |
|
|
Agree |
29 |
34.9 |
34.9 |
34.9 |
|
Disagree |
4 |
4.8 |
4.8 |
39.8 |
|
Strongly Agree |
36 |
43.4 |
43.4 |
83.1 |
|
Strongly Disagree |
2 |
2.4 |
2.4 |
85.5 |
|
Neutral |
12 |
14.5 |
14.5 |
100.0 |
|
Total |
83 |
100.0 |
100.0 |
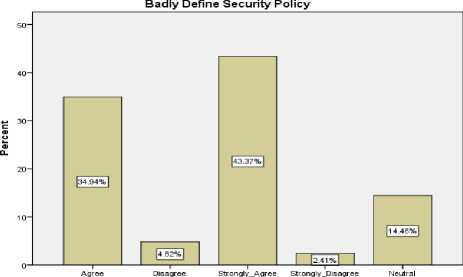
Badly Define Security Policy
Fig.14. Security Policy Analyses
Interpretation
O. Untrained Software Developer
Table 15. Frequency of Untrained Software Developer
|
Frequency |
Percent |
Valid Percent |
Cumulative Percent |
|
|
Agree |
33 |
39.8 |
39.8 |
39.8 |
|
Disagree |
4 |
4.8 |
4.8 |
44.6 |
|
Strongly Agree |
16 |
19.3 |
19.3 |
63.9 |
|
Strongly Disagree |
3 |
3.6 |
3.6 |
67.5 |
|
Neutral |
27 |
32.5 |
32.5 |
100.0 |
|
Total |
83 |
100.0 |
100.0 |
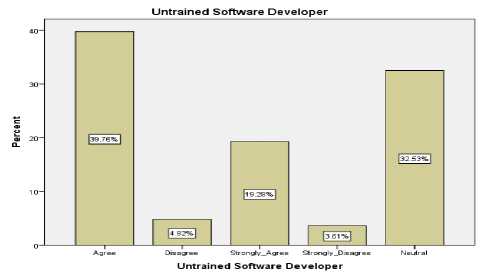
Fig.15. Untrained Software Developers Analysis
Interpretation
Acknowledgment
This research supported by the Department of Computer Science at Agriculture University Faisalabad .
References Reliability of Software Correlated Components Failure in Pakistan Industry
- Ammann, P. and J. Offutt. 2011. Introduction to Software Testing.Cambridge University Press,pp:1-30.
- Brosch, F., H. Koziolek, B. Buhnova and R. Reussner. 2012. Architecture-based Reliability Prediction with the Palladio Component Model.IEEE Transactions on Software Engineering, 38(6):1319–1339. DOI: 10.1109/TSE.2011.94.
- Dai, Y., M. Xie and K. Poh. 2005. Modeling and Analysis of Correlated Software Failures of Multiple Types. IEEE Transactions on Reliability, 54(1): 100–106. DOI: 10.1109/TR.2004.841709.
- Febrero, F., M. Calero and M. A.Chang. 2016. A Mapping Study of Software Correlated Failure Modeling. Information and Software Technology, 30(1): 639-649.
- Fiondella, L. and L.Panlop. 2014. Reliability of Two Mode Systems Subject to Correlated Failures. IEEE Transactions on Reliability, pp:879-889.DOI: 10.1109/RAMS.2014.6798438.
- Fiondella, L., S. Rajasekaran and S. S. Gokhale. 2013. Efficient Software Reliability Analysis with correlated component failure. .IEEE Transactions on reliability, 62(1): 244–255. DOI: 10.1109/TR.2013.2241131.
- Garousi, V. and M. V. Mantyla. 2016. When and What to Automate in Software Testing? A Multi-vocal Literature Review. Information and Software Technology, 76: 1-38. DOI: http://dx.doi.org/10.1016/j.infsof.2016.04.015.
- Hamill, M. and K.Goseva-Popstojanova. 2009. Common Trends in Software Fault and Failure Data, 35(4): 484–496. Doi: 10.1109/TSE.2009.3.
- Jafary, B. and L. Fiondella. 2016. A Universal Generating Function-based Multi-state System Performance Model Subject to Correlated Failure.Reliability Engineering & System Safety, 152: 16-27. DOI: 10.1016/j.ress.2016.02.004.
- Jatain, A. and Y. Yukti. 2014. Metrics and models for Software Reliability: A systematic review. 2014 International Conference on Issues and Challenges in Intelligent Computing Techniques (ICICT), pp: 210–214. Doi: 10.1109/ICICICT.2014.6781281.
- Kothari, C. R. 2006. Research Methodology: Method and Techniques (2nd edi.). Delhi: New Age International Publishers.
- Nagaraju, V., V. V. Basavaraj and L. Fiondella. 2016. Software Rejuvenation of a Fault-tolerant Server Subject to Correlated Failure.Proceedings Annual Reliability and Maintainability Symposium, pp: 110-115.
- Park, J., H. Kim, J. Shin and J. Baik. 2012. An Embedded Software Reliability Model with Consideration of Hardware Related Software Failures. IEEE Sixth International Conference on Software Security and Reliability, pp: 207–214. DOI: 10.1109/SERE.2012.10.
- Saito, Y. and T. Dohi. 2016. Predicting Software Reliability via Completely Monotone Nonparametric Estimator with Grouped data.Journal of Systems and Software, 117:296-306.DOI: 10.1016/j.jss.2016.03.047.
- Yang, J., Y. Liu, M. Xie and M. Zhao. 2016.Modeling and Analysis of Reliability of Multi-release Open Source Software Incorporating Both Fault Detection and Correction Processes.Journal of Systems and Software,115:102-110. DOI: 10.1016/j.jss.2016.01.025.
- Zhai, E., R. Chen, D. L. Wolinsky and B. Ford. 2014. Heading off Correlated Failures through Independence-as-a-Service. Proceedings of the 11th USENIX Conference on Operating Systems Design and Implementation, pp: 317-334.
