Removal of ocular artifacts in single channel EEG by EMD, EEMD and CEEMD methods inspired by wavelet thresholding

Author: Vijayasankar. Anumala, Rajesh Kumar. Pullakura
Journal: International Journal of Image, Graphics and Signal Processing @ijigsp
Article in issue: 5 vol.10, 2018.
Free access
Electroencephalogram (EEG) is a widely used signal for analyzing the activities of the brain and usually contaminated with artifacts due to movements of eye, heart, muscles and power line interference. Owing to eye movement, Ocular Activity creates significant artifacts and makes the analysis difficult. In this paper, a new threshold is presented for correction of Ocular Artifacts (OA) from EEG signal using Empirical Mode Decomposition (EMD), Ensemble Empirical Mode Decomposition (EEMD) and Complete Ensemble Empirical Mode Decomposition (CEEMD) methods. Unlike the conventional EMD based EEG denoising techniques, which neglects the higher order low-frequency Intrinsic Mode Functions (IMFs), IMF Interval thresholding is opted to correct the artifacts. Obtained the noisy IMFs based on MI scores and perform interval thresholding to the noisy IMFs gives a relatively cleaner EEG signal. Extensive computations are carried out using EEG Motor Movement/Imagery (eegmmidb) dataset and compare the performance of Proposed Threshold (PT) with current threshold functions i.e., Universal Threshold (UT), Minimax Threshold (MT) and Statistical Threshold (ST) using several standard performance metrics: change in SNR (ΔSNR), Artifact Rejection Ratio (ARR), Correlation Coefficient (CC), and Root Mean Square Error (RMSE). Results of these studies reveal that CEEMD+PT is efficient to correct OAs in EEG signals and maintaining the background neural activity in non-artifact zones.
Electroencephalogram (EEG), Ocular artifacts, Empirical Mode Decomposition (EMD), Ensemble Empirical Mode Decomposition (EEMD), Complete Ensemble Empirical Mode Decomposition (CEEMD), Thresholding
Short address: https://sciup.org/15015963
IDR: 15015963 | DOI: 10.5815/ijigsp.2018.05.05
Text of the scientific article Removal of ocular artifacts in single channel EEG by EMD, EEMD and CEEMD methods inspired by wavelet thresholding
Published Online May 2018 in MECS DOI: 10.5815/ijigsp.2018.05.05
EEG signals are often corrupted by physiological and extra-physiological artifacts. The extra-physiological artifacts such as line interference and electrode noise are removed by filtering techniques as there is a spectral separation. But careful attention is required to remove physiological artifacts due to movements of eye, heart, and muscles as they co-exist within the same frequency range of the EEG signal. There is a considerable loss of EEG activity due to overlapping spectrum if the process of artiafct removal is not methodical.
Various techniques are in vogue for correcting OAs in EEG recordings. Wavelet Transform (WT) techniques are widely used for the correction of artifacts in EEG signals [1, 2, 3, 4]. Many investigators have employed various combinations of WT techniques: Discrete Wavelet Transform (DWT) and Stationary Wavelet Transform (SWT) and thresholds to remove OAs from EEG signals [3, 4]. But the WT is not adaptive and the selection of mother wavelet also influences the artifact removal performance.
EMD has been adopted [5] to analyze non-linear and non-stationary signals like EEG. It is a powerful signal processing tool for extracting signals from noisy data. Research executed by [6] has asserted and demonstrated EMD filtering technique to remove the eye blink and eye movement artifacts in a single channel EEG by partial reconstruction from the components of decomposition. Novel methodology in this paradigm has published [7] applied analytical methods for the removal of blink artifacts from EEG signal by EMD. In this method, the noisy IMFs are identified relying on entropy and reconstruct the signal using IMFs that comprises lower entropy. Another profound work [8] has proposed based on mutual information to determine the noisy IMFs and the clean EEG was obtained by excluding the noisy IMFs. Mode mixing problem limits the performance of EMD. In order to improve it, the EEMD method is proposed, which can perform EMD over an ensemble of noisy copies of the raw signal and the true IMFs are obtained by taking the average [9, 10]. However, signal reconstructed by the EEMD restrains the residual noise
-
[10] . CEEMD is proved to be an important enhancement on EEMD which comprehensively resolves the mode mixing; thereby minimizing the reconstruction error [11, 12].
Excluding the noisy IMFs for OAs correction leads to loss of significant information in the reconstructed signal. To address this [13] novel methodologies were developed viz., EMD interval thresholding (EMD-IT), Iterative EMD Interval Thresholding (EMD-IIT) and Clear Iterative EMD Interval Thresholding (EMD-CIIT) inspired by wavelet thresholding for signal denoising. In recent years, the hybrid approach which is the combination of several methods has been proposed for automatic removal of artifacts [14, 15, 16]. These methods may remove the artifact without human intervention but multidimensionality does increase the computational complexity.
The coefficient thresholding for OAs correction is simpler and requires less computational resources than existing techniques. Many threshold functions are available in the literature to remove artifacts from biosignals, in particular, Universal, Minimax, and Statistical Thresholds [17, 18]. This study proposes, a new threshold to remove OAs in single channel EEG signal and the performance of different thresholds are compared in EMD, EEMD and CEEMD domains [19]. The rest of the manuscript is structured as follows. Data acquisition and methodology are described in section II. Section III details the methods of artifact correction and thresholding while the concepts of current and proposed threshold functions are discussed in section IV. Section V deals with various performance metrics used in this study, Section VI presents the results and discussion. Conclusions drawn are presented in section VII.
-
II. Data Acquisition and Methodology
-
A. Data Acquisition
Single channel EEG epochs of 10sec duration each from five subjects are taken for this work at polysomnographic records [20]. The ocular artifacts are found dominant in the frontal and frontopolar channels like F7, F8, Fp1, and Fp2. Hence, it is reasonable to take signals from these electrodes as contaminated or corrupted EEG signals. EEG signals with blink artifacts are shown in fig.1.
-
B. Methodology
-
• Applied EMD, EEMD and CEEMD for the raw EEG signal to obtain the IMFs. Higher order IMFs comprise low-frequency noise and lower order IMF components consist of high-frequency noise, i.e., the ocular artifacts lie in the last several IMFs.
-
• Perform soft thresholding (Eq.11) to the noisy IMFs [8] as described in section III.B.The EEG signal is reconstructed by adding the modified IMFs and the remaining signal IMFs.
-
• Evaluation of the metrics: ΔSNR, ARR, CC, and RMSE between raw and clean EEG signals. The process of artifact correction is shown in fig.2.
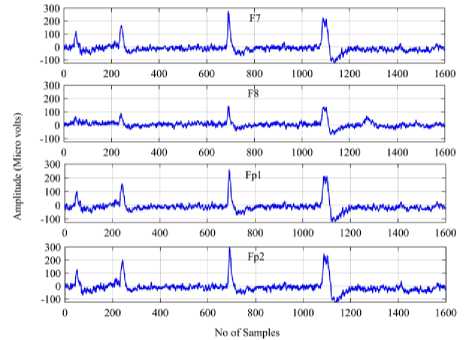
Fig.1. Raw EEG Signals with Ocular Artifacts from Electrodes F7, F8, Fp1 and Fp2
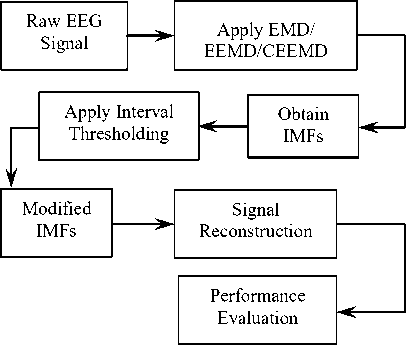
Fig.2. Denoising Approach Based on IMF Thresholding
-
III. Methods of Artifact Correction
-
A. EMD, EEMD and Complete EEMD Description
EMD decomposes the signal into IMFs, which are extracted through an iterative sifting process [5].
EMD algorithm for raw EEG signal x(t) is described as follows:
-
(a) Determine the peaks of raw EEG signal.
-
(b) Construct the lower envelope (elower) and upper envelope (eupper) of the signal separately by cubic spline interpolation.
-
(c) Generate the first Intrinsic Mode Function (IMF1) by subtracting the mean envelope from x(t).
h 1 (t) = x(t) - m(t)
where the mean envelope
(e + e ) lower upper
m(t) =---^^
-
(d) The first residual component is obtained by subtracting IMF1 from x(t).
di(t) =x(t) - MO
-
(e) Repeat the process described from step (a) to calculate the next IMF by considering the residual component as a new signal.
-
(f) Repeat the process until no more IMFs can be extracted. The original signal x (t) can be reconstructed from IMF as
K
x (t) = £ h k (t) + d(t) (3)
k = 1
EMD experiences mode mixing, it is addressed by EEMD, which defines the “true modes” by averaging IMFs. Let x(t) be the signal of interest. The EEMD algorithm can be described as follows:
-
(a) Create x i (t) = x(t) + e w i (t)
where w i (t),(i = 1,2,...,I) is a zero mean unit variance white noise realization and the scaling factor ε > 0.
-
(b) Completely decompose each xi (t) by EMD to obtain the modes h i (t).
-
(c) True IMFs are obtained by taking the average of all IMFs
I
~ k (t) = - £ h k (t) (4)
I i = 1
Ensemble size I and scaling factor ε were set to 100 and 0.2 respectively [10].
This situation results the following EEMD disadvantages: (i) In-complete decomposition and (ii) The reconstructed signal contain residual noise.
In order to deal with the reconstruction error, the complete EEMD (CEEMD) [11] was proposed.
Let Ek ( * ) be the operator which produces the kth mode obtained by EMD and let wi (t) be a realization of zero mean unit variance white noise. Then:
-
(a) For every i = 1,2,.., I decompose each x i (t) = x(t) + e0w i (t), by EMD, until its first mode and compute h i (t).
-
(b) Average over the ensemble to obtain the first IMF:
I
~ i (t) = - £ h i (t) (5)
I i = 1
-
(c) Calculate the first residue as
~ d1 (t) = x(t) - h 1(t).
-
(d) Decompose the realizations
dj (t) + e E,(w ‘ (t)), i = 1,2,...,I, until their first mode and define the second mode
I h2(t) = - £E1(d1(t) + 81 E1(wi (t))) (6)
I i = 1
for k = 2,..,K calculate the kthresidue dk (t) = x(t) - hk(t) (7)
-
(e) Decompose the realizations
dk (t) + ekEk (w i (t)), i = 1,..., I, until their first EMD mode, and define the (k + 1)th mode as
I h (k+1)( t) = 7 £ E1( dk (t) + 8kEk (wi (t))) (8)
I i = 1
-
(f) Go to step (d) for next k.
Steps (d) to (f) are performed until residue is below a stopping criterion. The final residue satisfies:
K ~
d(t) = x( t) - £ h k (t) where K is the total number of k = 1
modes. Finally x ( t ) can be expressed as
K
x(t) = £ h k (t) + d(t) (9)
k = 1
The noise scaling factor on the first mode ε 0 and the ensemble size I were also set as 0.2and 100 which are same conditions of EEMD. The CEEMD scheme provides better spectral separation of the modes and requires lesser number of sifting iterations.
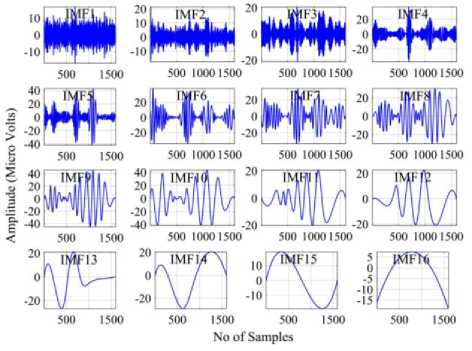
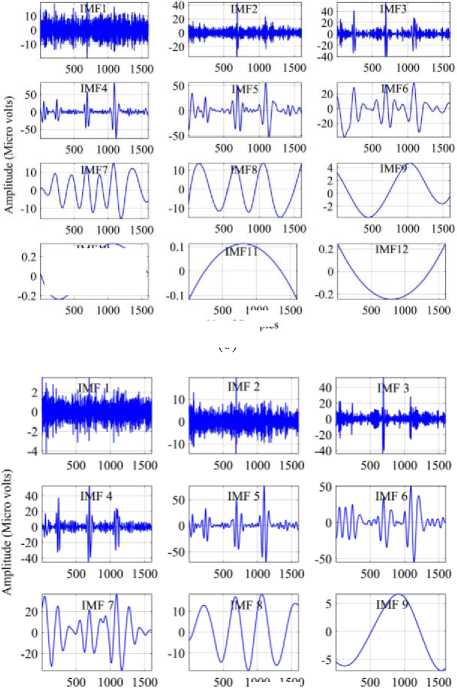
The computational cost of CEEMD is reduced in terms of number of IMFs and sifting iterations. The set of IMFs for Fp2 EEG signal by EMD, EEMD, and CEEMD methods have shown in fig. 3(a), 3(b), and 3(c)
respectively.
-
B. Interval Thresholding in EMD, EEMD and CEEMD Domains
The EEG signal x(t) is decomposed into number of IMFs using EMD/ EEMD/ CEEMD methods such as
K
x(t) = ^ h k (t) + d(t) (10)
k = 1
Where d(t) is the residue, which is a slowly varying function with few extremas. IMF h (t) has zero mean; the successive maxima and minima values are positive and negative respectively.
The extremas of h (t) positioned in time instances t j =[t 1 , t 2 , …t M ] and the corresponding IMF points h (t ), j=1,2,…M, will alternate between maxima and minima values. i t results in a single zero crossing z between any pair of extrema t = [hk (t ), hk (t )] . Zs is the j th zero crossing of k th IMF. The interval of zero crossing for k th IMF is zkj = [zj,Zj l]and the corresponding IMF points are h (z ) . m athematically the soft thresholding operation is held by Eq. (11).
(a)
hA) *
ЬД) -X t h k (t j )
hA)=
ht(t) >X
ЬД)
for j= 1, 2….M, where h (z ) indicates the samples from instants z to z and λ is the threshold at k th imf + 1 k
C. Identification of Noisy IMFs
The Mutual information (MI) scores between IMFs h k (t) and x(t) yielding unreliable detection of noisy IMFs. Auto Correlation Function (ACF) based approach gives preferably distinguished MI scores for the noisy IMFs [8]. Procedure to recognize the noisy IMFs is described below:
-
a) Calculate R i (k) and R x (k), which denote ACFs of h (t) and x(t) respectively.
-
b) Compute I i =I(R i (k);R x (k)), where I i is the MI scores between R i (k) and R x (k).
-
c) Normalize I =___ I____, for I = 1, 2 ,..N.
i (I )
i max
1000 1500
1........ 1'0'1
1000 1500
No of Samples
(b)
(c)
1000 1500
No of Samples
Fig.3. Decomposition of Fp2 EEG signal by (a) EMD (b) EEMD, (c) CEEMD.
I WK) 1500
|
IMR4D |
|
|
V У |
-
d) Determine the threshold, T = 11 + X3
-
e) The first ‘n’ IMFs, whose MI is above the threshold T are considered as noisy IMFs.
Applied soft thresholding (Eq.11) to the noisy IMFs, The EEG signal is reconstructed by adding the modified IMFs and the remaining signal IMFs. The reconstructed signal ~x(t) is given by Eq. (12).
n ~ N
~ (t) = E hk(n) + E hk(n)
k = 1 k = n + 1
IV. Existing and Proposed Threshold Functions
The Decision of threshold function is a critical step in the denoising process. The clean signal remains noisy if the threshold is too small or large as well. So, an adaptive threshold function is to be found. The decomposed EEG signal coefficients at each IMF must be customized by thresholding to separate the artifactual coefficients from
neural signal coefficients. Various threshold functions for the artifact correction are described below.
-
A. Universal Threshold (UT)
The Universal Threshold function is proposed by Donoho [17]. This is a global threshold function, Threshold values are calculated using the universal method given by Eq. (13).
-
X, =о J 2log N (13)
kk
Where N is the length of the raw EEG signal, σ k is the mean absolute deviation and λ k is the threshold value of k th IMF. σ k is expressed as
Median | hk | (14)
k 0.6745
Where h k denotes the EMD coefficients at k th level. The numerator is rescaled by 0.6745 in the denominator so that it will be a suitable estimator for Gaussian white noise .
-
B. Minimax Threshold (MT)
MT employs a fixed threshold to yield minimax performance for root mean square error (RMSE) against an ideal procedure [18]. The effective Minimax threshold λ k is given by
_ Г^ (0.3936 + 0.108 log2N) N > 32
Л k [ 0 N < 32 ( )
-
C. Statistical Threshold (ST)
Statistical Threshold was proposed by Krishnaveni et al., is based on the statistics of the signal [2]. The effective statistical threshold λ k would be
X k = 1.5*std(hk) (16)
Where h k denote the coefficients of k th IMF and factor 1.5 is an estimator for standard white Gaussian noise.
-
D. Proposed Threshold (PT)
PT is adaptive to different sub-band characteristics by analyzing the parameters of the IMF coefficients [19]. The new threshold function X k is given by Eq. (17).
X k = Pk - std(hk)(17)
and Pk = exp[(Xk - Sk)/(Xk + Sk)]
where P k is the threshold improvement factor and λ k is the universal threshold function and
St = - * Z!M k N <^
Where N represents the number of IMF coefficients at each level.
-
V. Performance Metrics
The performance of various methods using different threshold functions are evaluated in terms of the following metrics: ΔSNR, ARR, CC, RMSE and Power Density Spectrum. SNR is defined as the ratio of signal power to the noise power, often expressed in dB as
ARR is the ratio of the power of the removed artifacts to the power of the clean EEG signal given by
Where x[n]and y[n] denote the contaminated and clean EEG signals respectively.
CC is a statistical quantity that shows the degree of similarity or relatedness between two signals expressed as
RMSE estimates the difference between the raw and clean EEG signal and computed by the following equation
Where x 1 [n] and y 1 [n] denote the samples of input and reconstructed signals respectively in the originally artifact-free region. PSD gives the energy of the signal as a function of frequency. It has been implemented in this study using power spectral density estimate via Welch's method (pwelch).
-
VI. Results and Discussion
-
A. IMF-Thresholding in EMD, EEMD and CEEMD Domains
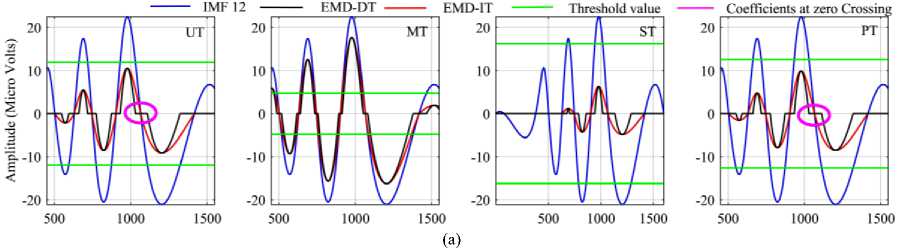
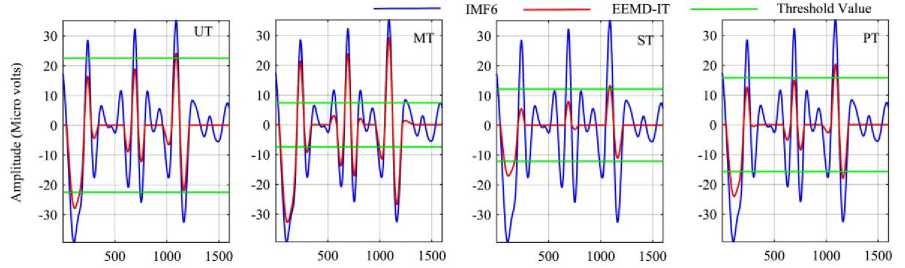
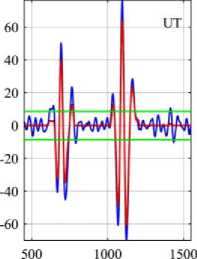
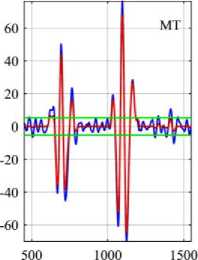
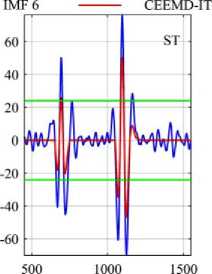
Direct application of thresholding to the decomposition modes is incorrect and can have catastrophic consequences for the continuity of the reconstructed signal. Before showing the results of the simulation, an example will be given to illustrate the modified IMF coefficients by thresholding. Fig.4(a) demonstrates the difference between modified IMF by interval thresholding and direct thresholding using various threshold functions. 12 th IMF of the signal shown in fig.2(a) has been used as an example. Clearly, EMD-DT introduces the discontinuity in the vicinity of zero crossings, which results in loss of neural activity in nonblink regions and errors in signal reconstruction. Hence, EMD-DT is not suggested to correct artifacts from singlechannel EEG signals. Similarly, Fig.4(b) and 4(c) represent the 6 th IMF before and after thresholding by EEMD and CEEMD methods. Table 1 depicts the threshold values at each IMF by various methods. From Fig.4 and based on Table 1, it is clear that threshold function ST shrinks the coefficients better than other thresholds and threshold function PT is good after ST in all methods.
-
B. Discussions
In this work, a new threshold is proposed for the correction of OAs from single-channel EEG signals by EMD, EEMD and CEEMD methods and compared their performance with the existing threshold functions (UT,
MT, and ST). Extensive computations are carried out on frontal and frontopolar channel EEG epochs of five subject’s in-terms of standard metrics: ΔSNR, ARR, CC, and RMSE. Table 2 depicts the values of ΔSNR and ARR of different methods. Based on Table 2 CEEMD is outperformed than other methods whereas EEMD is better after CEEMD. Based on ΔSNR and ARR, ST has shown superior performance than other threshold functions indicating that it is aggressive in removing the probable artifacts. PT is better next to ST.
An ideal eye blink removal algorithm should correct the artifacts in the blink region while preserving the background neural information in artifact free regions. In this context, there is a need to segregate the EEG signal into blink and non-blink regions [3] and Metrics CC, RMSE between raw and clean EEG signals over nonblank regions are evaluated and tabulated (Table 3). High CC and low RMSE for the non-blink regions are chief requisites for an efficient algorithm. Based on Table 3, CEEMD is outperformed than other methods whereas EEMD is better after CEEMD. It is noticed from Table 3, that MT has given better results than other thresholds. However, UT and PT methods have shown the acceptable performance.
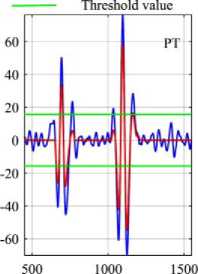
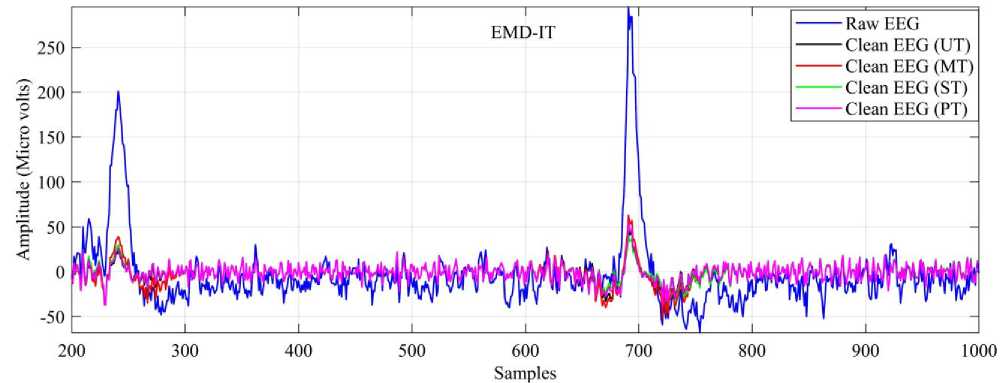
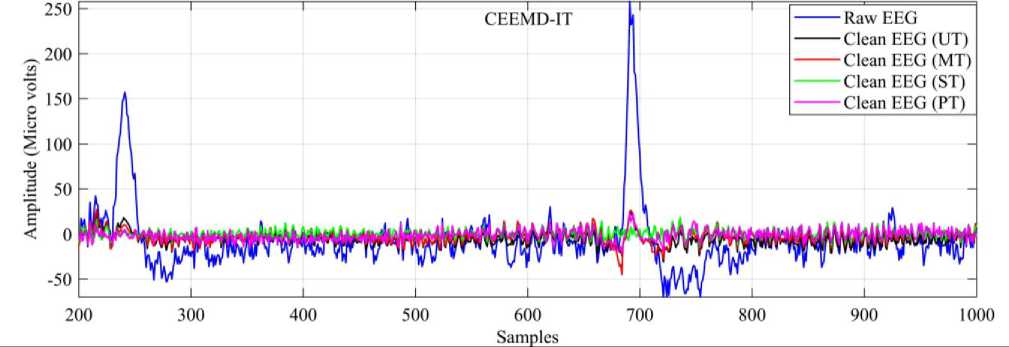
The clean EEG signal computed by various methods using different thresholds is shown in fig.5. All the methods are effective in correcting the artifacts, but careful perception demonstrates that CEEMD inspired by wavelet thresholding corrects the artifacts better than other methods and EEMD performed better than EMD method. ST has shown superior performance for artifact correction in EMD, EEMD and CEEMD methods, and PT is next to ST.
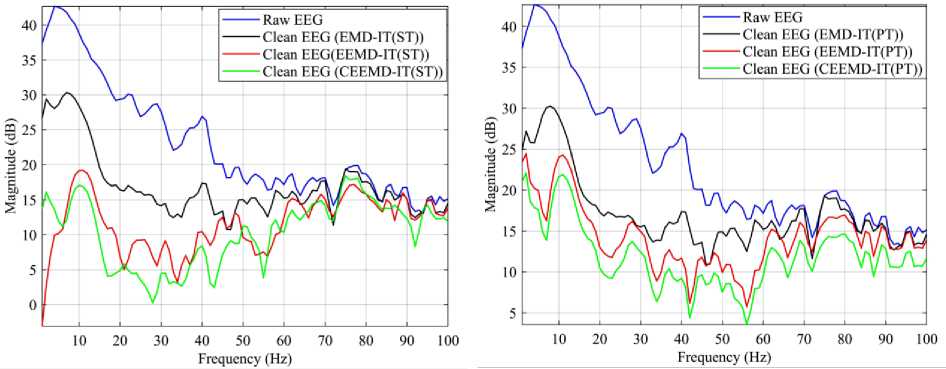
Fig.6 (a) and 6(b) illustrated the power spectra of contaminated and clean EEG signals by EMD, EEMD and CEEMD methods using ST and PT limits. It is clear that the power of the spectral components belonging to low-frequency range is fully reduced by CEEMD and EEMD with ST and PT thresholds respectively; indicating the effective removal of artifacts in that region.
An optimum artifact removal technique must have high ΔSNR, ARR, CC and low RMSE. CEEMD method is superior in terms of metrics ΔSNR, ARR, CC and RMSE whereas EEMD is better than EMD.
Threshold function ST has shown outstanding performance in terms of ΔSNR and ARR but the neural activity in the nonblank regions is slightly affected. Though thresholds UT and MT are preserving the background EEG activity but unable reject the artifacts fully in-terms of ΔSNR, ARR. Hence threshold PT is an optimum choice, which shows an acceptable performance in artiafct correction by EMD, EEMD and CEEMD methods. The execution time of different methods of artifact removal is given in Table 4. It clearly depicts that EMD based denoising technique is faster than EEMD and CEEMD methods. The process of decomposition for getting IMFs makes the CEEMD is slower than EMD and EEMD methods.
(b)
(c)
Fig.4. (a) Comparison of IMF Coefficients Before and After Thresholding by (a) EMD-IT and EMD-DT Methods. (b) EEMD-IT Method (c) CEEMD-IT Method.
Table 1. Threshold Values by EMD, EEMD and CEEMD Methods Using Various Threshold Functions
|
Method |
IMF |
Threshold Values |
|||
|
UT |
MT |
ST |
PT |
||
|
EMD-IT |
λ 1'2 |
11.96 |
4.81 |
16.21 |
12.59 |
|
EEMD-IT |
λ '6 |
12.12 |
7.39 |
22.51 |
15.75 |
|
CEEMD-IT |
λ '6 |
8.58 |
5.22 |
24.03 |
15.66 |
Table 2. Average ΔSNR (dB) and ARR by EMD, EEMD and CEEMD Methods using Various Threshold Functions
|
Method |
Threshold |
Channels |
|||||||
|
F7 |
F8 |
Fp1 |
Fp2 |
||||||
|
ΔSNR (dB) |
ARR |
ΔSNR(dB) |
ARR |
ΔSNR(dB) |
ARR |
ΔSNR(dB) |
ARR |
||
|
EMD |
UT |
12.38 |
2.45 |
10.5 |
1.92 |
12.81 |
1.92 |
12.65 |
2.10 |
|
MT |
11.72 |
1.47 |
7.87 |
1.24 |
9.70 |
1.34 |
10.22 |
1.44 |
|
|
ST |
16.75 |
5.57 |
13.42 |
4.26 |
15.28 |
5.23 |
15.58 |
4.75 |
|
|
PT |
13.76 |
3.87 |
11.76 |
3.28 |
13.54 |
3.36 |
14.18 |
2.80 |
|
|
EEMD |
UT |
13.52 |
2.68 |
11.75 |
2.18 |
13.56 |
2.52 |
13.08 |
2.20 |
|
MT |
11.97 |
1.64 |
9.28 |
1.38 |
10.65 |
1.56 |
10.91 |
1.58 |
|
|
ST |
17.55 |
6.12 |
15.62 |
5.26 |
17.34 |
6.37 |
16.68 |
5.98 |
|
|
PT |
15.52 |
4.76 |
13.19 |
3.89 |
15.28 |
4.88 |
14.88 |
4.42 |
|
|
CEEMD |
UT |
14.25 |
2.98 |
13.64 |
2.64 |
13.76 |
2.32 |
14.38 |
3.28 |
|
MT |
12.25 |
1.88 |
11.58 |
1.64 |
11.44 |
1.68 |
11.68 |
1.72 |
|
|
ST |
18.36 |
6.88 |
17.74 |
6.52 |
17.32 |
7.44 |
19.24 |
7.28 |
|
|
PT |
17.24 |
5.46 |
14.88 |
4.78 |
15.78 |
6.12 |
17.45 |
6.22 |
|
Table 3. Average CC and RMSE by EMD, EEMD and CEEMD Methods using Various Threshold Functions
|
Method |
Threshold |
Channels |
|||||||
|
F7 |
F8 |
Fp1 |
Fp2 |
||||||
|
CC |
RMSE |
CC |
RMSE |
CC |
RMSE |
CC |
RMSE |
||
|
EMD |
UT |
0.922 |
14.16 |
0.914 |
13.80 |
0.918 |
15.71 |
0.936 |
14.21 |
|
MT |
0.948 |
12.28 |
0.954 |
12.08 |
0.941 |
13.74 |
0.962 |
12.46 |
|
|
ST |
0.721 |
16.30 |
0.712 |
16.08 |
0.702 |
17.40 |
0.716 |
16.48 |
|
|
PT |
0.915 |
14.90 |
0.915 |
14.62 |
0.908 |
17.02 |
0.912 |
14.76 |
|
|
EEMD |
UT |
0.936 |
13.25 |
0.928 |
13.11 |
0.930 |
14.45 |
0.944 |
13.38 |
|
MT |
0.956 |
11.28 |
0.960 |
11.73 |
0.960 |
11.56 |
0.972 |
11.64 |
|
|
ST |
0.748 |
15.96 |
0.752 |
15.61 |
0.740 |
16.76 |
0.740 |
16.07 |
|
|
PT |
0.924 |
14.88 |
0.912 |
14.38 |
0.918 |
16.08 |
0.925 |
14.35 |
|
|
CEEMD |
UT |
0.942 |
12.84 |
0.930 |
12.42 |
0.954 |
12.64 |
0.942 |
13.37 |
|
MT |
0.965 |
10.92 |
0.958 |
11.00 |
0.978 |
11.31 |
0.964 |
11.23 |
|
|
ST |
0.762 |
15.28 |
0.780 |
15.84 |
0.772 |
15.65 |
0.764 |
16.62 |
|
|
PT |
0.932 |
14.08 |
0.918 |
14.14 |
0.935 |
14.26 |
0.928 |
15.86 |
|
Table 4. Average Execution Time of Various Methods
|
Method |
EMD-IT |
EEMD-IT |
CEEMD-IT |
|
Average Execution Time (Sec) |
16 |
25 |
40 |
(a)
(b)
(c)
Fig.5. Clean EEG Signals Using Different Thresholds During the Samples (600-1200) for the Signal on Electrode Fp2 By (A) EMD-IT, (B) EEMD-IT and (C) CEEMD-IT Methods.
(a)
(b)
Fig.6. Spectra of Clean and Raw EEG Signals by EMD-IT, EEMD-IT and CEEMD-IT Methods by (a) ST and (b) PT Functions
-
VII. Conclusions
This study focuses on comparing the effectiveness of various methods (EMD, EEMD, and CEEMD) of artifact correction in single-channel EEG signals using different threshold functions. Results of this study reveal that PT has shown acceptable performance for the removal of artifacts from single-channel EEG in all methods. CEEMD+PT correct the artifacts in blink regions and thereby keeping the neural activity in non-blink regions.
Hence, it is an optimum method of artifact correction though it is time-consuming than EMD+PT and EEMD+PT methods.
References Removal of ocular artifacts in single channel EEG by EMD, EEMD and CEEMD methods inspired by wavelet thresholding
- T. Zikov, S. Bibian, G. A. Dumont, M. Huzmezan, C. R. Ries. A wavelet based de-noising technique for ocular artifact correction of the electroencephalogram. In: IEEE Engineering in Medicine and Biology, IEMBS 2002; Houston, TX, USA: 23-26 Oct 2002. pp.98-105.
- V. Krishnaveni, S. Jayaraman, N. Malmurugan. Non adaptive thresholding methods for correcting ocular artifacts in EEG. Acad. Open Internet Journal 2004; 13.
- V. Krishnaveni, S. Jayaraman, L. Anitha, K. Ramadoss. Automatic identification and removal of ocular artifacts from EEG using wavelet Transform. Measurement science review 2006; 6: 45-57.
- Saleha Khatun, Ruhi Mahajan. Comparative study of wavelet-based unsupervised ocular artifact removal Techniques for single-channel EEG data. IEEE Journal of Transitional Engineering in health and medicine 2016; 4.
- Huang N E, Shen Z, Long S R. The empirical mode decomposition and the Hilbert spectrum for nonlinear and nonstationary Time Series Analysis. Proceeding of Royal Society 1998: IEEE. 454, pp.903-995, 1998.
- Raghavendra, D. Narayana Dutt. Correction of Ocular Artifacts in EEG Recordings using Empirical Mode Decomposition. Psychophysiology 2010; 47, pp.955-960.
- Mohammad Shahbakhti, Vahidreza Khalili, Golnoosh Kamaee. Removal of Blink from EEG by Empirical Mode Decomposition (EMD). 5th Biomedical Engineering International Conference (BMEiCON) 2012; Sunee Grand Hotel & Convention Center Muang, Ubon Ratchathani, Thailand. 5th -7th Dec 2012. pp. 1-5.
- A. Mert, A. Akan. EEG Denoising Based on Empirical Mode Decomposition and Mutual Information. IFMBE proceedings 2013; 41, pp.631-634, 2013.
- Zhu Xiao-jun, Lv Shi-qin, Liu-juan Fan, Xue-li Yu. The EEG Signal Process Based on EEMD. IEEE International Symposium on Intelligent Processing and Trusted Computing, Hubei, 22-23 Oct 2011; pp. 222-225.
- Z. Wu and N. E. Huang. Ensemble empirical mode decomposition: a noise-assisted data analysis method. In: Advances in Adaptive Data Analysis 2009; 1, 1-41.
- Marcelo A. Colominas, Gastón Schlotthauer, María E. Torres. Improved complete ensemble EMD: A suitable tool for biomedical signal processing. Biomedical Signal Processing and Control 2014; 14, 19-29.
- Marıa E. Torres, Marcelo A. Colominas, Gaston Schlotthauer, Patrick Flandrin. A Complete Ensemble Empirical Mode Decomposition with Adaptive Noise. In: IEEE Int. Conf. Acoustics, Speech, Signal Processing (ICASSP); Prague, Czech Republic, May 2011. pp. 4144-4147.
- Yannis Kopsinis, Stephen McLaughlin. Development of EMD- Based Denoising Methods Inspired by Wavelet Thresholding. IEEE Transactions on Signal Processing, 2009; 57, 1351-1362.
- Salim Lahmiri, Mounir Boukadoum. A Weighted Bio-signal Denoising Approach Using Empirical Mode Decomposition. Biomed Eng Lett 2015; 5, pp.131-139.
- Kevin T Sweeney, Sean F McLoone, Tom´as E Ward. The use of Ensemble Empirical Mode Decomposition with Canonical Correlation Analysis as a Novel Artifact Removal Technique. IEEE Transactions on Biomedical Engineering 2011; 1-9.
- Suguru Kanoga, Yasue Mitsukura. Eye Blink Artifact Rejection in Single-Channel Electroencephalographic Signals by Complete Ensemble Empirical Mode Decomposition and Independent Component Analysis. In. 37th Annual International Conference of the IEEE Engineering in Medicine and Biology Society (EMBC) 2015; Milan, Italy, 25-29 Aug 2015. pp. 121-124.
- D.L.Donoho. Denoising by soft-thresholding. IEEE Tran. On Inf. Theory 1995; 41, 613-627.
- Daniel Valencia, David Orejuela, Jeferson Salazar, Comparison Analysis between Rigrsure, Sqtwolog, Heursure and Minimaxi Techniques Using Hard and Soft Thresholding Methods. In: IEEE Bucaramanga, Colombia, 31st Aug -2nd Sep 2016. pp. 1-5.
- Mantosh Biswas, Hari Om. A New Soft-Thresholding Image Denoising Method. 2nd International Conf on Communication, Computing & Security 2012; Rourkela, 6th -8th Oct 2012. pp. 10-15.
- A.L. Goldberger, L.A.N. Amaral, L. Glass, J.M. Hausdorff, P.C. Ivanov, R.G. Mark,J.E. Mietus, G.B. Moody, C.-K. Peng, H.E. Stanley, PhysioBank, PhysioToolkit, and PhysioNet: Components of A New Research Resource For Complex Physiologic Signals, Circulation 101 (June (23)), e215–e220.2000.
