Renewed empirical formulas of Weibull distribution parameters estimates

Author: Asatryan D.G.
Journal: Компьютерная оптика @computer-optics
Section: Численные методы и анализ данных
Article in issue: 1 т.49, 2025.
Free access
The empirical formulas proposed in the literature for estimating the parameters of a two-parameter Weibull distribution, obtained using the equations of the moment method, are considered. It is noted that the formulas used to estimate the shape parameter take the form of various types of dependences on the coefficient of variation of the distribution. By modeling the empirical formulas selected for analysis, a comparative analysis of their errors relative to accurate numerical solutions of the moment method equations was carried out. A renewed empirical formula for the shape parameter is proposed. An approach to estimating the scale parameter is proposed, in which the empirical formula of the latter is reduced to the product of the standard deviation of the distribution by a power function of the coefficient of variation with an exponent equal to – 1.027. The results of applying the updated empirical formulas to numerical data obtained by modeling a random sample from the Weibull distribution are presented. It is shown that the accuracy of the proposed empirical formulas is quite high.
Weibull distribution, shape parameter, scale parameter, coefficient of variation, empirical formula, accuracy
Short address: https://sciup.org/140310449
IDR: 140310449 | DOI: 10.18287/2412-6179-CO-1475
Text of the scientific article Renewed empirical formulas of Weibull distribution parameters estimates
The Weibull distribution has been widely used in various fields of science and technology in solving problems of assessing reliability and determining the parameters of products, devices, and phenomena, describing the distribution of particle sizes, when working with digital images, and many others. Therefore, the development of methods for assessing the adequacy of the model and the parameters of the Weibull distribution are of significant interest to researchers involved in measurements and subsequent processing of experimental data in areas of various profiles.
When solving any applied problems using statistical methods, the question arises about the applicability of the mathematical model under consideration for studying the properties and patterns in the measured data. In this case, one of the main actions is the choice of a method for statistical estimation of distribution parameters based on a set of data. The choice of method is based on the volume of data being processed, available computing resources, the required accuracy of estimates, and the possibility of obtaining an adequate interpretation of the final results.
Therefore, many methods for estimating the parameters of the Weibull distribution have been proposed in the literature. In addition to the classical methods of maximum likelihood and the method of moments, there are methods based on the least squares method, Bayesian, approximate, empirical, and graphical methods, etc. For example, in [1] eleven are considered, in [2] ten, and in [3] there are seven methods, including hybrid ones and their comparative analysis is carried out on specific experimental material. Neural networks are also used for this purpose.
The most common are the maximum likelihood method and the method of moments, which have some attractive properties of both a theoretical nature and possibilities for practical application. However, as is known, both methods lead to the solution of the corresponding systems of transcendental equations, which inevitably slows down the process of parameter estimation. Therefore, empirical estimation methods based on the method of moments, which, of course, are less accurate, but are very simple to implement, have become widely used. At the same time, in practice, empirical formulas are often used to estimate parameters not from the original measured data, but from available estimates of their average and root-mean-square values. The latter circumstance gives these empirical formulas additional attractiveness, since it facilitates the use of old data, their transfer to other specialists, and the conduct of comparative studies. Apparently, this also explains the increased interest of researchers observed in the scientific and technical literature, especially in the field of studying the characteristics of wind flows [1-14].
Note that various simple empirical formulas have been proposed in the literature for estimating, mainly, the shape parameter of the Weibull distribution. To estimate the scale parameter, there are only isolated cases of proposals using empirical formulas. Therefore, in articles, next to the empirical formula for the shape parameter, the original transcendental equation of the moment method for the scale parameter is often placed.
In this work, by modeling the empirical formulas selected for analysis, a comparative analysis of their errors relative to the accurate numerical solutions of the moment method equations was carried out. A renewed empirical power-type formula for the shape parameter is proposed and a new empirical formula for the scale parameter is obtained.
1. Empirical formulas for evaluating the Weibull parameters
The density of the two-parameter Weibull distribution has the form
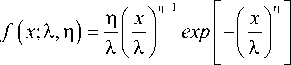
where n >0 — shape parameter, and X >0 - scale parameter.
Estimation of distribution parameters (1) by the moment method is carried out using the formulas for mathematical expectation and dispersion, which are equal, respectively ц = XГ(1 +1/ n), ст2 = X2 [Г(1 + 2/n) — r2 (1 +1/n)]2.
From here, we obtain two transcendental equations for the parameters n and X
Г ( 1 + 2/ n ) / ( Г 2 ( 1 + 1/ n ) ) — 1 = Y 2, (2)
X = ц / Г ( 1 + 1/n ) , (3)
where у = ст / ц - coefficient of variation of the distribution, and Г( - ) - is the Gamma function.
The accuracy of solving equations (2) and (3) is limited by the magnitude of the error in the numerical estimation of the Gamma function, which, with eight terms of approximation by orthogonal polynomials, can reach 3×10 –7 [15] and depends, of course, on the number of iterations with the inevitable use of successive approximation algorithms. In this case, the convergence of the process is guaranteed by the monotonic dependence of the estimates of parameters n and X on the coefficient of variation y [16]. Considering these circumstances, in this work we will take the numerical values of parameter estimates obtained by the moment method as accurate and use them when analyzing the accuracy of empirical formulas.
It should be noted that most of the empirical formulas for n proposed in the literature are based on the representation of the power-law dependence of the estimate of the parameter n on the coefficient of variation у = ст / ц of the form n = Y-a, (4)
where у = (j / ц is calculated from a sample of initial data. It is noteworthy that the literature offers different values for the coefficient a . The most common value is a =1.086 [1-9], in [10] the value a =1.0695 was proposed, and in [11] a = 1.0638.
There are also formulas of other types, for example, in [12] a formula equivalent to n = 0.9862 Y- 1 - 0983 is recommended, in [13] several options are given – n = 1.0461 Y- 1 - 049 , n = 1.271/ у and n = 1.1/ Y , and in [8] the formula n = 1.2/ Y was proposed.
The difference in the above formulas is apparently due to the difference in the methods for approximating solutions to equations (2) and (3) in the expected range of estimates of the parameter n. It is natural to expect that the accuracy of these formulas will also differ. Therefore, attention is paid to this issue in the literature. For example, in [13] the accuracy of modified versions of the formulas proposed there was studied depending on the established interval.
Note that, unfortunately, empirical formulas for estimating the scale parameter X are rarely found in the literature. We only have access to the formula
X = ц / ( 1 + 0.276 n- 0 - 776 ) , (5)
proposed in [12], and the formula
X = ц ( 0.568 + 0.433/ n ) - 1/ n , (6)
given in [6].
Thus, there is a need to find a new, simpler, and accurate empirical formula for estimating the scale parameter λ.
2. Shape parameter definition area
The accuracy of the empirical formula depends on the approximation method used in the corresponding interval of values of the shape parameter. These values, in turn, depend on the statistical characteristics of the physical quantity under study in each specific field of technology. Let us look at examples.
Analysis of experimental data on the study of wind speed, described in articles [1–14], indicates values of the shape parameter from several decimal fractions to several units.
We also give an example of the use of gradient methods in the analysis of the structural properties of an image using the Weibull distribution model for the gradient magnitude [17].
A series of calculations was carried out to estimate the shape parameter for images from various databases. Some results are shown in Tab. 1, from which we see that the values of the shape parameter in specific examples also vary from decimal fractions to several units.
Tab. 1. Examples of the shape parameter n definition area
|
Database |
Number of images |
Min |
Max |
|
TID2013 |
3000 |
0.46 |
1.82 |
|
Rock |
1015 |
0.39 |
1.71 |
|
Brodatz |
113 |
0.80 |
2.31 |
However, in other areas of science and technology that use models with the Weibull distribution, other values of the boundaries of the domain for determining the distribution parameters may appear that differ significantly from those given above. Therefore, in this work, all calculations were performed for a single, wide range of values of the shape parameter 0.1 ≤η≤ 10, which corresponds to the interval 0.120 ≤γ≤ 429.8 for the coefficient of variation. Of course, with a decrease in the interval of considered values of the shape parameter, the accuracy of the empirical formulas will also increase.
3. Empirical formula for the scale parameter
Numerical experiments were carried out to identify useful patterns in the model data to obtain an empirical formula for the scale parameter λ. To do this, first, by dividing both sides of formula (3) by σ and denoting λ_1 = λ / σ, we obtain
X! = '—7.
уГ( 1 + 1/ n)
Noting that the parameters X i and n depend only on the coefficient of variation y , a table of the values of these quantities was compiled and was calculated using formulas (2) and (7).
It was found that the correlation coefficient between П and X i , calculated from the data in this table, is greater than 0.9995. Since the right-hand side of (7) ultimately depends only on y, therefore, it can also be expanded in powers of this variable and take the form (4). In this case, the estimate of the scale parameter λ will take the form я л .
X = X^ .
Using regression analysis methods, an empirical formula for the parameter X i was obtained, which, after additional refinement by varying the indicator, takes the final form
X =Y- 1 - 027. (8)
Accordingly, the empirical formula for the scale parameter will take the form X = d y - 1.027 •
4. Analysis of the accuracy of empirical formulas
To compare the accuracy of the mentioned empirical formulas, we calculated the maximum and mean-squared error (MSE) of the values given by the empirical formula relative to the “exact” parameter values in the considered interval of variation of n .
By varying the value of n with a sufficiently small step, it is shown that the optimal value of the shape parameter in (4) is a = 1.0894, and the optimization of the formulas n = 1.271/ Y , n = 1.1/ Y and n = 1.2/ Y leads to the expression n = 1.173 / Y .
Thus, the updated empirical formula for the shape parameter is n = Y-70”4. (9)
The results of calculations using the remaining empirical formulas mentioned are shown in Tab. 2.
As can be seen from the table, the most accurate is the empirical formulas for the shape parameter n = Y-1.0894 , and for the scale parameter - n = Y 1.027
.
It should be noted that high values of the maximum or MSE indicators of some empirical formulas, if necessary, could be reduced by narrowing the interval of variation of the shape parameter and performing an appropriate analysis of the results.
Tab. 2. Accuracy indicators of the empirical formulas under consideration
|
Empirical formula |
Maximal error |
MSE |
|
n = y - 1 . 086 |
0.152 |
0.048 |
|
n = j 1,891 |
0.151 |
0.037 |
|
n = 0.9862* Y-L 0”3 |
0.155 |
0.048 |
|
n = 1.0461* Y 49 |
0.325 |
0.171 |
|
n = y ■' |
0.456 |
0.263 |
|
in = y -L069 5 |
0.340 |
0.205 |
|
n = 1.173/ Y |
0.245 |
0.156 |
|
n = 1.2/ Y |
0.306 |
0.204 |
|
Formula (5) |
0.225 |
0.136 |
|
Formula (6) |
0.255 |
0.134 |
|
λˆ1=γˆ -1.027 |
0.065 |
0.046 |
Below is a fragment of a table of exact and approximate values of the Weibull distribution parameters, calculated using the above formulas (2), (3), (8) and (9).
Tab. 3. Exact and approximate values of parameter estimates y П and A i
|
Y |
n |
n |
X 1 |
λ1 ' |
|
429.8 |
0.1 |
0.0014 |
0.0024 |
0.0020 |
|
2.236 |
0.5 |
0.416 |
0.470 |
0.438 |
|
1.000 |
1 |
1.000 |
1.051 |
1.000 |
|
0.523 |
2 |
2.026 |
2.011 |
1.946 |
|
0.363 |
3 |
3.015 |
2.892 |
2.831 |
|
0.229 |
5 |
4.979 |
4.583 |
4.544 |
|
0.168 |
7 |
6.977 |
6.255 |
6.246 |
|
0.120 |
10 |
10.064 |
8.754 |
8.824 |
Thus, we have obtained updated empirical formulas that are easy to implement for statistical estimation of Weibull distribution parameters.
5. Application to model data
To illustrate the results of applying the updated empirical formulas to numerical data, a simulation of a random sample from a Weibull distribution was carried out, implemented using the well-known inverse transformation procedure based on the use of a uniform distribution. The generation of samples was carried out for different initial values of the shape and scale parameters of the Weibull distribution. Table 4 shows examples of parameter estimates obtained by the above-mentioned “exact” and updated empirical formulas for samples with different sizes n. We see that the accuracy of the empirical formulas is quite consistent with the estimates given in Tab. 4.
Conclusion
The article discusses various empirical formulas frequently found in the literature, proposed as estimates of the parameters of the Weibull distribution. The appendices mainly consider approximate formulas for the shape parameter obtained from the equations of the moment method. For the scale parameter of similar formulas - units. The article experimentally studies the accuracy of these formulas by comparing them with accurate values obtained by approximate methods by solving the well-known transcendental equations of the moment method for the parameters of the Weibull distribution. A renewed expression for the empirical formula for estimating the shape parameter is obtained. A new approach to estimating the scale parameter and the corresponding empirical formula is proposed. The proposed formulas can be applied to problems of statistical processing of measurement data on the properties of materials, assessing the reliability of machine parts and components, studying wind parameters, and other areas of science and technology.
Tab. 4. Numerical examples
|
n |
η |
η |
η e |
λ |
л λ1 |
λ e |
|
50 |
2.0 |
2.147 |
2.173 |
1.5 |
1.636 |
1.618 |
|
100 |
2.0 |
1.928 |
1.956 |
1.5 |
1.539 |
1.530 |
|
500 |
2.0 |
1.981 |
2.008 |
1.5 |
1.501 |
1.490 |
|
1000 |
2.0 |
2.003 |
2.030 |
1.5 |
1.511 |
1.499 |
|
50 |
2.5 |
2.608 |
2.627 |
0.5 |
0.536 |
0.527 |
|
100 |
2.5 |
2.365 |
2.389 |
0.5 |
0.510 |
0.503 |
|
500 |
2.5 |
2.472 |
2.494 |
0.5 |
0.500 |
0.493 |
|
1000 |
2.5 |
2.496 |
2.518 |
0.5 |
0.503 |
0.495 |
