Reproducing an Alternative Model of Intercultural Sensitivity for Undergraduates from Taiwan and Hainan

Author: Jia-Fen Wu
Journal: International Journal of Modern Education and Computer Science (IJMECS) @ijmecs
Article in issue: 1 vol.8, 2016.
Free access
An alternative model of intercultural sensitivity replicated from Chen and Starosta's five-factor model of Intercultural sensitivity was replicated validated at eight universities in Taiwan and Hainan, China. Both Confirmatory factor analysis and exploratory factor analysis were conducted to inspect the construct validity of the alternative model of Intercultural Sensitivity. Results indicated that three models fitted the data and the values of indicators were deemed acceptable; however, three-factor model of intercultural sensitivity with 10 items significantly fitted the data better than Chen and Starosta's five-factor model, Wu's four-factor model, and the revised two-factor model. This three-factor model, an alternative model, consists of three factors based on 10 items from the 24-item Intercultural Sensitivity Scale by Chen and Starosta; the reliability coefficient was .771, demonstrating high internal consistency. Participants from both Taiwan and Hainan represent ethnic Chinese who, although sharing similar cultures, still present cultural differences. This present study suggests an alternative model of the Intercultural Sensitivity that fits the characteristics of a sample of undergraduates from Hainan, China and Taiwan by reproducing Chen and Starosta's ISS.
Intercultural Sensitivity (IS), Confirmatory Factor Analysis (CFA), Exploratory Factor Analysis (EFA)
Short address: https://sciup.org/15014825
IDR: 15014825
Text of the scientific article Reproducing an Alternative Model of Intercultural Sensitivity for Undergraduates from Taiwan and Hainan
Published Online January 2016 in MECS DOI: 10.5815/ijmecs.2016.01.01
-
I. Introduction
The Intercultural sensitivity scale (ISS), a well-known instrument, is broadly employed for measuring individual’s sensitivity towards culturally-distinct counterparts. The original ISS by Chen and starosta (2000) contains 24 items for five factors: Interaction
Engagement , Respect for Cultural Differences ,
Interaction Confidence, Interaction Enjoyment, and Interaction Attentiveness. Since the ISS has been administrated in many countries over the world, it has several language translations. Accordingly, two important things for ISS should be taken into account: first of all, it is vital to investigate the accuracy of a new language version of ISS, and the translation accuracy can ensure the content message comes through just as well in a foreign culture as it does domestically. Second, only by using a model that fits the data well can it provide good answers to the underlying research questions under investigation. The factor structure of the original ISS model formulated by Chen and Starosta (2000) was not always sustained across various versions. Thus, it is important to ensure the similarity of the factor structure of different ISS versions because the factor structure of an ISS model represents the theoretical framework of the measurement and has a fundamental analysis for other purposes.
-
1) . The accuracy of language version of ISS
Penbek, Yurdakul, and Cerit (2009) recommended that the survey can be conducted in the respondents’ native language to avoid misunderstanding of some statements when using ISS in an EFL setting. To ensure the accuracy of a language version of an instrument, both translation and back-translation techniques should be applied. Generally speaking, two English majored experts were invited to translate all the items of an instrument from English into Chinese and then back-translate them from Chinese into English. Since Chen and Starosta’s ISS is an easily administered scale, Chinese versions of ISS were translated and used. For instance, Peng’s (2005) Chinese version ISS has been used for years in Asia, such as China and Thailand, and is proven to be reliable and valid, with .86 reliability coefficient. Wu (2009a, 2009b) modified part of Peng’s expressions of Chinese ISS for Taiwanese. On all the twenty four measures, the reliability analysis showed an overall Chronbach’s α of .85.
Accuracy of translation is not only an important issue for two different languages, but also vital for ethnic Chinese living in two regions, such as Taiwan and Hainan, China. Even though people in Taiwan and Hainan, China represent ethnic Chinese and share common traditions such as language, characters, customs, etc., some differences in the use of speaking convention and expressions should be taken into account when administering the same questionnaire in these two regions. Lee (2009) states this as, “the invisible and deeper sense of a target culture” (p.78). Peterson (2004) defines the little C culture as the culture focusing on common or minor themes. That is, little “c” refers to the routine aspect of everyday life (Choudhury, 2013), including themes such as attitudes, beliefs, assumptions, opinions, viewpoints, preferences or tastes, gestures, body posture, use of space, clothing styles, food, hobbies, popular music, and popular issues, and certain knowledge like, trivia, facts, etc. Thus, the most adequate Chinese ISS version is the one which could express each item of a questionnaire clearly and correctly to the respondents in these two regions.
-
2) . The factor structure varied in various populations
In most replication studies, results of exploratory factor analysis (EFA) show that the factor structure extracted could not be similar to the original ones when developing a new language version with different populations. A replication study by Fritz, Möllenberg, and Chen (2002) in Germany successfully reproduced the five-factor structure and the results concluded the ISS is valid. On the contrary, the second replication study by Fritz, Graf, Hentze, Möllenber, and Chen (2005) did not produce satisfying results and cast doubt on Chen and Starosta’s model of IS.
To develop a new language version, scholars recommended EFA is employed to directly analyze the data from different countries or populations to examine whether the factor structure of a new version is similar to the original one. For example, Taman’s study (2010) among Malaysia participants showed that Chen and Starosta’s five-factor 24 item ISS did not produce an adequate model fit while performing a CFA. Instead, he reproduced a three-factor structure model retained from 21 items of the ISS. Also, he suggested that researchers should be wary of using Chen and Starosta’s ISS in nonWestern cultural settings because Chen and Starosta’s five-factor structure model was neither generic nor culture-free. Tsereteli’s study (2011) extracted eight factors for Georgian students from Chen and Starosta’s five-factor model, suggesting “the diversity and confounding factors make it difficult to define the picture of intercultural sensitivity of Georgian youth population,” and the eight factors extracted indicated “ the specificity of intercultural sensitivity in Georgian culture.”
Evidence from Tamam’s (2010) and Tsereteli’s (2011) studies have demonstrated that the original factor structure of IS was not sustained across different versions. In addition, factor combination and split were found through EFA. Tamam (2010) states the rationale for such a combination could be conceptual overlaps of the five factors while used in different cultures. Results of Taman and Tsereteli’s studies proved that Chen and Starosta’s ISS Model was a scale neither adequate nor “free of culture.” Tamam (2010) also pointed out that “the scale needs further validation tests. ” In fact, Chen and Starosta (2000) recommended reviewing the ISS with other populations. However, both Tamam and Tsereteli did not perform CFA to confirm EFA data; thus, their conclusions need to be reexamined.
-
3) . Validating ISS by EFA and CFA
Researchers of cross-cultural studies usually attribute any discrepancy between EFA and CFA solutions to cultural differences among different populations (Rao and Sachs, 1999). VanProoijen and VanDer Kloot (2001) state, CFA, a theory-driven technique (Bollen, 1989), may cross-validate the factor number of a test yield by EFA, a data-driven technique. In other words, the reason for performing both EFA and CFA is to find a general factor pattern by EFA and cross-validate the EFA results by CFA. In Wu, Lee, and Yao’s (2007) replication study of the SF-36 Taiwan version (scale), they proposed that EFA was performed first and CFA was performed to cross-validate the EFA results in order to exhaustively investigate the factor structure of the SF-36Taiwan version. Wu’s (2009a, 2009b) ISS Chinese version has been widely used in Taiwan; however, the factor structure has not been fully investigated. Wu’s (2015) study developed a four-factor structure of ISS model with 13 items, using both EFA and CFA. The results of her study successfully develop an alternative ISS model for Taiwanese population and confirm the conclusion reached from Tamam and Tsereleli’s research.
This study conducted both EFA and CFA to examine the factor structures of the ISS Taiwan version with population from Taiwan and Hainan, China. The researcher decided to perform EFA first in order to understand if the factor structure of the ISS Taiwan version is exactly the same as the original model of ISS. For the respondents, the Chinese ISS version applied would be a new version based on both Peng’s (2006) and Wu’s (2009a) versions. The abundant data would be randomly divided into two samples for performing EFA and then CFA. With two independent analyses on these two separate samples, the researcher was able to make a reasonable and convincing argument based on the factor structure of the Taiwan-Hainan ISS version.
-
II. Methods
-
1) . Sampling &Data Collection
Table 1 summarized the number and percentage of two independent samples. A total of 448 respondents, 238 undergraduates (121 English majors and 117 Business majors) from three universities in Hainan and 210 undergraduates (210 Applied Foreign Language majors) from five technological universities in southern Taiwan, were involved in this study. In this study, 112 (24 males and 88 females) out of the 448 respondents were randomly selected as one independent sample for exploratory factor analysis; the other 336 respondents, 62 males and 274 females, were used for confirmatory factor analysis. There were179 undergraduates (91 English majors and 88 Business majors) from three universities in Hainan and 157 undergraduates (157 Applied Foreign Language majors) from five technological universities in southern Taiwan. As shown in Table 1, the demographic data for the EFA and CFA samples are quite similar.
-
2) . Measurement
The Chinese version of 24-item Intercultural
Sensitivity Scale by Chen and Starosta (2000) applied in this study was adapted from both Peng’s (2005) and Wu’s (2009b) Chinese version in order to increase reliability (Penbeck, Yurdakul, and Cerit, 2009). Since the two Chinese versions mentioned above were proven to be valid and reliable, two experts were invited to modify the expressions of the 24 items in order to determine an adequate version for the respondents; one from Taiwan and the other one Mainland China. Five undergraduates from Mainland China and five undergraduates from Taiwan were invited to fill the new Chinese version and ensure the accuracy of this new Chinese version to be proper for measurement in the present study. The respondents in this study were required to complete the 24 items of the ISS in Chinese by indicating their degree of agreement on a five-point Likert scale (1=strongly disagree, 2=disagree, 3=uncertain, 4= agree, 5= strongly agree). The higher scores on each measure are suggestive of more sensitivity to cultural counterparts. They were also asked to provide their demographic information, such as, age, grade, gender, major, intercultural experience and so on.
-
3) . Procedures for data analysis
Three phases of analysis were carried out. First, a confirmatory factor analysis (CFA) was performed to determine the goodness of fit of 2 models, including five-factor of ISS with 24 items by Chen and Starosta (Model 1) and four-factor of ISS with 13 items by Wu (2015)(Model 2). According to the CFA results, the researcher would determine which structure model has the best fit for Taiwan-Hainan populations. Once the CFA results of the two models showed that they poorly fitted with these data, the researcher then would proceed phase two to conduct an EFA with 24 items. Second, to reproduce a satisfying model, an exploratory factor analysis was first performed to examine the 24 items and yield an observed factor structure. Third, a series of CFA was conducted to examine the 24 items of ISS and the results of model fit indices would be used to judge if the new model would be better than the five-factor model by Chen and Starosta (2000) and the thee-factor model by Wu (2015). Moreover, the Composite Reliability (CR) and Average Variance Extracted (AVE) would be tallied to ensure the reliability and validity of the proposed models. Convergent validity can be proved when all factor loading of one construct be higher than 0.7, and average variance extracted (AVE) should be higher than 0.5 for all constructs of a measurement model (Chin, 1998). The alternative model for Taiwan and Hainan populations should meet these requirements.
-
III. Results
-
1) . Phase 1: CFA 1 with Five-factor Model and Four-factor Model
AMOS 20.0 was employed for a series of CFA to calculate the fit of the two proposed models of
Intercultural sensitivity: Chen and Starosta’s five-factor model and Wu’s four-factor model. First, based on five-factor ISS Model, CFA results failed to produce a good fit. As shown in Table 1, the data were examined in the five-factor model by Chen and Starosta (hereafter referred to as Model 1) and the result showed most indices of Model 1 did not meet the criteria ( χ2 = 489.505, χ2/df = 2.023, RMSEA=.055, SRMR=.0637, CFI=.85, IFI=.853, GFI=.890, AGFI=.864), suggesting the model poorly fitted the data. This model was rejected. Therefore, EFA should be performed directly and the EFA result was set into CFA to examine its model fit. The four-factor model with 13 items by Wu (2015), (hereafter referred to as Model 2) revealed an acceptable fit with the data analyzed, χ2 = 117.122, χ2/df = 1.985, RMSEA=.054, SRMR=.0565, CFI=.932, IFI=.933, GFI=.949,
AGFI=.921. However, CFA results revealed that items 12, 14, and 15 had low loadings (<0.5) as shown in Figure 1. To achieve a better goodness of fit, deleting deviating items is the preferred solution. Furthermore, the values of CR and AVE of 3 models presented in Table 3 indicated that only the first factor Interaction Confidence met the requirements (CR= 0.827, AVE= 0.546), and the rest three factors did not. According to the CFA results, the two proposed ISS models: Model 1 (Chen and Starosta’s five-factor model) and Model 2 (Wu’s four-factor model) were found to fit the data poorly. In order to produce an alternative model, Model 1 with 24 items and Model 2 with 13 items should be reexamined by EFA in phase 2.
-
2) . Phase 2: EFA to reproduce an adequate model
First, the principal component analysis with Varimax rotation using the orthogonal option was performed to reinterpret Chen and Starosta’s 24 items and produce an alternative model. The Kaiser-Meyer-Olkin (KMO) value was 0.744, exceeding 0.6, the recommended value (Field, 2005); Bartlett’s Test of Sphericity reached statistical significance at the level of .000. Results of KMO and Bartlett’s Test indicated that the collected data was suitable for factor analysis (KMO =.744, p=.000). With principal component analysis, three proposed factors extracted 10 items through administering EFA. Fourteen items were excluded. The percentage of total variance explained by the three factors was 62.418 %. Four items loaded on Factor 1, Interaction Confidence , with eigenvalues of 2.438 and the percentage of variance explained by Factor 1 was 24.381 %; three items loaded on Factor 2, Respect for cultural differences , with eigenvalues of 1.966 and the percentage of variance explained by Factor 2 was 19.660 %; three items loaded on Factor 3, Interaction Engagement and Attentiveness , with eigenvalues of 1.838 and the percentage of variance explained by Factor 3 was 18.376 %). The Cronbach’s Alpha values for three factors in Model 3 were 0.797, 0.783, and 0.753, respectively. Second, the results of the principal component analysis with Varimax rotation using the orthogonal option reinterpret Model 2 (Wu’s 13-item model) of ISS to establish a three factor structure. Results of the Kaiser-Meyer-Olkin and Bartlett’s Test indicated =.771, (.000). The percentage of total variance
explained by the two factors was 52.29%. Three items (items 12, 14, and 15) with low factor loading in Model 2 were firstly removed (<.50); the researcher performed EFA with the rest 10 items again to form a new model. Based on the EFA results, item 1 with low loading was removed to form Model 4 (see Figure 3), with Cronbach’s alpha=.730. Two factors extracted were: Interaction Confidence (items 3, 5, 6, and 10) and
Respect and Attentiveness (items 8, 9, 13, 16, and 24). The Cronbach’s Alpha values for three factors in Model 4 were 0.797, and 0.712 respectively.
-
3) . Phase 3: The second CFA, CR, and AVE to confirm an adequate model
The best way is to compare Model 3 and Model 4 in a CFA framework, and then draw the stronger conclusion of which version structure is better. In this way, the observed factor structure can also be cross-validated in a CFA model. The two models proposed in this study were examined with EFA and CFA. All the CFA details of two proposed models in this study were summarized in Table 2. Three-factor of Model 3 with 10 items (Figure 2) and two-factor of Model 4 with 9 items (Figure 3) were examined with the CFA data respectively. Model 3 presented a good fit with the data, χ2 = 57.488, χ2/df = 1.796, RMSEA=.049, SRMR=.0444, CFI=.960, IFI=.961, GFI=.968, AGFI=.944. All of the model fit indices supported the goodness of fit. Model 4 also revealed a better fit to with the data than Model 2, χ2 = 60.747, χ2/df = 2.336 RMSEA=.063, SRMR=.0564, CFI=.943,
IFI=.944, GFI=.962, AGFI=.934. One index of Model 4, GFI (.962), was above the benchmark of 0.95 and most indices were acceptable (CFI=.943, IFI=.944, and
AGFI=.934 >.90), but its RMSEA (0.063>0.05) and
SRMR (0.0564>0.05) did not meet the criteria. Last, the composite reliability (CR) and average variance extracted (AVE) of factors in Model 2, Model 3, and Model 4 were tallied (shown in Table 3). As shown in Table 3, both the composite reliability (CR) and Average Variance Extracted (AVE) of the three factors in Model 3 were above the threshold (CR value >.7, and AVE value >.5). In Model 2, one factor, Interaction Engagement and Attentiveness , failed to present the acceptable statistics in CR ( Interaction Engagement & Attentiveness , 0.565<0.7); only one factor, Interaction Confidence , met the criteria of AVE (0.546) and three factors failed to present the acceptable statistics in AVE (AVE values were 0.458, 0.306, and 0.466 for Respect and Attentiveness , Interaction Engagement & Attentiveness , and Interaction Enjoyment , respectively). Model 4 contains two factors, Interaction Confidence and Respect and Attentiveness , and both composite reliability (CR) in the two factors were above the threshold (CR values were .855, and .814 for Interaction Confidence and Respect and Attentiveness , respectively). In Model 4, the CR values of two factors were above 0.7; however, only one factor, Interaction confidence met the criteria of AVE 0.5.The AVE value for Interaction Confidence was above the requirement (AVE=.599), but Respect and Attentiveness failed to show the required statistics in AVE. Compared with
Model 2 and Model 4, the Goodness-of-fit of Model 3 was much stronger than other models.
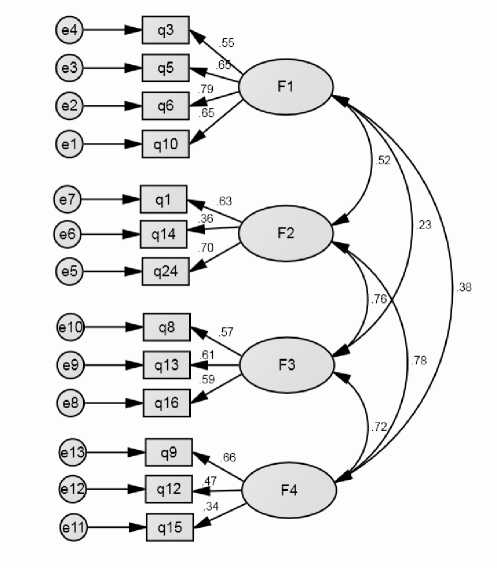
Fig.1. Data with Wu’s 13-item Model of ISS (Model 2)
Note: F1: Interaction Confidence; F2: Interaction Engagement and Attentiveness; F3: Respect for Cultural Differences; F4: Interaction Enjoyment.
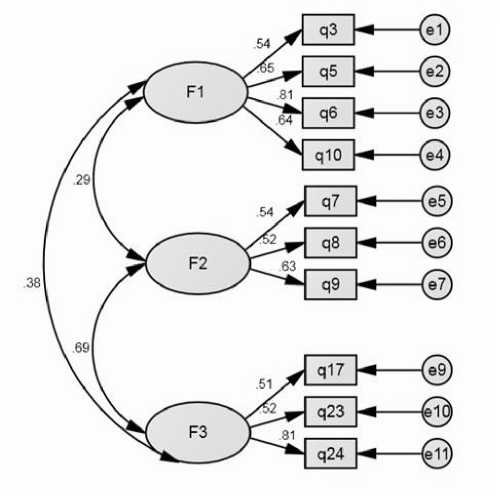
Fig.2. Estimation of SEM Model 3 with 10-item of ISS
Note: F1: Interaction Confidence; F2: Interaction Engagement and Attentiveness; F3: Respect for Cultural Differences; F4: Interaction.
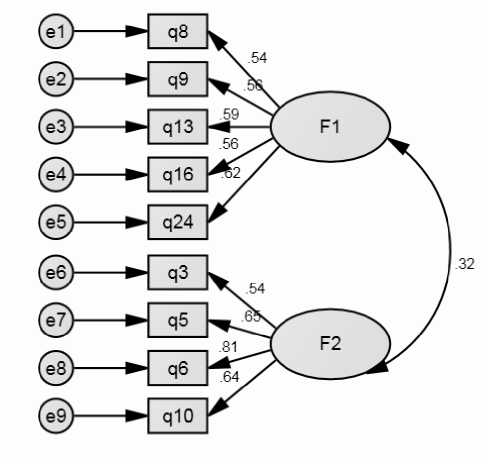
Fig.3. Estimation of SEM Model 4 with 9-item of ISS
Note: F1: Interaction Engagement and Attentiveness; F2: Interaction Confidence; F3: Respect for Cultural Differences; F4: Interaction.
-
IV. Discussions and Conclusions
In this study, factor structure of the ISS was investigated by both EFA and CFA. After reviewing relevant literature, it is apparent that many replication studies of ISS have only examined the data to yield a new factor structure by performing EFA, have neglected the validity of the factor structure, and have rarely conducted both EFA and CFA to confirm the factor structure of ISS. There has also been no study that had looked at administering ISS with populations in Taiwan and Hainan. Thus, the main strength of this study lies in the application of both EFA and CFA to make an alternative model for Taiwan and Hainan populations. According to the results of this study, three issues should be discussed as follows:
-
1. The original model of ISS was not sustained across different versions. The accuracy of Chinese version was influenced by little c cultures.
-
2. One factor would be factored with the other one through EFA with different population data.
-
3. Model 3 is the Taiwan-Hainan model, which meets most model fit indices.
The results rejected the five-factor model by Chen and Starosta (2000) in the Taiwan-Hainan cultural context, due to the failure to reproduce Chen and Starosta’s theoretical model, using CFA. The results echoes the results of Tamam’s (2010) and Wu’s (2015) studies for the original five-factor model of ISS formulated in America, using American college student samples, which might not be adequate for diverse populations and was not sustained across different versions. The results also rejected four-factor model by Wu (Model 2), using Taiwanese samples. Model 2 was supposed to be the best fit for the populations in this study because the researcher is convinced that ethnic Chinese have many characteristics and practices in common. However, the results indicated that cultural differences exist between people in Taiwan and Hainan even though they represent ethnic Chinese and share most traditions. This echoes theory of little c culture which is invisible but remains in the routine aspect of daily life. To some extent, the differences of spoken or written Chinese in Taiwan and Mainland China could cause conflict or misunderstanding without adequate explanation. Although Chen and Starosta’s ISS was widely used in China and Taiwan, all of the studies were conducted with samples from either Taiwan or China, not populations from both. The greatest strength of this study is that the sample includes students from both Taiwan and Hainan. Moreover, the accuracy of Chinese ISS version is proven to be reliable and valid because the 24 items of ISS were investigated by experts and respondents from Taiwan and Mainland China in advance.
Evidence from EFA results show items of one factor might be factored with the other. That is, the items of one factor were reassigned to the other instead of remaining in the same factor. EFA results show one factor would be factored with the other through EFA with different population data. In regards to the construct of intercultural sensitivity, the results of this study confirmed the three factors of Interaction Confidence , Respect & Interaction Enjoyment , and Interaction Engagement & Attentiveness in Model 3. In three-factor structure, Model 3, some items in Interaction Enjoyment were factored with items in Respect for cultural differences . Although some items were removed, the items remained still presented the characteristics of the five factors. In Model 4, the two-factor structure, items in Respect for cultural differences were factored with items in Interaction Attentiveness. This situation is common and supported by scholars and previous studies. For instance, Tamam’s study (2010) produced a three-factor model by EFA and found the items in one factor were factored with another due to different population data. Wu’s study (2015) also reported that the Taiwan version scale was not consistent with the original factor structure by Chen and Starosta (2000).
In Table 2, the comparisons of the four models were listed. Compared with Model 2 and 4, Model 3 is proven to be a satisfying model for most of its indices perfectly meet the recommended criteria: including Model fit indices, CR and AVE values, and the number of items in a scale. Model 3, three-factor structure model, and Model 4, two-factor structure model, show strong evidence for them to be the alternative models for Taiwan and Hainan populations. However, Model 3 has the most adequate model fit indices for this study, except the chi-square value was 57.488 (p=.004 <.01), which tends to be influenced by a large sample. The general cult-offs for accepting a model for those indices CFI, IFI, GFI and
AGFI were equal to or greater than .95 (Hu and Bentler, 1999). Same as Model 3, Model 4 has most acceptable fit indices except chi-square value. To be more specific, the chi-squared test was readily influenced by the large sample size (more than 200) and result in a poor fit. Therefore, Model 3 and Model 4 were acceptable models based on Model fit indices. Since all of the closeness of fit statistics in Model 3, and Model 4 were well with acceptable ranges, it is hard to determine which one is better than the other. Thus, the values of the composite reliability (CR) and Average Variance Extracted (AVE) in these three models were further calculated in order to confirm which model achieves the goodness of fit. Compared with Model 4, CR and AVE values in Model 3 met the criteria (>0.7 and >0.5, respectively). Xu and Ma (2014) pointed out that long items lead to higher reliability of the instrument. Since Model 3 includes more items in the scale than Model 4, the results suggest Model 3, a three-factor model, is the alternative model for Taiwan-Hainan version.
Table 1. Demographic data for the EFA and CFA Samples
|
Demographic variables |
EFA respondents |
CFA respondents |
All respondents |
|
|
Number of respondents (n) |
112 |
336 |
448 |
|
|
Regions |
Taiwan |
53 (47.3%) |
179 |
238 |
|
Hainan |
59 (52.7%) |
157 |
210 |
|
|
Genders |
Male |
24 (21.4%) |
62 |
86 |
|
Female |
88 (78.6%) |
274 |
362 |
|
|
Departments Business |
29 (25.9%) |
88 |
117 |
|
|
English |
30 (26.8%) |
91 |
121 |
|
|
Applied Foreign Language |
53 (47.3%) |
157 |
210 |
|
|
Table 2. Goodness-of-fit Indices of the ISS Models |
||||
|
N=336 |
Factor Items χ2 |
χ2/df RMSEA |
SRMR CFI IFI |
GFI AGFI |
|
MODEL 1 |
5 24 489.505 |
2.023 .055 |
.0637 .850 .853 |
.890 .864 |
|
MODEL 2 |
4(4,3,3,3) 13 117.122 |
1.985 .054 |
.0565 .932 .933 |
.949 .921 |
|
MODEL 3 |
3(4,3,3) 10 57.488 |
1.796 .049 |
.0444 .960 .961 |
.968 . 944 |
|
MODEL 4 |
2(4,5) 9 60.747 |
2.336 .063 |
.0564 .943 .944 |
.962 .934 |
Requirement
< 3 <0.05 <0.05 >0.95 >0.95 >0.95 >0.95
Table 3. Composite Reliability and Average Variance Extracted of Model 1, 2, 3, and 4.
|
Composite Reliability CR |
Average Variance Extracted AVE |
||
|
MODEL 2 |
Interaction Confidence |
0.827 |
0.546 |
|
Respect and Attentiveness |
0.716 |
0.458 |
|
|
Interaction Engagement & |
0.565 |
0.306 |
|
|
Attentiveness |
|||
|
Interaction Enjoyment |
0.720 |
0.466 |
|
|
MODEL 3 |
Interaction Confidence |
0.856 |
0.601 |
|
Respect & Interaction Enjoyment |
0.810 |
0.573 |
|
|
Interaction Engagement & |
0.762 |
0.525 |
|
|
Attentiveness |
|||
|
MODEL 4 |
Interaction Confidence |
0.855 |
0.599 |
|
Respect and Attentiveness |
0.814 |
0.469 |
|
Acknowledgement
References Reproducing an Alternative Model of Intercultural Sensitivity for Undergraduates from Taiwan and Hainan
- Chin, W. W. (1998). Issues and opinion on structural equation modeling. MIS Q, 70.
- Choudhury, M. H. (2013). Teaching Culture in EFL: Implications, Challenges and Strategies. IOSR Journal of Humanities and Social Science (IOSR-JHSS), 13(1), 20-14.
- Garson, G. D. (2001). Guide to writing empirical papers, theses, and dissertations. CRC Press.
- Hu, L. and Bentler, P. M. (1999). Cut-off criteria for fit indexes in covariance structure analysis: conventional criteria versus new alternatives. Structural Equation Modeling, 6, 1-55.
- Lee, K.-Y. (2009).Treating culture: What 11 high school EFL conversation textbooks in South Korea Do, English Teaching: Practice and Critique, 8, 76-96.
- Penbek, S.,Yurdakul, D., and Cerit, A.G. (2009) Intercultural communication competence: A study about the intercultural sensitivity of university students based on their education and international experiences. European and Mediterranean Conference on Information Systems, Izmir, Turkey.
- Chen, G. M. and Starosta, W. J. (2000). The development and validation of the intercultural communication sensitivity scale. Human Communication, 3, 1-15.
- Peterson, B. (2004). Cultural intelligence: A guide to working with people from other cultures, Yarmouth, ME: Intercultural Press.
- Wu, C.-H., Lee, K.-L., and Yao, G. (2007). Examining the hierarchical factor structure of the SF-36 Taiwan version by exploratory and confirmatory factor analysis. Journal of Evaluation in Clinical Practice, 13, 889-900.
- Field, A. (2005). Discovering Statistics Using SPSS. London: Sage.
- Fritz, W., Graf, A., Hentze, J., Mollenberg, A., and Chen, G. M. (2005). An examination of Chen and Starosta's model of intercultural sensitivity in Germany and the United States. Intercultural Communication Studies, 14(1), 53-65.
- Fritz, W., Möllenberg, A., and Chen, G. M. (2002). Measuring intercultural sensitivity in different cultural contexts. Intercultural Communication Studies, 11, 165-176.
- Peng, S. Y., Rangsipaht, S., and Thaipakdee, S. (2005). Measuring intercultural sensitivity: A comparative study of ethnic Chinese and Thai nationals. Journal of Intercultural Communication Research, 34 (2), 119 -137.
- Peng, S.Y. (2006). A comparative perspective of intercultural sensitivity between college students and multinational employees in China. Multicultural Perspectives, 8(3), 38-45.
- Xu, Z. X., and Ma, H. K. (2014). Moral Identity in Chinese Context: Construction and Validation of an Objective Measure. Research on Humanities and Social Science, 4(2), 34-45.
- Tamam, E. (2010). Examining Chen and Starosta's Model of Intercultural Sensitivity in a Multiracial Collectivistic country. Journal of Intercultural Communication Research, 39, 3, 173-183.
