Reproduction of Human Capital in the Arctic Regions of Russia: Socio-Cultural Context

Author: Markin V.V., Silin A.N., Malinina K.O.
Journal: Economic and Social Changes: Facts, Trends, Forecast @volnc-esc-en
Section: Social and economic development
Article in issue: 5 т.14, 2021.
Free access
The formation and reproduction of human capital, as the most important prerequisite for modern development, has not only sectoral, but also regional features. The article, which continues a series of our works on human capital in the conditions of the Arctic zone of the Russian Federation, considers the influence of socio-cultural factors on human capital in the Arctic territories. The aim of the study is to present a new approach to the role of socio-cultural factors (foundations and components) in human capital development in the Arctic regions for a new (neo-industrial) stage of their exploration. In this regard, we clarify conceptual foundations of the studies on human capital presented in the works of researchers from Russia and other countries. Within a certain theoretical and methodological framework, we analyze, compare, and summarize the findings of a sociological study conducted in March – May 2018 in the Arkhangelsk Oblast (in the Arctic territories) and Yamalo-Nenets Autonomous Okrug; to this end, we use methods such as mass surveys and statistical data analysis. We provide data that characterize human capital of the Northerners in terms of their financial situation; we prove the existence of a direct dependence on regional (higher – in Yamalo-Nenets Autonomous Okrug), sectoral (especially oil and gas enterprises), socio-professional (especially managers, highly qualified specialists, state and municipal employees) aspects. With the use of multidimensional measurements, we show the interrelations and individual dependencies of the variables that characterize education, health and socio-professional status in the structure of human capital in the surveyed regions. We also focus our attention on the role of value orientations in the formation and reproduction of human capital. In conclusion, we note that the impact of socio-cultural factors on human capital is ambivalent: on the one hand, they act as a fundamental basis, on the other hand, some of them (education, work motivation, etc.) act as structural components. We propose measures aimed at strengthening national and regional policies (including investment) in the development of human capital in the Russian Arctic
Human capital, Arctic regions of Russia, socio-cultural factors, sociological approach, multidimensional measurements
Short address: https://sciup.org/147234817
IDR: 147234817 | UDC: 316.33:331.108(211-17) | DOI: 10.15838/esc.2021.5.77.13
Text of the scientific article Reproduction of Human Capital in the Arctic Regions of Russia: Socio-Cultural Context
The transition to a post-industrial economy since the early 1960s and the subsequent transition to an information society in the 21st century led to the emergence of the term “human capital”. It first appeared in economics and spread rapidly among other disciplines [1; 2; 3]. The past sixty years witnessed the development of many theories related to this category, and the authors of the fundamental ones were awarded the Nobel Prize (T. Schultz, 1979, G. Becker, 1992). Their ideas were further elaborated on not only theoretically, but also analytically and practically in the developments and methodologies of the UN, the World Bank and other international organizations. Despite the variety of approaches to interpretation of the term “human capital” and its comparison with other forms of capital, it focuses on certain qualities (including their quantitative assessment) of the worker’s personality as a source of creative and innovative productivity embodied in a modern and high-quality product [4; 5; 6]. For individual enterprises, companies, as well as for regions and entire countries, human capital is one of the main resources for boosting competitiveness and development [7; 8]. Obviously, at present, economic and social issues cannot be addressed only by improving material factors [9]. Moreover, focusing on the material aspect alone can become a certain prerequisite for national vulnerability [10]. The gap between countries in terms of the pace of innovation-driven development is growing; lagging behind can result in stagnation. In these conditions, a strategy for modernization on an innovation basis turns out to be the only choice to Russia: either the country will take a step into the future and give an impetus to the dynamic development of its knowledge economy, for which human capital is of critical importance, or it will join the ranks of outsiders [11].
Developed countries have higher indicators of human capital compared to Russia; this can be seen in Table 1 , which characterizes the structure of comprehensive wealth of the Russian Federation and members of the Organization for Economic Cooperation and Development (OECD). We see that with a higher proportion of natural (resources) and produced capital, human capital in Russia is more than 1.5 times lower than in OECD countries. This indicates the excessive role of natural resource rent and traditional industries in the Russian economy and a lack of knowledge-intensive industries and services provided by highly qualified specialists (IT, finance, consulting, etc.).
Table 1. Comprehensive wealth of the Russian Federation and OECD countries, 2017, %
Indicator RF OECD countries Human capital 46 70 Produced capital 33 28 Natural capital 20 3 Net foreign assets 1 -1 Source: Ga’lcheva A. Human capital is gaining weight. RBK, 2019, December 4, no. 196. Available at:
In Russia, with its vast territory, extremely diverse climatic, socio-economic and socio-cultural conditions, the reproduction of human capital for modernization on an innovation basis has distinctive regional specifics [12]. At that, the issues of reproduction of human capital in the context of neo-industrial development in extreme natural and climatic conditions in the regions of the Arctic zone of the Russian Federation require special attention. The adopted Strategy for Development of the Arctic Zone of the Russian Federation and Ensuring National Security for the Period until 20351 and the state program of the Russian Federation “Socio-economic development of the Arctic zone of the Russian Federation”2 are aimed at a deep comprehensive analysis of the processes of formation and reproduction of human capital in the Russian Arctic.
Along with socio-economic factors, sociocultural factors deserve special consideration, since they are not given due attention in the comprehensive analysis of human capital in the Russian Arctic regions. Based on the results of the study, we put forward new knowledge about the role of socio-cultural predicates and components of human capital in the conditions of the Far North in the case of several Arctic regions.
Research methodology, design and technique
Originating in the 1960s, the theory of human capital was developed comprehensively and has become an important response of economics and related branches of knowledge to the lingering and emerging challenges and realities of global economic life; the theory helped to develop, substantiate and implement measures aimed at investing in man and accumulating human capital [13]. Due to the huge number of publications on this subject and the limited format of the journal article, we have chosen the theoretical and methodological aspects expressed in the works of foreign and Russian researchers that we consider to be most significant for our purposes.
Modern concepts of human capital retain the original economic approach to human behavior, proposed by one of the founders of the theory, G. Becker, in the following postulates:
– abilities, knowledge, professional skills, motivation become capital at the time of the purchase and sale of labor, hiring or receiving remuneration by the performer of the work;
– the growth of human capital should contribute to the growth of labor productivity and production;
– the appropriate use of capital should lead to an increase in workers’ income;
– income growth encourages a worker to make investments in health and education to increase the stock of knowledge and skills in order to use them effectively afterwards [3].
With regard to these positions, human capital is interpreted in a broad and narrow sense: 1) human capital is a set of abilities in an individual that enable them to perform various social roles and functions to achieve goals in personal and socially useful activities in order to satisfy one’s needs; 2) human capital is a set of abilities in an individual that create competitive advantages in work, endowing them with freedom in choosing the scope of application of their abilities to receive remuneration [14]. The above definitions emphasize various subject-subjective meanings (frames), which are important to take into account when studying socio-cultural factors, including value-motivational orientations (attitudes) and the allocation of appropriate groupings.
According to modern interpretations of human capital, it has the following properties:
-
– its formation requires significant costs from an individual themselves and from the social system in which an individual lives and functions;
-
– it can be accumulated (increased) – an individual can acquire certain skills, abilities and improve their health;
-
– throughout the life of an individual, it not only multiplies, but also “wears out” – knowledge becomes obsolete, as well as skills and abilities; therefore, the cost of human capital decreases (human capital is amortized);
-
– investment in human capital allows its owner to receive a higher income (effect) in the future;
-
– investment in human capital is of a longterm nature (this applies to investment in “education capital”, “profession capital”, and “health capital”);
-
– it differs from physical capital in the degree of “liquidity”: we cannot separate it from its bearer, an individual;
-
– direct income received by an individual is controlled by themselves, regardless of the source of investment;
-
– the functioning (use) and reproduction of human capital depends on the decisions of an individual and their own will; the degree of return on human capital depends on an individual’s own interests, preferences, material and moral interest, worldview and cultural features [15].
Several of these properties are obviously related to the socio-cultural context of the reproduction of human capital, specifics of functioning of noneconomic institutions in a particular society and the collective ideas and value orientations behind them. This circumstance prompted us to go beyond the econometric approach to analyzing the conditions of human capital reproduction (for more information, see [16–21]) and to search for a connection between its structural components and some variables characterizing the socio-cultural factors that influence its accumulation.
The general structure of human capital in our study is represented by several key components: health, educational, professional, and cultural capital. Each type of capital has a set of indicators; measuring them, we can determine its general level [22, p. 97]. Individual parameters corresponding to each type of capital are presented in Table 2 (their list is deliberately limited in comparison with those found in the specialized literature, since we were interested only in those indicators that can be measured in the framework of mass population
Table 2. Structural components of human capital and their indicators
|
Basic component of human capital |
Indicators of the basic component of human capital |
|
Health capital |
|
|
Educational capital |
|
|
Professional capital |
|
|
Cultural capital |
|
|
Source: own compilation. |
|
surveys and that reflect the socio-economic and socio-professional features of individuals, selfassessment of their health, educational level and value system, as well as assessments of some environmental (spatial-territorial, regional) factors, which can be compared with expert assessments and statistical data).
Most of the indicators presented in the table are biomedical, or socio-economic according to their nature or objective function; others, referred to the parameters of “cultural capital”, reflect historically established and socially approved patterns of behavior, institutions (in the interpretation of D. North – “rules of the game”, i.e. a set of social norms that ensure communication and cooperation between individuals [23, pp. 3–10]) and the basic values of specific communities at different levels (local, regional, national).
The grounds for this approach can be found in economic and social theories that claim to describe and explain the mechanisms of “conversion” of socio-cultural features of individuals and groups into their economic behavior and its results. Thus, such foundations are rooted in the theories of classical institutionalism (T. Veblen, J. Commons) [24] and economic psychology (G. Tarde, G. Katona) [25; 26].
Within the framework of the neo-institutional approach, exploring the problems of organizational behavior and decision-making, H. Simon developed a model of economic behavior called “bounded rationality” [27]. It opens up opportunities for explaining the adoption of economic and other decisions by actors on the basis of previous social experience and norms and patterns of behavior learned during socialization, which largely depend on a certain socio-cultural environment in which the individual was formed.
Theoretical provisions on the connection of human capital with the mechanisms of human economic behavior were developed in the works of D. Kahneman and A. Tversky [28; 29], who put forward the prospect theory which is original for the methodology of behavioral economics. They show that when making economic decisions, people choose the option with the greatest psychological perspective (i.e., the highest level of psychological comfort), based on their stereotypical ideas and intuition.
Another viewpoint in understanding the connection of human capital with non-economic factors is presented by the American scientist R. Thaler, who considers the influence of people’s ideas about justice on economic behavior [30; 31].
Comprehensive studies of human capital, promotion and development of provisions on the influence of socio-cultural factors and collective ideas on economic practices fall within the scope of sociology. The beginning of this line of research was laid in M. Weber’s famous work The Protestant Ethic and the Spirit of Capitalism . It attempts to establish a connection between the system of values derived from a specific religious doctrine and the specifics of organization of entrepreneurial activity, including the aptitude for it. The classic thesis of M. Weber’s statement that the work ethic of Protestantism contributed to greater “economic rationalism” and, as a result, a higher level of entrepreneurship development in countries with predominantly Calvinist populations [32, pp. 67– 69, 204–206], later, although criticized, stimulated the development of concepts of socio-cultural conditionality of economic practices and, thus, led to the study of this aspect of human capital in the works of M. Zafirovsky, R. Collins, B. Martin, V. Schluchter, M. Tamari, etc. [33, pp. 108–110].
Among the works of Russian scientists on this issue, it is necessary to highlight, first of all, the works of M.K. Gorshkov, who, within the framework of the mega-project of the study of modern Russian society, gave a deep analysis of the influence of non-economic factors on socioeconomic development [9] and highlighted the socio-cultural vector of this influence [34].
Socio-cultural factors in human capital in the discourse of Russian modernization were investigated by N.I. Lapin [35]. Under his supervision, a unique project was carried out to develop and compile The Atlas of Modernization of Russia and Its Regions , with an original comprehensive analysis of socio-economic and socio-cultural trends and issues, which evoked a wide response in the scientific and academic community [36]. The specified work highlights issues typical of human capital at the new stage of exploration and development of Russia’s Arctic zone, Extreme North, Far North and Near North.
When studying these problems, it is important to apply a geosystem approach put forward by V.N. Lazhentsev [37]; we use this approach congruently with our geo-socio-spatial methodology, in which, in addition to the study of subject-object relations in a certain geophysical (territorial) space, we investigate subject-subject relations between actors of certain social processes [38–41]. We were also interested in the ideas of N.Yu. Zamyatina and A.N. Pilyasov [42].
We took into account methodological specifics contained in the sociological analysis of the socio-cultural environment of a Northern region, presented, in particular, in the study by A.A. Shabunova and N.A. Okulova [43].
Having considered conceptual approaches, we can construct a design for the study of social practices of individuals that determine the formation and reproduction of human capital in the context of the Far North and the Arctic regions; the design allows us to identify how these practices have developed under the influence of sociocultural factors, including attitudes and values learned earlier during socialization that stimulate and motivate individuals to take care of their health and education, appropriate investments, also related to the return on human capital and the real possibilities of converting it into income and socioprofessional status.
The empirical basis for our research includes data of two mass sample surveys conducted with our direct participation almost simultaneously in the spring (March – May) of 2018 in two Arctic regions: the Arkhangelsk Oblast (in the territories included in the Arctic zone of the Russian Federation) and Yamalo-Nenets Autonomous Okrug (YNAO). At the same time, we assume that the Arctic territories of the Arkhangelsk Oblast (AO) represent a certain model of the western (European) part of the Russian Arctic, and Yamalo-Nenets Autonomous Okrug – the eastern (Ural-Siberian). The first survey within the framework of the research work “Monitoring the socio-psychological and socio-cultural situation in the Arctic zone of the Russian Federation” was conducted among the population of six municipalities of the Arkhangelsk Oblast included in the Arctic zone of the Russian Federation (the cities of Arkhangelsk and Severodvinsk; the town of Novodvinsk; Onezhsky, Primorsky and Mezensky municipal districts). We used quota sample, representative by gender, age and area of residence; sample size n = 407 people; confidence interval ≤ 4.9%. In the second case, within the framework of the project of the Russian Foundation for Basic Research “Value and cognitive factors of entrepreneurial behavior of the population of the Arctic territories of Russia” (using the materials of the first survey and conducting its secondary analysis through targeted processing of primary data), the sample was expanded with the data from a new survey of 405 residents of the Arctic territories of the Arkhangelsk Oblast and 299 residents of Yamalo-Nenets Autonomous Okrug. As a result, with a stratified sample type, its total size was 704 people with a confidence interval of
≤ 3.7%. The results were processed with the use of the SPSS program, separately for each region and for the total sample population. Comparing the results of the surveys with the data of state statistics and expert assessments allows us to draw substantiated conclusions about the problems under consideration.
In order to compare the features (indicators) of human capital with the financial situation of respondents, we conducted the procedure of selfassessment of the financial situation on a differentiated scale (Fig. 1) .
The distribution closely correlates with statistical data and reflects significantly higher indicators of average per capita income and per capita GRP (Tab. 3) .
The socio-professional structure of regional samples is shown in Figure 2. In this distribution among the respondents from Yamalo-Nenets Autonomous Okrug, in contrast to the Arkhangelsk Oblast, the proportion of those who identify themselves as pensioners is noticeably smaller,
Figure 1. Respondents’ assessment of their financial situation, % for each group participating in the surveys
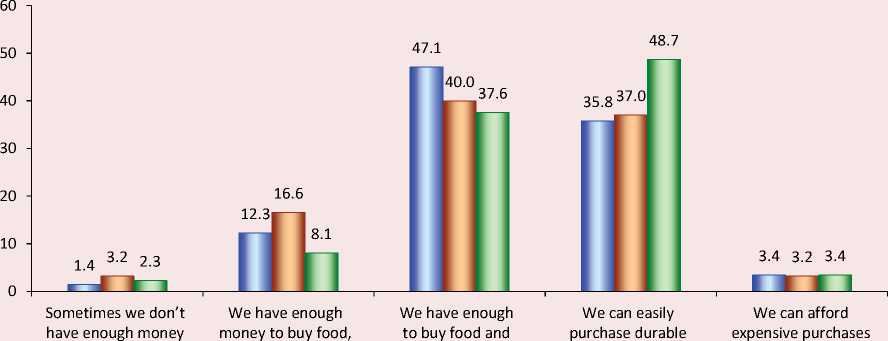
even to buy food items but it’s a problem to buy clothes
(apartment, dacha) without obtaining a loan clothing, but buying durable items is a problem
-
□ Arkhangelsk Oblast, n=407 □ Arkhangelsk Oblast, n=405 □ YNAO, n=299
Table 3. Dynamics of average per capita GRP and income in the Arkhangelsk Oblast and Yamalo-Nenets Autonomous Okrug
Per capita GRP, thousand rubles* Region 2014 2015 2016 2017 2018 Arkhangelsk Oblast (without NAO) 310.8 352.8 377.9 418.4 464.9** Yamalo-Nenets Autonomous Okrug 3025.7 3336.5 3785.5 4581.2 5710.1*** Russia as a whole 405.2 449.1 472.1 510.3 no data Average per capita monetary income, rubles**** Arkhangelsk Oblast (without NAO) 28033 31114 31043 31705 31888 Yamalo-Nenets Autonomous Okrug 61252 66795 67521 71705 74304 Russia as a whole 27766 30467 30744 31367 32609 Sources: * Official website of the Federal State Statistics Service. National accounts. Gross regional product. Available at: ru/wps/wcm/connect/rosstat_main/rosstat/ru/statistics/accounts/# * * Official website of the Office of the Federal State Statistics Service for the Arkhangelsk Oblast and Nenets Autonomous Okrug. Available at: * ** Yamalo-Nenets Autonomous Okrug in numbers (20152019): Concise statistics collection. Tyumen, 2020. 193 p. P. 8. Available at: * *** Regions of Russia. Socio-economic indicators. 2017: Statistics collection. Rosstat. Moscow, 2017. 1402 p. Pp. 242–243; Official website of the Federal State Statistics Service. Average per capita monetary income broken down by constituent entity of the Russian Federation. Available at:
Figure 2. Distribution of respondents by socio-professional status, % for each set of respondents
Skilled specialist (teacher, doctor, accountant, engineer)
Skilled worker (turner, mechanical engineer, house painter, stucco worker)
Sales, technical, office worker
Retired
Worker (watchman, loader, handyman)
Head (department, organization)
State (municipal) employee
Entrepreneur
Student
Housewife, on maternity leave
Law enforcement officer, military personnel
Unemployed, looking for a job
Farmer
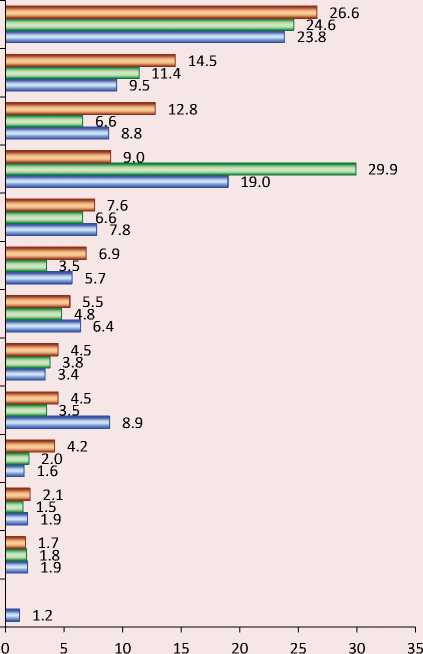
□ Arkhangelsk Oblast, n = 407
-
□ YNAO, n = 299 □ Arkhangelsk Oblast, n = 405
which can be explained by the spread of pensioner work in the Okrug, the widespread use of rotation system in hiring workers at large oil and gas producing enterprises located in the region, as well as the practice of pensioners moving to regions with a more favorable climate. In the remaining cohorts, the ratio of shares for similar socioprofessional groups in different samples does not differ significantly. In addition, the incomparably smaller number of the disabled population in Yamalo-Nenets Autonomous Okrug, other things being equal, indirectly indicates the availability of a larger amount of the total human capital in the Okrug.
We point out that the official unemployment rates for the Arkhangelsk Oblast and Yamalo-Nenets Autonomous Okrug are several times higher (Tab. 4), than the share of the unemployed in our samples. The difference is partly explained by the fact that people in this category, as a rule, are least likely to take part in opinion polls or indicate their status.
Thus, the design of our study unites theoretical approaches that include sensitive categories characterizing human capital (education, health, socio-professional status), which are quite easily quantifiable, with quantitative representations of categories characterizing value orientations and attitudes that are difficult to quantify and that require special valid scales and tools, among other things, in expressions and explanations of connections (relationships).
First-order results. Education, health, socioprofessional status: How they are related in the sociological assessment of human capital in the Arctic regions
Table 4. Unemployment rate dynamics in the Arkhangelsk Oblast and Yamalo-Nenets Autonomous Okrug, %
Region 2014 2015 2016 2017 2018 Arkhangelsk Oblast (without NAO) 7.3 6.8 7.1 6.4 6.3 Yamalo-Nenets Autonomous Okrug 3.1 3.6 2.6 3.2 2.1 Russia as a whole 5.2 5.6 5.5 5.2 4.8 Source: Official website of the Federal State Statistics Service. Labor market, employment and wages. Human resources. Unemployment rate broken down by constituent entity of the Russian Federation. Available at:
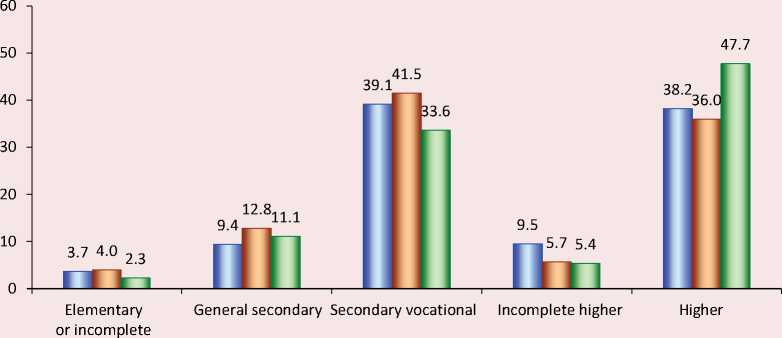
Figure 3. Distribution of respondents by level of education, % for each set of respondents
secondary
I □ Arkhangelsk Oblast, n = 407 □ Arkhangelsk Oblast, n = 405 □ YNAO, n = 299
Presenting an analytical review of statistically significant relationships based on the data obtained in our surveys, first of all, we shall briefly focus on the features of the distribution of educational statuses of respondents in the two Arctic regions. The frequency distribution for each of the samples is shown in Figure 3.
Among the respondents in both regions, there are more persons with secondary or higher professional education; this is mostly consistent with statistical data and fundamentally confirms the thesis about the high level of human capital in Russia as a whole and in the industrialized regions of the Russian Federation in particular. At the same time, the share of people with higher education in Yamalo-Nenets Autonomous Okrug is much higher than in the Arkhangelsk Oblast, despite the more developed educational infrastructure of the latter. Obviously, this also indicates the results of cooperation between the authorities and the enterprises of the oil and gas industry, aimed at effective reproduction of high-quality human capital in the Okrug.
At the same time, education, although it is an important component of human capital, implies the presence of interrelations with its other components, which makes it necessary to identify and, if possible, measure them. Identification and measurement of statistically significant relationships (dependencies) between variables should reflect the results of investments in educational capital, health capital, as well as relevant indicators of return on human capital (income level measured through selfassessment of financial status and socio-professional status). Our data characterize these dependencies very ambiguously. Table 5 shows that although there is a statistically significant relationship (p < 0.01) between self-assessments of financial situation and
Table 5. Relationship of self-assessment of financial situation with the level of education of respondents, Arkhangelsk Oblast, n = 407*
|
Self-assessment of financial situation |
Total |
|||||
|
We have enough money to buy food, but it’s a problem to buy clothes |
We have enough to buy food and clothing, but buying durable items is a problem |
We can easily purchase durable items |
||||
|
Education level |
General secondary |
Frequency |
6 |
17 |
12 |
35 |
|
% |
17.1 |
48.6 |
34.3 |
100.0 |
||
|
Secondary vocational |
Frequency |
32 |
77 |
46 |
155 |
|
|
% |
20.6 |
49.7 |
29.7 |
100.0 |
||
|
Incomplete higher |
Frequency |
4 |
15 |
16 |
35 |
|
|
% |
11.4 |
42.9 |
45.7 |
100.0 |
||
|
Higher |
Frequency |
5 |
69 |
68 |
142 |
|
|
% |
3.5 |
48.6 |
47.9 |
100.0 |
||
|
Total |
Frequency |
47 |
178 |
142 |
367 |
|
|
% |
12.8 |
48.5 |
38.7 |
100.0 |
||
|
*Hereinafter, we compiled the tables on the basis of statistical analysis of the survey materials. In Tables 5–6, groups of respondents with the most rarely occurring, extreme values of the conjugated variables are excluded from the analysis in order to increase the reliability of the chi-squared test, which reveals the presence/absence of a significant relationship between two variables. For the variable “selfassessment of financial situation”, these values characterize the least and most affluent, for the variable “education level” – persons with incomplete secondary education. |
||||||
Table 6 shows that in another sample of respondents (n = 405) from the Arkhangelsk Oblast there is a weak connection (p > 0.05). At the same time, such a connection was found for Yamalo-Nenets Autonomous Okrug (Cramer’s V ~ 0.2): respondents with higher education were twice as likely to note that their income is above average, compared with respondents with general secondary education alone. In this case, it is quite possible to assume that if vocational education helps receive higher income, then it happens in the presence of additional factors that are associated with the structural features of the labor market, in particular, greater or lesser demand for skilled labor. It is obvious that the “overproduction” of specialists with higher education also has its implications in the Russian context. At the same time, in the modern situation, when education investments, both public and personal, do not endow individuals with special competitive advantages in the labor market and do not help them receive high incomes, the continuing significant demand for higher education services
Table 6. Relationship between self-assessment of financial situation and the level of education in respondents, % Arkhangelsk Oblast, n = 405; Yamalo-Nenets Autonomous Okrug, n = 299
|
Self-assessment of financial situation |
|||||
|
We have enough money to buy food, but it’s a problem to buy clothes |
We have enough to buy food and clothing, but buying durable items is a problem |
We can easily purchase durable items |
|||
|
Arkhangelsk Oblast |
Education level |
General secondary |
19.6 |
45.7 |
34.8 |
|
Secondary vocational |
20.5 |
39.1 |
40.4 |
||
|
Incomplete higher |
21.7 |
30.4 |
47.8 |
||
|
Высшее |
12.3 |
44.9 |
42.8 |
||
|
Total |
17.4 |
41.6 |
41.0 |
||
|
Yamalo-Nenets AO |
Education level |
General secondary |
7.1 |
64.3 |
28.6 |
|
Secondary vocational |
11.2 |
48.0 |
40.8 |
||
|
Incomplete higher |
0.0 |
37.5 |
62.5 |
||
|
Higher |
7.5 |
28.6 |
63.9 |
||
|
Total |
8.4 |
39.6 |
52.0 |
||
|
Arkhangelsk Oblast |
Value |
Degrees of freedom |
Asymptotic significance |
|
Pearson’s chi-squared test |
5.581 |
6 |
0.472 |
|
Phi |
0.124 |
0.472 |
|
|
Cram e r’s V |
0.088 |
0.472 |
|
|
Yamalo-Nenets AO |
Value |
Degrees of freedom |
Asymptotic significance |
|
Pearson’s chi-squared test |
21.872 |
6 |
0.001 |
|
Phi |
0.282 |
0.001 |
|
|
Cram e r’s V |
0.199 |
0.001 |
Table 7. Relationship between self-assessments of the financial situation and physical health of respondents, Arkhangelsk Oblast, n = 407*
|
Self-assessment of financial situation |
Total |
|||||
|
We have enough money to buy food, but it’s a problem to buy clothes |
We have enough to buy food and clothing, but buying durable items is a problem |
We can easily purchase durable items |
||||
|
Selfassessment of physical health |
Good |
Frequency |
15 |
50 |
62 |
127 |
|
% |
11.8 |
39.4 |
48.8 |
100.0 |
||
|
Sooner good |
Frequency |
11 |
104 |
59 |
174 |
|
|
% |
6.3 |
59.8 |
33.9 |
100.0 |
||
|
Sooner poor |
Frequency |
12 |
23 |
14 |
49 |
|
|
% |
24.5 |
46.9 |
28.6 |
100.0 |
||
|
Poor |
Frequency |
4 |
2 |
5 |
11 |
|
|
% |
36.4 |
18.2 |
45.5 |
100.0 |
||
|
Total |
Frequency |
42 |
179 |
140 |
361 |
|
|
% |
11.6 |
49.6 |
38.8 |
100.0 |
||
|
* In Tables 7–10, when calculating the chi-square, for its greater reliability, groups of respondents with the most rarely occurring, extreme values of conjugated variables were excluded from the analysis. For the variable “self-assessment of financial situation”, these values characterize the least and most affluent, for the variable “self-assessment of mental health” – people who have an extremely low estimate of their emotional and/or mental state. |
||||||
|
Value |
Degrees of freedom |
Asymptotic significance |
|
|
Pearson’s chi-squared test |
31.345 |
6 |
0.000 |
|
Phi |
0.295 |
0.000 |
|
|
Cram e r’s V |
0.208 |
0.000 |
Table 8. Relationship between self-assessments of the financial situation and mental health of respondents, Arkhangelsk Oblast, n = 407
|
Self-assessment of financial situation |
Total |
|||||
|
We have enough money to buy food, but it’s a problem to buy clothes |
We have enough to buy food and clothing, but buying durable items is a problem |
We can easily purchase durable items |
||||
|
Selfassessment of mental health |
Good |
Frequency |
16 |
75 |
72 |
163 |
|
% |
9.8 |
46.0 |
44.2 |
100.0 |
||
|
Sooner good |
Frequency |
23 |
95 |
53 |
171 |
|
|
% |
13.5 |
55.6 |
31.0 |
100.0 |
||
|
Sooner poor |
Frequency |
5 |
11 |
12 |
28 |
|
|
% |
17.9 |
39.3 |
42.9 |
100.0 |
||
|
Total |
Frequency |
44 |
181 |
137 |
362 |
|
|
% |
12.2 |
50.0 |
37.8 |
100.0 |
||
Tables 7, 8 show the values of the variables of physical and mental health, on the one hand, and self-assessment of the financial situation, on the other3. Here it is obvious that there is a statistically significant relationship between respondents’ assessment of their physical health and the assessment of their financial situation: among people with good health, the proportion of people with medium and high incomes is higher; while among people with low incomes, the proportion of those who have poor health is higher. It is a direct illustration of the fact that “it is better to be rich and healthy than to be poor and sick”. But at the same time, it would be an unjustly narrow viewpoint to see only a direct dependence of material well-being on physical health, since poor health can be not only a cause (diseases lead to a decrease in working capacity and, thus, a decrease in income), but also a consequence of a low standard of living (poverty contributes to the deterioration of health due to poor nutrition, poor living conditions, unavailability of medical services and wellness procedures). As for the mental health of residents of the Arctic territories of the Arkhangelsk Oblast, according to the data provided, it is statistically associated with the self-assessment of their financial situation very weakly (p > 0.05). The explanation for this can be twofold: either the respondents underestimate the importance of their mental health, or the “harsh northern character” organically implies mental stability, etc.
The most significant, as expected, were the interrelations of socio-professional status and the level of education (Tab. 9, 10). The data on all three samples indicate that belonging to certain socioprofessional groups that differ not only in the content of work and qualification requirements, but also in status, is largely determined by formal, including specialized, education. Among respondents with secondary education, representatives of groups with a relatively low status in the system of socio-professional stratification
Table 9. Relationship between the level of education of the respondents and their belonging to a socio-professional group, Arkhangelsk Oblast, n = 407, % by column
|
What socio-professional group do you identify with? |
Education level |
Total |
||
|
General secondary |
Secondary vocational |
Higher |
||
|
Unskilled worker |
41.4 |
11.4 |
0.0 |
9.3 |
|
Skilled worker |
17.2 |
20.7 |
2.3 |
12.3 |
|
State (municipal) employee |
10.3 |
6.4 |
9.9 |
8.3 |
|
Sales, technical, office worker |
10.3 |
15.0 |
4.6 |
10.0 |
|
Qualified specialist |
0.0 |
16.4 |
54.2 |
31.3 |
|
Head (departments, organizations) |
6.9 |
0.0 |
14.5 |
7.0 |
|
Retired |
13.8 |
30.0 |
14.5 |
21.7 |
|
Value |
Degrees of freedom |
Asymptotic significance |
|
|
Pearson’s chi-squared test |
142.174 |
12 |
0.000 |
|
Phi |
0.688 |
0.000 |
|
|
Cram e r’s V |
0.487 |
0.000 |
3 Since no questions about physical and mental health were asked during the survey within the framework of the project “Value-based and cognitive drivers of entrepreneurial behavior of the population of the Arctic territories of Russia”, the text contains the results of the analysis concerning only the Arctic territories of the Arkhangelsk Oblast (n = 407).
Table 10. Relationship between the respondents’ level of education and their belonging to a socio-professional group,
Arkhangelsk Oblast, n = 405; Yamalo-Nenets Autonomous Okrug, n = 299, % by column
|
What socio-professional group do you identify with? |
Education level |
|||||||
|
Arkhangelsk Oblast |
Yamalo-Nenets AO |
|||||||
|
General secondary |
Secondary vocational |
Higher |
Total |
General secondary |
Secondary vocational |
Higher |
Total |
|
|
Unskilled worker |
20.5 |
7.6 |
0.8 |
6.4 |
26.9 |
12.0 |
2.6 |
8.9 |
|
Skilled worker |
12.8 |
18.8 |
2.3 |
11.1 |
15.4 |
31.3 |
5.2 |
16.0 |
|
State (municipal) employee |
5.1 |
2.8 |
9.2 |
5.7 |
7.7 |
4.8 |
7.8 |
6.7 |
|
Sales, technical, office worker |
10.3 |
9.7 |
3.1 |
7.0 |
11.5 |
19.3 |
13.8 |
15.6 |
|
Qualified specialist |
7.7 |
18.8 |
48.1 |
29.6 |
15.4 |
14.5 |
50.9 |
33.3 |
|
Head (departments, organizations) |
2.6 |
1.4 |
8.4 |
4.5 |
0.0 |
3.6 |
13.8 |
8.4 |
|
Retired |
41.0 |
41.0 |
28.2 |
35.7 |
23.1 |
14.5 |
6.0 |
11.1 |
|
Arkhangelsk Oblast |
Value |
Degrees of freedom |
Asymptotic significance |
|
Pearson’s chi-squared test |
84.346 |
12 |
0.000 |
|
Phi |
0.518 |
0.000 |
|
|
Cram e r’s V |
0.366 |
0.000 |
|
|
Yamalo-Nenets AO |
Value |
Degrees of freedom |
Asymptotic significance |
|
Pearson’s chi-squared test |
75.605 |
12 |
0.000 |
|
Phi |
0.580 |
0.000 |
|
|
Cram e r’s V |
0.410 |
0.000 |
(unskilled workers, to a lesser extent – skilled workers) have the largest share. In the group of people with secondary vocational education, skilled workers predominate in all samples. There are also significant shares of low-skilled workers in the service sector and qualified specialists (doctors, engineers, teachers, etc.), who are distinguished by a higher status associated with higher qualifications and the intellectual nature of work. In the group of respondents with higher education, there is a predominance of qualified specialists (more than half of the number of respondents), as well as the largest proportion of managers who, respectively, have the highest status in the socio-professional hierarchy. Thus, it turns out that the return on investment in educational capital is much more evident in the levels of socio-professional stratification than in income levels.
Tables 11–124 reflect the relationship between socio-professional status and health. There is a statistically significant relationship between physical health and belonging to a certain socio-professional group, but it manifests itself as very weak (p > 0.05), if we do not take into account cases when respondents chose the “poor” option.
As for mental health, we have also revealed the presence of a weak relationship between the variables under consideration. At the same time, on the one hand, among those who assessed their emotional and psychological state as good, the proportion of unskilled workers (low-status group) is quite high (above the average in the sample); on the other hand, the same situation is typical of managers (high-status group). However, the
Table 11. Relationship between self-assessments of respondents’ physical health and belonging to a socio-professional group, Arkhangelsk Oblast, n = 407, % by column
|
What socio-professional group do you identify with? |
Self-assessment of physical health |
Total |
||
|
Good |
Sooner good |
Sooner poor |
||
|
Unskilled worker |
10.4 |
9.1 |
13.0 |
10.1 |
|
Skilled worker |
17.7 |
11.0 |
4.3 |
12.2 |
|
State (municipal) employee |
5.2 |
11.0 |
8.7 |
8.8 |
|
Sales, technical, office worker |
12.5 |
11.7 |
10.9 |
11.8 |
|
Qualified specialist |
27.1 |
31.8 |
26.1 |
29.4 |
|
Head (departments, organizations) |
11.5 |
6.5 |
4.3 |
7.8 |
|
Retired |
15.6 |
18.8 |
32.6 |
19.9 |
|
Value |
Degrees of freedom |
Asymptotic significance |
|
|
Pearson’s chi-squared test |
15.865 |
12 |
0.198 |
|
Phi |
0.232 |
0.198 |
|
|
Cram e r’s V |
0.164 |
0.198 |
Table 12. Relationship between self-assessments of respondents’ mental health and belonging to a socio-professional group, Arkhangelsk Oblast, n = 407, % by columns
|
What socio-professional group do you identify with? |
Self-assessment of mental health |
Total |
||
|
Good |
Sooner good |
Sooner poor |
||
|
Unskilled worker |
13,0 |
8,0 |
7,7 |
10,1 |
|
Skilled worker |
12,2 |
13,3 |
3,8 |
12,1 |
|
State (municipal) employee |
4,6 |
10,0 |
15,4 |
8,1 |
|
Sales, technical, office worker |
10,7 |
11,3 |
11,5 |
11,1 |
|
Qualified specialist |
33,6 |
27,3 |
23,1 |
29,6 |
|
Head (departments, organizations) |
12,2 |
2,7 |
3,8 |
6,8 |
|
Retired |
13,7 |
27,3 |
34,6 |
22,1 |
It follows from the above data that the statistically significant dependence of at least one of the parameters for assessing the return on investment on human capital is caused only by the level of education, and this is most evident in the influence on belonging to socio-professional groups with a certain rank of status: the higher the level of education, the more the proportion of representatives of high-status socio-professional groups increases.
Second-order results. Value orientations in the socio-cultural foundations of the reproduction of human capital in the Arctic regions
A number of the concepts mentioned above contain statements about the influence of attitudes and value orientations on the basic patterns of economic behavior. The main postulate in this regard is the thesis that value orientations and personal qualities formed under their influence contribute to the formation of such behaviors that allow achieving the desired level of material wellbeing and the corresponding status in the system of socio-professional stratification.
The analysis of the empirical material we have obtained basically confirms the hypothesis that value orientations can be drivers of the reproduction of human capital (efforts to improve the educational level and maintain health) and conditions for its rational and effective use (conversion of human capital into income and status). However, such influence is not direct or strictly defined. Rather, sociocultural factors in general and value orientations in particular are ambivalent in relation to human capital.
In order to identify the role of value orientations in the formation and reproduction of human capital, we used the approach of M. Rokeach, which involves the allocation of values of two classes: terminal, reflecting the target attitudes of individuals (what they want to achieve), and instrumental, through which the idea of the approved means of achieving goals is expressed. This approach was adapted to the Russian context by A. Goshtaus, A. Semenov, V. Yadov, and then N.I. Lapin et al. [37; 44, pp. 262–264].
The use of this approach in surveys of residents of the Arctic territories of the Arkhangelsk Oblast and Yamalo-Nenets Autonomous Okrug produced the following distributions (Tab. 13, 14) . The data show that the dominant sets of terminal values (in their upper positions) in the two regions are almost identical, and the differences in averages are statistically insignificant (see Tab. 13).
Table 13. Average values of respondents’ adherence to terminal values, points on a five-point scale
|
Terminal value |
Arkhangelsk Oblast (n = 405) |
Yamalo-Nenets AO (n = 299) |
|
Creativity, hobbies |
4.28 |
4.36 |
|
Family and children |
4.87 |
4.94 |
|
Love, relationships |
4.63 |
4.66 |
|
Health |
4.85 |
4.91 |
|
Harmony with the surrounding world |
4.52 |
4.62 |
|
Public recognition |
3.77 |
3.81 |
|
Financial security |
4.44 |
4.51 |
|
Personal safety and the safety of loved ones |
4.85 |
4.93 |
|
Active life |
4.33 |
4.45 |
|
Pleasure, entertainment |
3.77 |
3.79 |
|
Life wisdom |
4.59 |
4.64 |
|
Peaceful life |
4.78 |
4.88 |
|
Order and stability |
4.72 |
4.82 |
|
Improving education and general culture |
4.53 |
4.76 |
|
Freedom, independence |
4.60 |
4.68 |
|
Equality and justice |
4.62 |
4.67 |
|
Beauty of nature and works of art |
4.60 |
4.58 |
|
Interesting job |
4.57 |
4.77 |
Table 14. Average values of respondents’ adherence to instrumental values, points on a five-point scale
|
Instrumental value |
Arkhangelsk Oblast (n = 405) |
Yamalo-Nenets AO (n = 299) |
|
Good manners, politeness |
4.81 |
4.86 |
|
Neatness |
4.64 |
4.72 |
|
Cheerfulness |
4.59 |
4.59 |
|
Demanding of oneself and others |
4.47 |
4.44 |
|
Ambition, the desire to succeed |
4.12 |
4.21 |
|
Diligence, conscientious attitude toward duties |
4.82 |
4.87 |
|
Independence, independence |
4.53 |
4.64 |
|
Education, extensive knowledge |
4.61 |
4.74 |
|
Responsibility |
4.87 |
4.93 |
|
Prudence, sanity |
4.75 |
4.84 |
|
Restraint, self-control |
4.70 |
4.77 |
|
Courage, determination |
4.53 |
4.60 |
|
Perseverance, firmness of character |
4.45 |
4.51 |
|
Tolerance of other people’s views, lifestyle |
4.24 |
4.25 |
|
Honesty |
4.83 |
4.84 |
|
Ability to understand and respect someone else’s point of view |
4.70 |
4.71 |
|
Diligence, efficiency |
4.80 |
4.83 |
|
Sensitivity, caring |
4.70 |
4.77 |
The hierarchy of instrumental values turned out to be close to the above, with relatively small differences (see Tab. 14). This provides a basis for analyzing samples for both regions in a single array.
The analysis of correlations between terminal and instrumental values, on the one hand, and indicators of material well-being and socioprofessional status, on the other, has shown that there are few statistically significant relationships (p ≤ 0.05) between the two groups of variables and they are all very weak (Tab. 15) . It turns out that in this case, the values of both classes have practically no direct and immediate impact on the conversion of human capital into material well-being and socioprofessional achievements.
The ideas about value orientations as drivers of investment in human capital – both in health and in education – look more solid. Moreover, the terminal values include health and education, and the instrumental values include such values that seem important for successful advancement in society and at work (“diligence, conscientious attitude toward duties”, “responsibility”, “diligence/ efficiency”, “ambition”).
Table 16 shows contingency coefficients for statistically significant (p ≤ 0.05) relationships between the values allocated and the level of education (in the framework of the survey, on the basis of which the analysis is carried out, no questions about self-assessment of health were asked). It is quite expected that such values included “improving education and general culture”, “public recognition”, “financial security”, with a very weak relationship between independent and dependent variables (Cramer’s V < 0.2). As in the case of the level of education, there is no significant influence of adherence to certain value orientations, although, according to the assumption, some of them should directly stimulate and motivate individuals to
Table 15. Relationship between the degree of adherence to terminal and instrumental values, self-assessment of financial situation and socio-professional status in the total number of respondents in the Arkhangelsk Oblast and Yamalo-Nenets Autonomous Okrug (n = 704*)
|
Self-assessment of financial situation |
Socio-professional status |
|
|
Terminal value |
||
|
Financial security |
χ 2 = 0.031 Cram e r’s V = 0.152 |
|
|
Pleasure. entertainment |
χ 2 = 0.004 Cram e r’s V = 0.179 |
|
|
Personal safety and the safety of loved ones |
χ 2 = 0.025 Cram e r’s V = 0.0116 |
|
|
Instrumental value |
||
|
Courage, determination |
χ 2 = 0.025 Cram e r’s V = 0.125 |
χ 2 = 0.001 Cram e r’s V = 0.186 |
|
Tolerance of other people’s views, lifestyle |
χ 2 = 0.004 Cram e r’s V = 0.130 |
|
|
Restraint, self-control |
χ 2 = 0.047 Cram e r’s V = 0.109 |
|
|
Perseverance, firmness of character |
χ 2 = 0.000 Cram e r’s V = 0.147 |
|
|
Diligence, efficiency |
χ 2 = 0.004 Cram e r’s V = 0.131 |
|
* Unified array for Yamalo-Nenets Autonomous Okrug and Arctic municipalities of the Arkhangelsk Oblast.
Table 16. Relationship between the degree of adherence to terminal and instrumental values and the educational level of respondents in the total amount of respondents in the Arkhangelsk Oblast and Yamalo-Nenets Autonomous Okrug (n = 704)
It has been of interest to consider the connection of terminal and instrumental values with the propensity (positive attitude as a source of motivation) to entrepreneurial activity. To identify this propensity and the corresponding grouping of respondents, we used answers to the question “Have you ever thought about starting your own business?”: 1) those who have opened their own business (“entrepreneurs”), 2) those who are thinking about opening their own business (“potential entrepreneurs”), 3) those who have not thought about it (“non-entrepreneurs”).
The specifics of the system of value orientations were determined for each group. At the same time, the differences between the groups were identified on the basis of the empirical data obtained and did not involve a comparison of the value system of the first group of respondents (entrepreneurs) with some value profiles (models) of a “typical entrepreneur” claiming to be universal, which are presented in literature [45, pp. 8–10].
The distribution of respondents in three constructed groups (Fig. 4) shows a greater potential for entrepreneurship in Yamalo-Nenets Autonomous Okrug; however, the proportion of those who identified themselves as active entrepreneurs (taking into account sampling error) in both regions is approximately the same.
If we take into account (as shown above, see Tab. 13, 14) that there are no significant differences in the hierarchies of values among residents of the two regions, then the differences in the propensity for entrepreneurship (potential) are due to some special circumstances, for example, a more favorable investment climate, institutional and infrastructural positions for small and mediumsized businesses in Yamalo-Nenets Autonomous Okrug compared to the Arkhangelsk Oblast5.
Figure 4. Distribution of respondents into groups with different propensity for entrepreneurship in the Arkhangelsk Oblast and Yamalo-Nenets Autonomous Okrug (n = 704), % of the total number of respondents
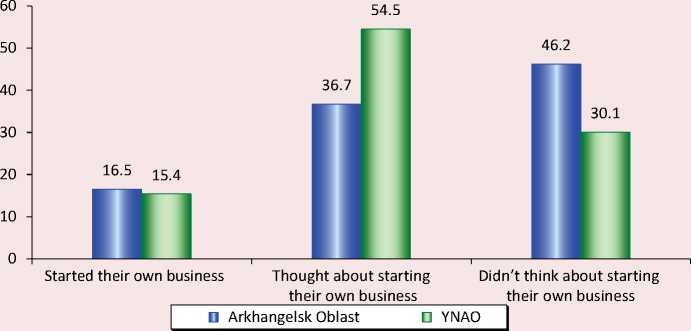
Table 17. Indices of attitude toward terminal and instrumental values among respondents in the Arkhangelsk Oblast and Yamalo-Nenets Autonomous Okrug (n = 704) according to the results of the discriminant analysis
|
Value |
Wilks’ λ * |
F** |
|
Arkhangelsk Oblast |
||
|
Career success |
0.97 |
5.41 |
|
Improving education and general culture |
0.98 |
4.06 |
|
Ambition, the desire to succeed |
0.97 |
6.71 |
|
Yamalo-Nenets Autonomous Okrug |
||
|
Career success |
0.98 |
3.48 |
|
Beauty of nature and works of art |
0.98 |
3.02 |
|
Interesting job |
0.99 |
3.11 |
|
Ambition, the desire to succeed |
0.96 |
6.00 |
|
*Indicator of the ratio of the measure of intra-group variability to the measure of overall variability. **Indicator of the ratio of the average square between groups to the average square within the group. |
||
Returning to the question of differences in values between regional groups of respondents (including the latent influence of those inclined to entrepreneurship in both samples), we should note that the targeted discriminant analysis we conducted on this occasion has shown their very significant convergence ( Tab. 17 ; only those terminal and instrumental values whose differences are statistically significant are presented, p ≤ 0.05).
Despite the fact that the groups of respondents differ from each other in the degree of commitment to these values (earlier we noted that commitment to these values increases along with the propensity for entrepreneurship), the target indicator of Wilks’ lambda is close to 1, which means a very weak degree of discrimination on the selected variables. Thus, although there is a difference in values between entrepreneurs and people who are not inclined to such activities, this difference is not decisive in choosing the form of economic activity. Obviously, certain conditions that favor or hinder a particular choice can play a much more significant role.
Discussion of the results
The analysis of empirical material obtained in the course of mass sample surveys allows us to point out the ambivalent nature of the manifestation of socio-cultural factors in relation to the human capital of the Northerners. These factors can act both as foundations and as components of this form of capital. The connection between education and socio-professional status is most pronounced. It is very linear, since it is the increase in the level of education that is a direct factor contributing to the improvement of the socio-professional status, and not vice versa. The influence of the educational level on socio-professional advancement in the Arctic regions is enhanced, first of all, due to the neo-industrial vector of development (especially in Yamalo-Nenets Autonomous Okrug) in extreme natural and climatic conditions that require special qualities of human capital in general, good health and vocational education in particular. In addition, education is directly related to cultural capital, is part of the socio-cultural potential of the worker, and represents the basic universals for continuing education, including advanced training and retraining.
At the same time, the hypothesis about the relationship between the results of investments in human capital (indicators were the educational level and self-assessment of health) and the level of financial well-being (indicator: self-assessment of household income) was confirmed only partially.
A stable connection between financial well-being and physical health has been revealed, but the strength of the connection is low, and its nature is very ambiguous: higher incomes can be obtained as a result of higher productivity, which is promoted by good health, but there is another, opposite option – low incomes can lead to health deterioration. In Arctic conditions, the first trend prevails, although a certain part of the population (up to 20–25%) is openly or latently in the second one. The second trend is less typical of Yamalo-Nenets Autonomous Okrug, non-indigenous residents of such low-status categories are being “gently” pushed out of the region.
We have obtained a solution to one the main questions in our study – regarding the influence of value orientations on economic behavior patterns: a statistically significant relationship was found between individual value orientations (both terminal and instrumental) and variables reflecting the income, status and education of respondents, but it would still be an unjustified reduction to assert that it is the very values that have a direct impact on all other parts (components) of human capital and its conversion into material and status-related positions of an individual. Research indicates that the impact of sociocultural factors is fundamental and profound. In the conditions of the Arctic regions, factors related to the spatial mainstream, market conditions, institutional formats, northern infrastructure and other parameters of the political and economic system are of particular importance in these processes (starting with natural and climatic and ending with socio-psychological ones) in relation to individuals, their groups and the cultural environment in which they were socialized.
Also, the question of the ratio of individual, corporate and public investments in human capital and its individual parts remains very important. In Russian conditions, with the highest degree of social inequality, very few strata have the possibility of sufficient individual investments in human capital. In our study, they are represented by wealthy entrepreneurs, highly qualified specialists and managers, characterized by the greatest human capital in all respects. The group of state (municipal) employees increases their high-quality human capital mainly at the state expense. All other groups have very modest opportunities to receive “start-up” capital in general and vocational schools, a minimum of medical services and some social benefits for certain categories of the poor in budgetary public services. All further growth is provided at best by corporations; in the Arctic and other raw materials-based regions this is the most promising option. Many other organizations do not have such capabilities. Thus, the majority of low-income workers have to deal with a vicious circle of simple reproduction and use of their human capital, which is often reduced to the price (cost) of workforce. It is necessary to break this vicious circle through multi-channel financing, stimulation and motivation for the growth of human capital and its effective use in the digital economy: high-tech industries and services.
References Reproduction of Human Capital in the Arctic Regions of Russia: Socio-Cultural Context
- Coleman J. Social and human capital. Obshchestvennye nauki i sovremennost’=Social Sciences and Contemporary World, 2001, no. 3, pp. 20–41 (In Russian).
- Schultz T. Investing in People. The Economics of Population Quality. Berkeley: University of California Press, 1981. 175 p.
- Becker G. Human Capital: A Theoretical and Empirical Analysis, with Special Reference to Education. New York: National Bureau of Economic Research, 1994. 392 p.
- Bourdieu P. Forms of capital. Ekonomicheskaya sotsiologiya=Journal of Economic Sociology, 2002, vol. 3, no. 2, pp. 60–74 (In Russian).
- Radaev V.V. The concept of capital, forms of capital and their conversion. Ekonomicheskaya sotsiologiya=Journal of Economic Sociology, 2002, vol. 3, no. 2, pp. 20–25 (In Russian).
- Kobzistaya Yu.G. Human capital: Concept and features. Fundamental’nye issledovaniya=Fundamental Research, 2018, no. 2, pp. 118–122 (In Russian).
- Oshchepkova D.S. On the estimate of human capital. Vestnik Tomskogo gosudarstvennogo universiteta. Ekonomika=Tomsk State University Journal of Economics. 2016, no. 2 (34), pp. 88–98 (In Russian).
- Ployhart R.E., Nyberg A.J., Reilly G., Maltarich M.A. Human capital is dead; Long live human capital resources. Journal of Management, 2014, no. 40, pp. 371–398.
- Gorshkov M.K. On the influence of non-economic factors on the socio-economic development of society. Gumanitarii Yuga Rossii=Humanities s Scholar of the South of Russia, 2015, no. 1, pp. 15–25 (In Russian).
- Ilyin V.A., Morev M.V. Focus on finances as a factor of Russia’s national vulnerability in the 21st century. Ekonomicheskie i sotsial’nye peremeny: fakty, tendentsii, prognoz=Economic and Social Changes: Facts, Trends, Forecast, 2021, vol. 14, no. 3, pp. 9–33 (In Russian).
- Chesebiev A.A. Human capital as a special factor in economic and political power of the state. Nauchnyi zhurnal KubGAU=Scientific Journal of Kuban State Agrarian University, 2016, no. 119 (05), pp. 1–13 (In Russian).
- Tuguskina G.N. Managing the development of human capital in terms of innovative development of the region. Russian Journal of Management, 2016, vol. 4, no. 1, pp. 39–46 (In Russian).
- Blaug M. 100 velikikh ekonomistov posle Keinsa [Great Economists since Keynes: An Introduction to the Lives and Works of One Hundred Modern Economists]. Translated from English. Saint Petersburg: Ekonomicheskaya shkola. 2005. 352 p.
- Boztosun D., Aksoylu S., Ulucak Z.Ş. The role of human capital in economic growth. Economics World, 2016, vol. 4, no. 3, pp. 101–110.
- Sinitsyna V.V. formation and development of the human potential conception. Vestnik Finansovogo universiteta. Gumanitarnye nauki=Humanities and Social Sciences. Bulletin of the Financial University, 2019, no. 9 (6), pp. 150–155 (In Russian).
- Human Development Report – 2019. UNDP. Available at: http://hdr.undp.org/sites/default/files/hdr2019.pdf
- Klinova M.V., Sidorova E.A. Human capital in the European Union: State and supranational contexts. Voprosy ekonomiki, 2012, no. 8, pp. 80–97 (In Russian).
- Eskalieva A.Zh. Human capital and human resources: Problems of their effective use. International Journal of Innovative Technologies in Economy, 2018, no. 4 (16), pp. 26–30 (In Russian).
- Bilan Y., Mishchuk H., Dzhyhar T. Human capital factors and remuneration: Analysis of relations, modelling of influence. Verslas: Teorija ir praktika, 2017, no. 18, pp. 208–214.
- Grachev S. A. Estimation of the human capital of regions on the basis of a multi-criteria approach. Voprosy upravleniya=Management Issues, 2018, no. 2 (32), pp. 46–52 (In Russian).
- Gabdullin N.M. Modern approaches and methods of measuring human capital. Voprosy innovatsionnoi ekonomiki=Issues of Innovative Economy, 2018, vol. 8, no. 4, pp. 785–798 (In Russian).
- Prishlyak E.A., Rad’ko S.G. Investigation of factors influencing the formation of human capital in the Russian Federation. Upravlencheskie nauki=Managerial Sciences, 2018, no. 8 (2), pp. 94–105 (In Russian).
- North D.C. Institutions, Institutional Change and Economic Performance. Cambridge University press, 1990. 160 p.
- Veblen T. Teoriya prazdnogo klassa [The Theory of the Leisure Class: An Economic Study of Institutions]. Translated from English. Moscow: Progress, 1984. 367 p.
- Karnyshev A.D. French background of economic psychology (devoted to 130th anniversary of Gabriel Tarde’s articles). Izvestiya Baikal’skogo gosudarstvennogo universiteta=Bulletin of Baikal State University, 2011, no. 5, pp. 209–214 (In Russian).
- Katona G. Psychological Economics. New York: Elsevier Scientific Publishing Company, 1975. 438 p.
- Simon H.A. Theories of decision-making in economics and behavioural science In: Gal’perin V.M. Vekhi ekonomicheskoi mysli T. 2. Teoriya firmy [Milestones of Economic Thought. Vol. 2. Theory of the Firm]. Saint Petersburg: Ekonomicheskaya shkola, 2000. Pp. 54–72 (In Russian).
- Kahneman D., Tversky A. Prospect theory: An analysis of decision under risk. Econometrica, 1979, vol. 47, no. 2, pp. 263–291.
- Tversky A., Kahneman D. Advances in prospect theory: Cumulative representation of uncertainty. Journal of Risk and Uncertainty, 1992, vol. 5, no. 4, pp. 297–323
- Kahneman D., Knetsch J., Thaler R. Fairness and the assumptions of economics. The Journal of Business, 1986, no. 59 (4), pp. 285–300.
- Thaler R. Novaya povedencheskaya ekonomika. Pochemu lyudi narushayut pravila traditsionnoi ekonomiki i kak na etom zarabotat’ [Misbehaving. The Making of Behavioral Economics]. Moscow: Eksmo, 2017. 368 p.
- Weber M. The Protestant ethic and the spirit of capitalism. In: Izbrannye proizvedeniya [Selected Works]. Translated from German]. Moscow: Progress, 1990. 808 p. (In Russian).
- Zabaev I.V. Religion and Economics: Can We Still Rely on Max Weber? Sotsiologicheskoe obozrenie=Russian Sociological Review, 2018, no. 3, pp. 107–148 (In Russian).
- Gorshkov M.K., Komissarov S.N. Revaluation of culture and the tasks of sociology. In: Gorshkov M.K. (Ed.). Rossiya reformiruyushchayasya: ezhegodnik. Vyp. 17 [Russia Reforming: Yearbook. Issue 17]. Moscow: Novyi khronograf, 2019. Pp. 17–47 (In Russian).
- Lapin N.I. Socio-cultural factors in Russian stagnation and modernization. Sotsiologicheskie issledovaniya=Sociological Studies, 2011, no. 9, pp. 3–12 (In Russian).
- A review of the book: Tikhonov A.V., Markin V.V. The Atlas of Upgrade of Russia and Its Regions: Socioeconomic and Sociocultural Tendencies and Problems. Collective Scientific Labor. Moscow, 2016. Sotsiologicheskie issledovaniya=Sociological Studies, 2017, no. 7, pp. 170–172 (In Russian).
- Lazhentsev V.N. The geosystem approach to the problems of social and economic development of regions of the North of Russia. Ekonomicheskie i sotsial’nye peremeny: fakty, tendentsii, prognoz=Economic and Social Changes: Facts, Trends, Forecast, 2016, no. 1 (43), pp. 81–95 (In Russian).
- Markin V.V., Silin A.N. Circumpolar region amid socio-spatial transformation of a territory (case study of Yamal). Ekonomicheskie i sotsial’nye peremeny: fakty, tendentsii, prognoz=Economic and Social Changes: Facts, Trends, Forecast, 2016, no. 6 (48), pp. 28–52 (In Russian).
- Markin V.V., Silin A.N. Human and social potential of neo-industrial development of the Arctic: Sociological analysis, modeling, and regulation. Ekonomicheskie i sotsial’nye peremeny: fakty, tendentsii, prognoz=Economic and Social Changes: Facts, Trends, Forecast, 2017, vol. 10, no. 6, pp. 75–88 (In Russian).
- Markin V.V., Silin A.N., Voronov V.V. Educational opportunities for young people of indigenous minorities of the North: Social and spatial discourse. Ekonomicheskie i sotsial’nye peremeny: fakty, tendentsii, prognoz=Economic and Social Changes: Facts, Trends, Forecast, 2019, vol. 12, no. 5, pp. 141–154 (In Russian).
- Markin V.V., Silin A.N., Vershinin I.S. Human health in the Arctic: Socio-spatial discourse (case study of the Yamalo-Nenets Autonomous Okrug). Ekonomicheskie i sotsial’nye peremeny: fakty, tendentsii, prognoz=Economic and Social Changes: Facts, Trends, Forecast, 2020, vol. 13, no. 5, pp. 182–199 (In Russian).
- Zamyatina N.Yu., Pilyasov A.N. Rossiiskaya Arktika: k novomu ponimaniyu protsessov osvoeniya [The Russian Arctic: Toward a New Understanding of Development Processes]. Leningrad: Lenand, 2019. 400 p.
- Shabunova A.A., Okulova N.A. Assessment of the socio-cultural environment of the region by the population. Sotsiologicheskie issledovaniya=Sociological Studies, 2011, no. 6, pp. 36–43 (In Russian).
- Samoregulyatsiya i prognozirovanie sotsial’nogo povedeniya lichnosti: Dispozitsionnaya kontseptsiya [Self-Regulation and Forecasting of Social Behavior of the Individual: Dispositional Concept]. Second edition, expanded. Moscow: TsSPiM, 2013. 376 p.
- Glukhikh P.L. et al. Predprinimatel’skaya kul’tura molodezhi v munitsipal’nom obrazovanii: otsenka, upravlenie i razvitie [Entrepreneurial Culture of Youth in a Municipal Entity: Assessment, Management and Development]. Yekaterinburg: Institut ekonomiki UrO RAN, 2017. 117 p.
