Research on Trusted Industrial Control Ethernet Network

Author: ZHOU Sen-xin, HAN Jiang-hong, TANG Hao
Journal: International Journal of Computer Network and Information Security(IJCNIS) @ijcnis
Article in issue: 2 vol.2, 2010.
Free access
Industrial control Ethernet networks are more important in connecting with equipments each other of enterprise comprehensive automation and integrating information. With the explosive growth of network techniques, the traditional control networks can no longer satisfy the security demands on network connectivity, data storage and information exchanges. New types of networks emerged in recent years in order to provide solutions for the increasing requirements on networked services. We propose a trust evaluation model for industrial control Ethernet network. Our study shows the importance and necessity of applying theoretical analyses to understand the complex characteristics of trusted industrial control Ethernet networks.
Trusted industrial network, Security, Trust Model, Controllability, Survivability
Short address: https://sciup.org/15010994
IDR: 15010994
Text of the scientific article Research on Trusted Industrial Control Ethernet Network
Published Online December 2010 in MECS
Industrial control Ethernet networks are more important in connecting with equipments each other of enterprise comprehensive automation and integrating information. With the explosive growth of network techniques in the last decade, the traditional centralized server-based management can no longer satisfy the requirements of next generation networks. So people started to propose new concepts of network infrastructure and management. In the meanwhile, the fast proliferation of networked devices and applications, such as sensor networks and pervasive computing, integrates information technology into our environments. These dramatic changes create unique challenges for network management and control. Innovative solutions are required for managing network security and dynamics, astronomical number of data and enormous information exchanges.
Recently, the industrial network becomes an indispensable component among automated systems. Especially, as the systems are required to be more intelligent and flexible, the systems should have more sensors, actuators, and controllers, often referred to as field devices. In most cases, these field devices require some type of electrical connection because they are distributed over a certain area. As the number of devices in a system grows and the functions of the system need to be more intelligent, these devices need to exchange the rapidly increasing amount of data among them. Conventionally, these devices are connected with point-to-point or direct connections, where each pair of devices requires at least one electrical cable. This approach is not suitable any more for the system composed of many devices because the number of cables is proportional to the square of the number of devices. As an alternative to the point-to-point connections, many industrial networks have been adopted, which can accommodate various data with shared transmission medium. Because the industrial network has more advantages than the point-to-point connection such as reduction of wiring and ease of maintenance, its application areas have grown to include various applications such as process automation system, automated manufacturing system, and automated material handling system [1,2].
The past ten years have seen considerable growth in the number of organizations adopting managed networks based on an IP infrastructure. This market-place has steadily evolved over the years with an increase in access speeds offered, changes in core transport technologies and more stringent customer demands centered both on cost and on service levels, largely focused on delivery time-scales and network availability.
In general, data exchanged on an industrial network can be classified into two groups: real-time and non-real-time data. Non-real-time data do not have stringent time limits on their communication delays experienced during the data exchange. In contrast, real-time data have very strict time limits and the data’s value is diminished greatly as the communication delay grows larger. This real-time data can be further divided into periodic and asynchronous data, depending on the periodic nature of the data generation. For example, the data for program download belong to non-real-time data, while digital control command and alarm signal are periodic and asynchronous real-time data, respectively. On many industrial networks, these data types are sharing a single network although they have different requirements on communication. That is, the non-real-time data need assurance of delivery without error and duplication, while the real-time data are concerned mostly on the time taken to reach the destination. Therefore, when building an industrial network, the designer must configure the network to satisfy these requirements. In order to satisfy the real-time requirements, many industrial networks, often referred to as fieldbus, have been developed by various standard organizations since the late 1980s. The IEC 61158 field bus standard with eight protocols, including Profibus, Fieldbus Foundation and WorldFIP, was announced as an international standard in the late 1990s [3]. Although the fieldbuses are able to satisfy the real-time requirements of field devices, they suffer from their high hardware and software cost and uncertain interoperability of multiple-vendor systems. These shortfalls are hindering the adoption of fieldbuses in numerous application areas. As an alternative to the fieldbus, Ethernet has attracted some attention because of its simplicity and wide acceptance. However, it has been known that Ethernet is not suitable for industrial networking because the medium access control (MAC) method of Ethernet is the contention-based carriersensing multiple access/collision detection (CSMA/CD) that exhibits unstable performance under heavy traffic and unbounded delay distribution [4]. In the last decade, several researchers, including Park and Yoon [4], Christensen [5], and Vitturi [6], have been trying to reduce collisions of Ethernet. Because these approaches require modifications in the data link layer or the TCP/IP layer, these still have limitations for practical applications. Recently, the switched Ethernet shows a very promising prospect for industrial networking because the switching technology can eliminate frame collisions. Because the Ethernet without collisions is no longer unstable under heavy traffic and its delay can be drastically reduced, the adoption of switched Ethernet as an industrial network is seriously considered along with the appearance of inexpensive switches [7–9]. More especially, High-Speed Ethernet (HSE) has been included in IEC 61158 fieldbus mainly as a network backbone at a higher level of automation hierarchy [10].
This paper presents the trust evaluation model of the switched Ethernet as communication network for interconnecting various components of real-time control systems. It looks at the factors affecting network performance, starting from basic statistical tools, such as queuing theory. It considers what techniques are available for assessing whether a network is capable of meeting the desired service levels, which are likely to be expressed in terms of throughput, delay and packet loss. We consider what techniques are available for assessing whether a network is capable of meeting the desired service levels, likely to be expressed in terms of throughput, delay and packet loss. Traditional queuing-based methods of dimensioning and the challenges offered by new insights into data arrival patterns are examined. We also demonstrate how modern QoS management techniques can control, but also complicate, prediction, and will finally illustrate how semi-empirical statistical techniques offer some resolution.
This paper is organized into six sections including this introduction. Section 2 gives Real-time performance analysis for industrial Ethernet network, and Section 3 presents the analysis for Self-similar behavior of the switched Ethernet. A trust evaluation model for industrial control Ethernet network is implemented and evaluated in Section 4, and a set of Ethernet control network system model for trust evolution in opnet 14.5 simulation environments is implemented and its trust value is evaluated in Section 5. Finally, summary and conclusions are presented in Section 6.
I. Real-time performance analysis for
industrial Ethernet network
The networks, systems, software applications, and data of many enterprises and organizations form a critical foundation and essential structure for industrial network. Without a reliable and functional network, the network control system is not secure. There are three key components of control networks analysis are network architecture, network protocols, and network performance analysis. The goal of a control network is to provide a guaranteed quality of service such as deterministic time delays and maximum throughput for real-time control applications. These networks target various types of industrial automation and processing applications and are distinguished through static parameters such as data rate, message size, medium length, supported topology, number of nodes, and dynamic parameters such as MAC mechanism, message connection type, interoperability, and interchangeability. The modeling and control of NCSs are based on the analysis framework in time-delay systems which have been studied for several decades. In general, delays occur in the transmission of signals or materials between different subsystems.
In general, there are four major contributions to the delay in passing a single packet across a communications line. These are: the serialization delay, which is given by the time it takes to transmit a single packet across a telecommunications link; the propagation delay, which is dependent on the length of the circuit and is calculated by dividing the length of the medium by the speed of light in that medium ; the queuing delay, i.e. the time the packet spends in the transmitting device output buffer awaiting serialization/transmission, which is dependent on link utilization and service time ; the time taken for the router to process packets.
-
6 •—— ^^^^^™ propagation delay
-
5 — — — — serialisation
^^■^^™ mean queuing delay (M/M/l)
-
4 —
E
^ 3 *
1 —
ОI_______1______1______1_______1_______1______1_______1______1_______1_______J
100 200 500 400 500 600 700 800 900 100C distance,. Ikm
Figure 1. proportional impact of propagation delay
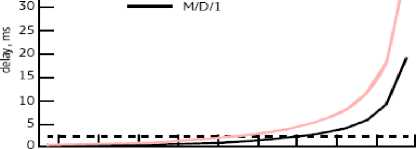
Figure 1 shows how these contribute to the delay for a 2048 kbit/s link, running at a utilization of 65% carrying 512-byte packets. It can be seen that at distances below 350 km, the propagation delay is insignificant, becoming the dominant contributor to packet propagation when the circuit length exceeds 700 km. The queuing component is normally evaluated using one of two models: M/M/1 where the packet size is variable and M/D/1 where the packet size is constant. (here the symbol M indicates Markovian behavior and D indicates Deterministic behavior). The queuing mechanism is held to comprise three main components — an arrivals process, the queue server and the service process. In the case of the M/M/1 queue, both the arrivals and service processes are governed by a Poisson distribution, whereas with the M/D/1 queue, the arrivals process has the Poisson form and the service process is deterministic. Following through the statistical analysis of this model gives a final prediction of the mean queuing delay (based on the average packet size and serial delay) as:
mean queuing delay = serialization delay Xp /(1- p )
where p is the link utilization and the packets being processed are of variable size. The M/D/1 model is used where the packet size is fixed and gives a queuing delay of:
mean queuing delay = serialization delay X 1/2 Xp /(1 - p )
- M/M/L
■ serialisation
5 15 25 35 45 55 65 75 85 95
link utilisation, %
Figure 2. Queuing delay as function of link utilization
The impact of link utilization on queuing delay is shown in Fig 2. It can easily be seen from Fig 2 that the queuing delay is almost negligible at link utilizations of less than 35%, but that it becomes progressively more important, increasing dramatically as link utilization exceeds 70%.It can also be seen that the queuing impact is more pronounced for an M/M/1 type queue. At relatively long service times, if for example low speed links are used, the queuing delays become rather less than user acceptable. The analysis so far has worked exclusively with mean values of delay; however, network providers are increasingly been asked for service level guarantees of network performance. A large number of transactions will experience delays that are either shorter or longer than the mean; consequently it is dangerous to base service guarantees on mean delay figures. Further statistical analysis, for the above example, shows that if the mean delay for a telecommunications system is given as 2 ms, then 90% of packets will experience a delay of 8.92 ms or less; 95% will experience a delay of 12.4 ms or less and 99% will experience a delay of 14.8 ms or less. [15].
II. Self-similar behaviour
Self-similar traffic has been shown to exist in networks and it seems to be a ubiquitous phenomenon that is independent of technology, protocol and environment. A self-similar phenomenon represents a process displaying structural similarities across a wide range of scales of a specific dimension. In other words, the reference structure is repeating itself over a wide range of scales and the statistics of the process do not change. However, these properties do not hold indefinitely for real phenomena and at some point, this structure breaks down. Self-similarity can therefore be associated with “fractals” which are objects with unchanged appearances over different scales. A stochastic process is called fractal when a number of relevant statistics exhibit scaling with related scaling exponents. Since scaling leads mathematically to power-law relationships in the scaled quantities the conclusion is therefore that the traffic shows fractal properties when several estimated statistics exhibit power-law behavior over a wide range of time scales [1]. A continuous-time stochastic process X(t) is considered to be statistical self-similar with parameter H(0.5 ≤ H ≤ 1.0) if, for any real positive “a”, the process a-Hx(at) has the same statistical properties as x(t). The parameter H is known as the Hurst parameter, or the selfsimilarity meter, and it is a key measure of self-similarity. More precisely H is a measure of the persistence of a statistical phenomenon and it is the measure of the length of the long-range dependence of a stochastic process. A value of H=0.5 indicates the absence of long-range dependence. The closer H is to 1 the greater the degree of persistence or long-range dependence. As a practical and effective method to bring guaranteed QoS support to control networks, priority queuing has currently become a popular research topic. However, there are many open issues concerned with the quantitative network performance, such as expected queue length, overflow probability, packet loss rate and so on. Our research is motivated by these issues, which are of significant importance due to the fact that statistically bounded traffic oriented performance evaluations lead directly into system and network design criteria for future control networks. On the other hand, recent studies have shown that existing packet switching networks experience self similarity [2-4]. It has also been shown that the selfsimilar or long-range dependent stochastic process can better model high-speed networks than Poisson or Poisson-based processes, due to the capability of being able to capture the fractional property of network traffic across a wide range of time scales. We first introduce the techniques that we use to generate self-similar network traffic .Then we compare the performance of an Ethernet segment run with heavy-tail traffic and with exponential traffic. Our study results show that self-similar traffic, compared with traditional short-range dependent models, requires longer queues and thus larger buffers in the control network design.
Work done by a number of researchers has demonstrated that Poisson arrival modeling underestimates the quickness and therefore delay characteristics of data traffic. This and the work of other researchers has examined packet arrival times, looking closely at the fit with self-similar behavior. While the poor fit given by the Poisson analysis is amply demonstrated, the literature focuses heavily on packet arrival times, concluding that the quickness of modern traffic patterns will have an adverse effect on queuing times.
For LAN traffic the Hurst parameter to be around 0.8. A Poisson process assumes that bursts are predictable and that aggregation masks this quickness; consequently bursts are only evident at small time-scales. Self-similar models are characterized by bursts that have no natural length and aggregation intensifies quickness, which is seen at all time-scales. One implication of self-similarity is that during periods of network congestion, congestion is persistent and losses can be high. Larger buffers do not prevent losses, periods of congestion are hard to predict and convergence recovery is probably more important than congestion avoidance. Source models for individual Ethernet users are expected to show extreme variability in terms of inter-arrival times for packets. The nature of congestion, produced by self-similar network traffic models, differs significantly from that produced by standard formal models and displays a far more complicated pattern than was assumed in the past. The more complicated nature of congestion due to the selfsimilar traffic behavior can be expected to persist, even at high line speeds.
Recent studies have demonstrated self-similarity in LAN and WAN traffic; Kim and Min [14] used a G/M/1 queuing model1 to model a network with self-similar traffic. They compared the analytic average queuing delay of self-similar traffic to the delay of a simulated model, to obtain a useful method for delay prediction. The simulation was done using OPNET, adjusting a single parameter of the truncated power-tail (TPT) distribution, thus allowing the analytic curve to follow the simulated results. They were able to predict the delay by computing the TPT, based on the measured Hurst parameter of the input traffic, the data arrival rate and the utilization of the router. They were able to generate a model using self similar arrival times and exponentially distributed service times and packet sizes. When H=0.5 the behavior of G/M/1 tends to be close to M/M/1 but the average queuing delay of a router modeled by G/M/1 was shown to be greater than that from M/M/1, with the gap increasing with the magnitude of the Hurst parameter[15]. This comparison is shown in Fig 3.
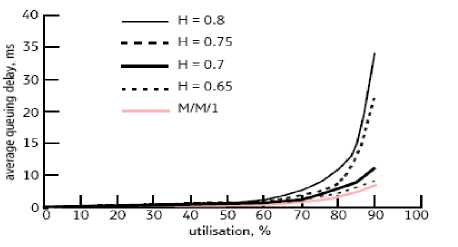
Figure 3. comparison between m/m/1 and G/M/1(self-similar) delay and utilization plots
III. A Trust Evaluation Model for Industrial Control Ethernet Network
Trust is important and critical for network security. It integrates with several components of network management, such as risk management, access control and authentication. Trust management is to collect, analyze and present trust related evidence and to make assessments and decisions regarding trust relationships between entities in a network. In this paper, we will focus on the evaluation of entity trust based on trust information provided by computing the TPT, based on the measured Hurst parameter of the input traffic, the data arrival rate and the utilization of the router at control networks layer. We also study the source node makes a decision on trusting the target node based on the port file it receives from the target node at networked devices layer. Other layer trust information will be computed based on their trust related evidence.
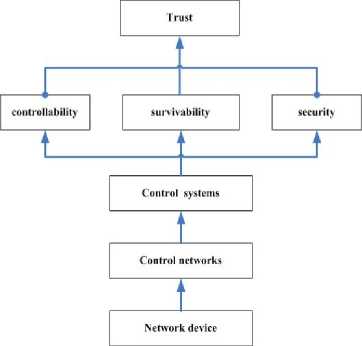
Figure 4. Trust Evaluation Model
-
A. Networked devices layer
Networked devices include smart sensors, smart actuators and networked controllers. Smart sensors and actuators have three major features: data acquisition, intelligence and communication ability. Each node (sensors, actuators and controllers) maintains a table of the history for their availabilities. The performance of a particular node in the network is stored in the local environment. Devices that operate in a control network are energy constrained. When a request is sent by a source node for recommendations about a particular node, a node may be selfish and not reply so as to conserve its energy. Due to lack of recommendations, the source node is unable to determine a reliable trust level on a particular target node in the network even though the node may be a trustworthy node. Therefore, to deal with such a situation, an exchange of port file takes place. At the end or break of any communication between two nodes, they exchange a credential letter based on their experience with each other. When a node n has finished communication with a node x, the following exchange takes place: node n to node x:( n trusts x, context c1; time t1; n trusts x, context c2; time t2 ……n trusts x, context cn; time tn,K) This means that node n trusts node x in the context ci at a time stamp ts. Context here can be quality of service (QoS) or Availability (A). This credential letter is signed by the private key (K) of the node n, thus ensuring that a node will not send fake credentials. Hence when a node encounters a situation where very few nodes reply to a request for recommendations, it directly requests the target node for the port file of credentials it has received from other nodes. The target node collects the credentials it has received and creates a port file of credentials. For example:{(a0.5y,A,100), (a0.75y,QoS,100), (c0.4y,A,150), (c0.25y, QoS; 150), k }.Here node a trusts node y for 0.75 the communications to be trustworthy as far as 0.5 availability is concerned. The source node makes a decision on trusting the target node based on the port file it receives from the target node.[16]
-
B. Control networks layer
There are three key components of control networks analysis are network architecture, network protocols, and network performance analysis. Network architecture allows devices such as sensors, actuators, and controllers to be interconnected together, using less wiring, and requiring less maintenance than a point-to-point architecture. It also makes it possible to distribute processing functions and computing loads into several small units. The performance metrics of network systems that impact control system requirements include access delay, transmission time, response time, message delay, message collisions, message throughput, packet size, network utilization, and determinism boundaries. The goal of a control network is to provide a guaranteed quality of service such as deterministic time delays and maximum throughput for real-time control applications. There are now a large number of networks available for applications at the information level as well as at the device level. These networks target various types of industrial automation and processing applications are distinguished through static parameters such as data rate, message size, medium length, supported topology, number of nodes, and dynamic parameters such as MAC mechanism, message connection type, interoperability, and interchangeability. The trust for this layer is decided by utilization and Hurst parameter of the input traffic. As is shown fig3 when utilization is more 80% for h = 0.8 the average queuing delay will be more 10ms.Here the layer will be not trustworthy.[15]
-
C. Control systems layer
The goal of NCS design is to guarantee the stability and the performance of applied control systems, i.e., meets the control system specifications. These specifications include phase margin, gain margin, overshoot, steady state error, and tracking error. Simply speaking, the limited network bandwidth introduces unavoidable time delays in a control system. These time delays could potentially degrade a system's performance and possibly cause system instability. The trust for this layer is decided by system control model and trust value of above layer.
-
D. Trust layer
This layer is to provide a dynamic trust evolution that is multi-dimensional, that is, the trust evolves depending on controllability, survivability and security. The trust evolution may be quality of work done by control system for specific demands. It is a function of controllability, survivability and security defined by the user.
IV. Experiments
We devised a set of Ethernet control network system model for trust evolution in opnet 14.5 simulation environment. As required for the Truncated Binary Exponential Back-Off algorithm, the wait periods after a collision in each Ethernet station are strictly bound between lower and upper limits. To simulate realistic network conditions, our specification model includes bursty traffic generators. Bursty traffic is an infinite sequence of frames with sub-sequences of closely spaced (in time) frames interspersed with sub-sequences of widely spaced (in time) frames, i.e., a plot of frames over time shows peaks and plateaus. Bursty traffic has a long tailed (power law) probability distribution and is typically modeled using a Poisson Pareto Burst Processes with heuristics to enable a close fit to observed data. To circumvent the issue of having to choose correct heuristics, a simple power law distribution is used in our setup.
The Raw Packet Generator (RPG) model is a traffic source model that is used to generate self-similar traffic. Self-similar traffic is characterized by the same fractal properties that are present in the traffic generated by many of today’s network applications. The Fractal Point Processes (FPPs) have been implemented: Sup-FRP, PowON-PowOFF, PowON-ExpOFF, ExpON-PowOFF, Fractal Power-Law Filter, Exponential Rectangular Filter, Fractal Rectangular Filter. The PowON-ExpOFF model is based on a superposition of ON/OFF sources of which the ON-times have a heavy-tailed distribution and the OFF-times an exponential distribution. The model has five parameters: the average arrival rate, the Hurst parameter, the Fractal Onset Time Scale (FOTS), the source activity ratio and the peak-to-mean ratio. Two workstation node models and one Ethernet station node model support selfsimilar traffic. All RPG models can be accessed through the RPG object palette. The ppp_rpg_wkstn models a self-similar traffic source running over an IP stack with a serial interface. The Ethernet_rpg_wkstn models a selfsimilar traffic source running over an IP stack that supports an underlying Ethernet interface. The ethernet_rpg_station models an Ethernet station where an RPG module resides directly over the MAC layer. All of the RPG nodes have an “RPG Traffic Generation Parameters” attribute that is used to specify the characteristics of the self-similar traffic. Clicking in the Value field of this attribute opens up the RPG Traffic Generation Parameters Table, which is used to specify the traffic’s arrival process, packet size, destination, and start time. A source can generate self-similar traffic using one or more arrival processes. To use more than one arrival process, specify each process in a separate row of the RPG traffic generation parameters table. Specifying the arrival process allows you to choose the fractal point process (FPP) which best describes the self-similar traffic that you are modeling. The Arrival Process attribute is a compound attribute that is composed of several subattributes. Since different FPPs require different input parameters, certain sub-attributes will not apply to some arrival processes. Choosing an arrival process from the pull-down menu sets default values for the process’ subattributes; you can then view or modify these values by selecting Edit from the Arrival Process attribute’s pulldown menu. A default value of N/A indicates that the sub-attribute is not used for the given arrival process and should not be modified. For example, since the Source Activity Ratio sub-attribute is only used with the ON-OFF arrival processes, its value is set to N/A for all of the other arrival processes.
The effect of adding the power law distributed delays is to increase the average delay in all cases when this delay interval is non-zero. This is because the number of collisions increases with the incoming frame rate (bursty traffic). In contrast, when the power law distributed delay interval is zero; the average delay has approximately the same value as if this additional delay is not present at all. The next phase of our experiments involves creating specification models for quality-of-service (QoS) algorithm that works at the Ethernet layer.
Random Early Detection (RED) is used for congestion control and manages queue size intelligently. Unlike regular queues that drop packets from the tail when they are full, RED does it in a controlled and gradual way. Once the queue size attains a certain average length, enquired packets have a finite probability of being marked. A marking probability exceeding a predefined threshold means that the marked packet will be dropped. The marking probability increases linearly with the queue size up to a maximum dropping probability. The average queue size used for determining the marking probability is calculated using an Exponential Weighted Moving Average, insensitive to bursts.
When the average queue size is below a preset minimum bound, no packet is marked. When the average queue size exceeds the minimum queue length, the marking probability increases linearly until the average queue size attains the preset maximum queue length. As probability is normally not set to 100%, the queue size might rise above the maximum preset size. Hence, a limit parameter is provided to set a hard maximum for the size of the queue. RED uses a number of predefined and computed parameters. The predefined parameters are maximum dropping or marking probability, minimum and maximum queue lengths and queue weight. The parameters computed per iteration are count, average queue length, queue length and dropping or marking probability. Count is the number of frames since the last marked frame. For our simulation, we used the same values for the predefined parameters. In addition, the algorithm uses a linear function of time to determine the time interval since the queue was empty. In our case, we use simple difference in measured times to achieve this effect. Trust evolution of other layer was computed with data which we had collected. The experiment result shows our model is availability.[15]Some experimental data and trust evaluation computing at a time are as follows:
TABLE I. T able of trust evaluation computing at a time
|
layer |
parameters |
Computing formula |
Trust value |
|
Network ed devices |
(a0.75y,QoS,8 0) (a0.75y,A,90) |
If A>70 then trust = QoS |
Trust value for Node a to y is 80% |
|
control networks |
H=0.8, utilization=70 % delay time=9ms |
For real time control signal=(delay time)/10* (*:real time control delay time requests lower then 10ms) |
Trust value for this layer is 90% |
|
Control systems |
System stability=100 %, sytem performance =98% |
If System stability>=90% then trust = sytem performance |
Trust value for this layer is 98% |
|
Trust layer |
Controllability =80%, survivability= 72% , security=98% |
Trust =(-clog2c+-s1log2s1+-s2log2s2)/T (c: Controllability,s1: Controllability,s2: Controllability,T=c+s1 +s2) |
Trust value for this layer is abou 0.83 |
V. Conclusions
The management of industrial control Ethernet networks has gained increasing attention because of their wide applications and control difficulties. Without the global management and control on the network, a small change in local domain may result in dramatic behavior changes on the whole network. Therefore, it is essential to understand the behavior of industrial control networks before conducting any network management and control. In this work, we study the characteristics of Ethernet networks under the context of distributed trust management. Even though the trust evaluation rule we used is very simple, our analyses show extraordinary complexity in terms of the system performance. The analytic results enable us to design the evaluation rule that achieves desired performance.
Our work is just the first step on the exploration of understanding industrial control Ethernet networks trust management. We proposed an evaluation rule based on the global estimation result. This general rule can help to design rules that are feasible for different situations. Evaluation rules based on controllability ,survivability and security of industrial control Ethernet networks makes the evaluation adaptive to trust dynamics. Trust dynamics is one of the main issues in autonomous networks. So it is necessary to integrate more trust contents into the evaluation rule. Future work will investigate adding more parameters to availability and quality of service for the derivation of trust. An optimization model for trust evaluation rule of industrial control Ethernet networks is needed. Other areas for future work include a more precise definition of controllability, survivability and security.
Acknowledgment
References Research on Trusted Industrial Control Ethernet Network
- A. Willig, A. Wolisz, Ring stability of the PROFIBUS tokenpassing protocol over error-prone links, IEEE Trans. Ind. Electron. 48 (2001) 1025– 1033.
- S. Lee, K.C. Lee, M.C. Han, J.S. Yoon, On-line fuzzy performance management of Profibus networks, Comput. Ind. 46 (2001) 123– 137.
- IEC 61158-4, Digital data communications for measurement and control—Fieldbus for use in industrial control systems—Part 4: Data link protocol specification (IEC, 1999).
- J.H. Park, Y.C. Yoon, An extended TCP/IP protocol for real-time local area network, Control Eng. Pract. 6 (1998) 111 – 118.
- K.J. Christensen, A simulation study of enhanced arbitration methods for improving Ethernet performance, Comput. Commun.21 (1998) 24– 36.
- S. Vitturi, On the use of Ethernet at low level of factory communication systems, Comput. Stand. Interfaces 23 (2001)267– 277.
- G. Ye, H. Deng, L. Chen, L. Liu, X. Wang, A prototype switched Ethernet data acquisition system, Fusion Eng. Des. 43 (1999) 413– 416.
- B.Y. Choi, S. Song, N. Birch, J. Huang, Probabilistic approach to switched Ethernet for real-time control applications, Proceedings of Seventh International Conference on Real-Time Computing Systems and Applications, 2000, pp. 384– 388.
- E. Vonnahme, S. Ruping, U. Ruckert, Measurements in switched Ethernet networks used for automation systems, Proceedings of 2000 IEEE International Workshop on Factory Communication Systems, 2000, pp. 231– 238.
- D.A. Glanzer, Plantwide data integration using FOUNDATION fieldbus, Hydrocarbon Process. 80 (2001) F20– F22.
- M.Y. Chow, Y. Tipsuwan, Network-based control systems: a tutorial, 27th Annual Conference of the IEEE Industrial Electronics Society, Denver, 2001, pp. 1593– 1602.
- G.C. Walsh, Y. Hong, Scheduling of networked control systems,IEEE Control Syst. Mag. 21 (2001) 57–65.
- Gokhale and Trivedi, “Analytical Models for Architecture-Based Software Reliability Prediction: A Unification Framework”, IEEE Transactions Volume 55, Issue 4, 2006, pp. 578–590. International Journal of Grid and Distributed Computing Vol.3, No.1, March, 2010
- Leys P, Potemans J, Van den Broeck B, Theunis J, Van Lil E and Van de Capelle A: Use of Raw Packet Generator in OPNET, http://www.esat.kuleuven.ac.be/telemic/networking/opnetwork02_ pieter.pdf
- E A Smith,Understanding performance issues in IP networks, BT Technology Journal Vol 24 No 4,2006, pp. 172– 178
- S. Chinni et al, Trust model for certificate revocation in ad hoc networks, Ad Hoc Networks 6 (2008) 441–457
