Reserves of dairy cattle breeding growth in the Vologda oblast in the context of solving state strategic tasks to develop the arctic

Author: Chekavinskii Aleksandr Nikolaevich
Journal: Economic and Social Changes: Facts, Trends, Forecast @volnc-esc-en
Section: Economics of the agro-industrial complex
Article in issue: 4 (40) т.8, 2015.
Free access
The article substantiates the expediency of conducting research to assess the state of the agro-food system in the regions of the European North of Russia due to the increased geopolitical risks and the need to achieve strategic objectives of the Arctic territories development. Based on the analysis of statistical information, materials of the Department of Agriculture and Food Resources of the Vologda Oblast the author analyzes the change in the value of milk production, identifies municipal regions where agricultural producers boost agricultural economics, describes trends in the structure of livestock in 2000-2014. The work shows that the major resource potential for the dairy cattle breeding development in the region is concentrated in Vologdsky District, Gryazovetsky District and Cherepovetsky District. The analytical grouping helps determine that given current market conditions, state of material and technical base of the industry and level of state support it is economically feasible to increase the productivity of cows to 7083 kg, as it allows to reduce unit costs and enhance profitability...
Dairy cattle, cows, reserves of milk production growth
Short address: https://sciup.org/147223741
IDR: 147223741 | UDC: 338.43(470.12+98) | DOI: 10.15838/esc/2015.4.40.9
Text of the scientific article Reserves of dairy cattle breeding growth in the Vologda oblast in the context of solving state strategic tasks to develop the arctic
The 21st century witnessed significant intensification of globalization and the role of transnational corporations, increased competition between countries for influence and control over certain territories. This statement is justified by many examples when companies in developed countries, particularly, spreading “fast food”, purposefully impose consumption of food harmful to human body. It leads to an increase in the number of diabetes and obesity. It is known that some governments used technologies of “artificial hunger” (poisoning of water, resettlement of population to the land unsuitable for agriculture). It involves not only reduction in the population on the dependent territories, but also transfers of the land in property of foreign persons, which means loss of sovereignty1. Transnational companies have a significant impact on national agro-food systems. Being largest producers of seeds, plant protection products and controlling food prices they, in fact, determine agricultural policy of some countries2.
Russia is also the country influenced by geopolitical competitors3. The external threats occur at any state border, including in the Arctic. The development of this region is a very important strategic task, since, according to the domestic scientists, there are 80 billion tons of conditional fuel in oil equivalent, about 19% of world reserves of platinum group metals, 10% of nickel and titanium, 3% of zinc, cobalt, gold and silver [2]. The field development in the Arctic in the near future is associated with the implementation of large-scale investment projects in infrastructure, transport, mining and engineering industries4. Consequently, it will involve the increase in food production to meet needs of the population in the European North of Russia5.
Specialization of most economic entities in the region in the extraction of minerals forms a special structure of the economy. Therefore, it is advisable to consider Arctic territories in terms of neighboring areas development – as a
Table 1. Distribution of the number of rural settlements by population (according to the results of the 2010 Russian census)
|
Region |
Number of rural settlements |
||||||||||||||
|
о н |
о |
5° |
аз lo |
7 ° |
5° |
■ 1 o’ |
5° |
■ 1 o’ |
5° |
s § |
o^ |
||||
|
Republic of Karelia |
776 |
109 |
14.0 |
300 |
38.7 |
75 |
9.7 |
76 |
9.8 |
54 |
7.0 |
76 |
9.8 |
86 |
11.1 |
|
Komi Republic |
720 |
36 |
5.0 |
177 |
24.6 |
73 |
10.1 |
91 |
12.6 |
91 |
12.6 |
153 |
21.3 |
99 |
13.8 |
|
Arkhangelsk Oblast |
3970 |
848 |
21.4 |
1986 |
50.0 |
330 |
8.3 |
288 |
7.3 |
198 |
5.0 |
199 |
5.0 |
121 |
3.0 |
|
Vologda Oblast |
8006 |
2131 |
26.6 |
4366 |
54.5 |
546 |
6.8 |
369 |
4.6 |
247 |
3.1 |
229 |
2.9 |
118 |
1.5 |
|
Murmansk Oblast |
112 |
14 |
12.5 |
28 |
25.0 |
10 |
8.9 |
13 |
11.6 |
7 |
6.3 |
12 |
10.7 |
28 |
25.0 |
|
Total |
13584 |
3138 |
23.1 |
6857 |
50.5 |
1034 |
7.6 |
837 |
6.2 |
597 |
4.4 |
669 |
4.9 |
452 |
3.3 |
Sources hereinafter: data of the Federal State Statistics Service of the Russian Federation; calculations of the author.
single socio-economic system. Interaction between regions can form the basis of food security in the European North and provide the population with quality food of local production.
The increasing attention to the state of the agricultural system in the region is caused not only by foreign policy issues and strategic objectives, but also by the fact that its sustainable development influences the demographic situation, the possibility to preserve historical and cultural potential of the Russian village and control the territory. Nowadays, this problem becomes very relevant. Thus, according to the 2010 Russian census, in the studied territories 23% of the rural settlements are unpopulated and less than 25 people live in half of them (tab. 1).
Despite the measures of state support of agriculture6, implemented in the framework of the national priority project “Development of agriculture” and then State program, the agricultural crisis in the European North was not alleviated. This, in particular, is evidenced by the fact that in 2014, compared to 2000, the volume of agricultural production increased by 1.5 times in the country, while in the Komi Republic it amounted to 88%, the Republic of Karelia – 81%, the Vologda Oblast – 73%, the Arkhangelsk Oblast – 61%, the Murmansk Oblast – 59% ( tab. 2 ).
6 See more: Chekavinskii A.N. Razvitie sel’skogo khozyaistva Rossii – sostavnaya chast’ resheniya prodovol’stvennoi problemy v mire [Development of Russia’s Agriculture as a Factor Promoting the Solution of the World Food Problem]. Ekonomicheskie
Table 2. Production of agricultural products in all categories of households (at constant 2014 prices, million rubles)
|
Region |
2000 |
2005 |
2010 |
2011 |
2012 |
2013 |
2014 |
2014 to 2000, % |
|
Komi Republic |
11052 |
9238 |
9456 |
10298 |
10442 |
9899 |
9701 |
87.8 |
|
Republic of Karelia |
6759 |
5811 |
5706 |
5694 |
5375 |
5601 |
5472 |
81.0 |
|
Vologda Oblast |
35446 |
29956 |
25538 |
28245 |
26833 |
25035 |
25736 |
72.6 |
|
Arkhangelsk Oblast |
20197 |
13857 |
12099 |
13054 |
13172 |
11986 |
12310 |
60.9 |
|
Murmansk Oblast |
4515 |
3252 |
3923 |
3993 |
3989 |
3251 |
2682 |
59.4 |
|
Total |
77969 |
62113 |
56720 |
61284 |
59811 |
55772 |
55901 |
71.7 |
|
National average , billion rubles |
2767.0 |
3102.0 |
3289.1 |
4045.6 |
3851.4 |
4074.8 |
4225.6 |
152.7 |
Table 3. Self-sufficiency of the Russian European North regions in staple food in 2014 (based on the rational norms of consumption)
|
Products |
Consumption rates*, kg (units) / person |
Demand**, thousand tons (million units) |
Production in 2014., thousand tons (million units) |
Self-sufficiency, % |
|
Potatoes |
100 |
463.7 |
578.2 |
124.7 |
|
Meat and meat products |
75 |
347.7 |
142.9 |
41.1 |
|
Milk |
340 |
1576.5 |
706.5 |
44.8 |
|
Eggs |
260 |
1205.5 |
777.7 |
64.5 |
|
* Approved by the Ministry of Health and Social Development of the Russian Federation of August 2, 2010 No. 593 n. ** Defined as the product of per capita food consumption and population. |
||||
As a result, the regions of the European North provide the minimum requirements for meat by 41%, milk –45%, eggs –65% at the expense of own resources ( tab. 3 ). Only the region’s self-sufficiency in potato amounts to 125%7. Consequently, the regions should boost production of staple food.
Taking into account the strategic objectives for development of the Arctic and the adequate response to geopolitical risks, we can stress that the European North regions should become a powerful “rear base” of food security of the population in the Arctic territories. This is particularly true of the Vologda Oblast, where by the end of 2014 46% of the total volume of agricultural products had been produced in all categories of households. Thus, the region’s share in sown area of crops amounts to 69%, cattle – 59%, swine – 53%, milk production – 63%, livestock and poultry – 36% and gross grain harvest – 97% (figure). Thus, the study of the modern state, factors and reserves of agricultural production growth in the Oblast is of great scientific interest.
Share of the Vologda Oblast in the production base and agricultural production of the European North regions, %
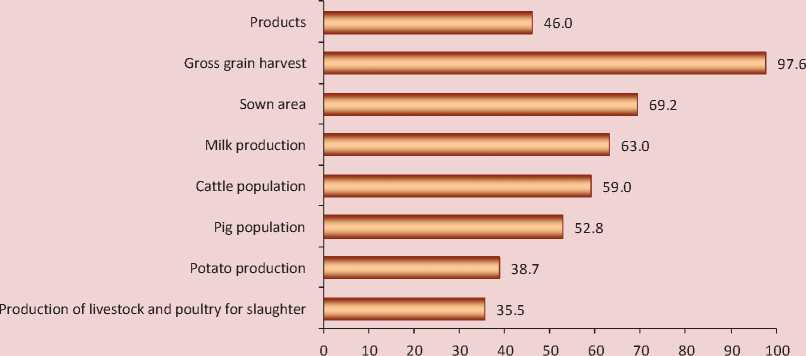
Table 4. Milk production in the Vologda Oblast by category of households
|
Category of households |
1990 |
2000 |
2005 |
2014 |
2014 to 2000 |
|||||
|
Thousand tons |
In % to total |
Thousand tons |
In % to total |
Thousand tons |
In % to total |
Thousand tons |
In % to total |
% |
p.p. |
|
|
Households of all categories |
755.3 |
100.0 |
494.9 |
100.0 |
470.1 |
100.0 |
444.8 |
100.0 |
89.9 |
х |
|
Peasant (farming) households |
0.0 |
0.0 |
3.9 |
0.8 |
6.5 |
1.4 |
13.4 |
3.0 |
In 3.4 times |
+2.2 |
|
Agriculture organizations |
583.8 |
77.3 |
338.8 |
68.5 |
382.1 |
81.3 |
408.3 |
91.8 |
120.5 |
+23.3 |
|
Households of the population |
171.5 |
22.7 |
152.2 |
30.8 |
81.5 |
17.3 |
23.2 |
5.2 |
15.2 |
-25.5 |
Sources: data of the Federal State Statistics Service of the Russian Federation; calculations of the author.
The Vologda Oblast due to climatic and historical conditions specializes in dairybeef cattle. Are there opportunities for boosting the industry? The statistics show that in 2000–2014 the volume of milk production in the region decreased from 495 to 445 thousand tons, or by 10%
( tab. 4 ). At the same time, this indicator increased by 3.4 times in peasant (farming) households, 20.5% – in agricultural ones and decreased by 6.6 times in private households. Corresponding to the trends the proportion of collective farms in milk production increased from 69 to 95%.
Table 5. Milk production in the Vologda Oblast districts in all categories of households
|
District |
2000 |
2005 |
2013 |
2013 to 2000 |
||||
|
Thousand tones |
In % to total |
Thousand tones |
In % to total |
Thousand tones |
In % to total |
% |
p.p. |
|
|
In the region |
494.9 |
100 |
470.1 |
100 |
430.2 |
100.0 |
86.9 |
х |
|
Vologodsky |
104.1 |
21 |
108.7 |
23.1 |
112.5 |
26.2 |
108.1 |
5.2 |
|
Gryazovetsky |
59.3 |
12 |
61.7 |
13.1 |
80.4 |
18.7 |
135.5 |
6.7 |
|
Cherepovetsky |
38.4 |
7.8 |
36.2 |
7.7 |
33.2 |
7.7 |
86.5 |
-0.1 |
|
Totemsky |
25.2 |
5.1 |
26.2 |
5.6 |
23.4 |
5.4 |
93.0 |
0.3 |
|
Sheksninsky |
25.4 |
5.1 |
22.2 |
4.7 |
21.7 |
5.1 |
85.6 |
0.0 |
|
Velikoustyugsky |
18.6 |
3.8 |
17.0 |
3.6 |
17.8 |
4.1 |
95.8 |
0.3 |
|
Ustyuzhensky |
16.2 |
3.3 |
17.0 |
3.6 |
15.9 |
3.7 |
98.1 |
0.4 |
|
Kirillovsky |
17.8 |
3.6 |
15.6 |
3.3 |
15.2 |
3.5 |
85.5 |
-0.1 |
|
Verkhovazhsky |
14.7 |
3 |
13.5 |
2.9 |
12.9 |
3.0 |
87.9 |
0.0 |
|
Sokolsky |
13.3 |
2.7 |
16.2 |
3.4 |
11.8 |
2.7 |
88.5 |
0.0 |
|
Nikolsky |
17.5 |
3.5 |
14.4 |
3.1 |
11.3 |
2.6 |
64.5 |
-0.9 |
|
Tarnogsky |
14.9 |
3.0 |
12.0 |
2.5 |
10.4 |
2.4 |
70.0 |
-0.6 |
|
Kichmengsko-Gorodetsky |
16.9 |
3.4 |
11.7 |
2.5 |
9.8 |
2.3 |
57.7 |
-1.1 |
|
Ust-Kubinsky |
10.9 |
2.2 |
13.5 |
2.9 |
7.3 |
1.7 |
66.7 |
-0.5 |
|
Mezhdurechensky |
6.6 |
1.3 |
8.8 |
1.9 |
6.7 |
1.5 |
101.0 |
0.2 |
|
Chagodoshchensky |
8.6 |
1.7 |
8.5 |
1.8 |
6.3 |
1.5 |
73.3 |
-0.2 |
|
Babaevsky |
13.3 |
2.7 |
9.7 |
2.1 |
6.0 |
1.4 |
44.8 |
-1.3 |
|
Kharovsky |
10.4 |
2.1 |
7.5 |
1.6 |
4.9 |
1.1 |
47.2 |
-1.0 |
|
Kaduysky |
6.0 |
1.2 |
5.5 |
1.2 |
4.5 |
1.0 |
74.9 |
-0.2 |
|
Belozersky |
7.3 |
1.5 |
6.6 |
1.4 |
3.8 |
0.9 |
52.2 |
-0.6 |
|
Vozhegodsky |
10.4 |
2.1 |
9.2 |
2.0 |
3.7 |
0.9 |
35.9 |
-1.2 |
|
Babushkinsky |
10.7 |
2.2 |
8.4 |
1.8 |
3.1 |
0.7 |
29.3 |
-1.5 |
|
Vashkinsky |
6.2 |
1.3 |
4.4 |
0.9 |
2.7 |
0.6 |
44.3 |
-0.7 |
|
Nyuksensky |
5.8 |
1.2 |
6.2 |
1.3 |
2.6 |
0.6 |
44.8 |
-0.6 |
|
Vytegorsky |
9.6 |
1.9 |
4.0 |
0.8 |
1.5 |
0.4 |
15.7 |
-1.5 |
|
Syamzhensky |
6.8 |
1.4 |
5.4 |
1.2 |
0.7 |
0.2 |
10.6 |
-1.2 |
Sources: data of the Territorial Board of the Federal State Statistics Service in the Vologda Oblast; calculations of the author.
In the region in 2013 half of the milk produced was registered in Vologodsky District, Gryazovetsky District and Cherepovetsky District. Their share in gross production increased by 11.8 p.p., compared to the 2000 level (tab. 5). It is economic entities in the agricultural sector of these municipalities that promote growth, introduce modern resource- efficient equipment and technologies8. At the same time, the contribution of the
Table 6. Structure of cow population by productivity level in the Vologda Oblast agricultural enterprises [1]
|
Milk yield per cow, kg |
2000 |
2009 |
2013 |
2013 to 2000 |
||||
|
Thousand animals |
In % to total |
Thousand animals |
In % to total |
Thousand animals |
In % to total |
Thousand animals |
p.p. |
|
|
Total |
106.38 |
100.0 |
80.10 |
100.0 |
71.159 |
100.0 |
-35.2 |
х |
|
Up to 2000 |
23.30 |
21.9 |
0.80 |
1.0 |
0.69 |
0.96 |
-22.6 |
-20.9 |
|
2001–3000 |
32.66 |
30.7 |
6.33 |
7.9 |
4.41 |
6.19 |
-28.3 |
-24.5 |
|
3001–4000 |
22.55 |
21.2 |
13.86 |
17.3 |
11.32 |
15.91 |
-11.2 |
-5.3 |
|
4001–5000 |
13.62 |
12.8 |
17.38 |
21.7 |
9.18 |
12.90 |
-4.4 |
0.1 |
|
5001–7000 |
10.74 |
10.1 |
27.39 |
34.2 |
25.61 |
35.99 |
14.9 |
25.9 |
|
Above 7001 |
3.51 |
3.3 |
14.34 |
17.9 |
19.96 |
28.05 |
16.5 |
24.8 |
Sources: Analytical materials of the Department of Agriculture and Food Resources of the Vologda Oblast; calculations of the author.
regions located far from major markets and centers of material and technical resources supply declined. During the study period total milk production decreased by more than 2 times in 8 districts and it is unlikely to be restored even due to favorable economic conditions.
The growth in milk production can be ensured due to the use of both extensive (increased livestock) and intensive (improved productivity) factors. During the analyzed period the cow population in the region decreased from 150 to 76 thousand animals, or by 2 times (including agricultural companies – by 31%), due to the bankruptcy of unprofitable enterprises and the decline in the production base in subsidiary individual holdings. The negative trend was overcome only in 2014 when the subsidies for livestock growth as measures to support the industry were allocated from the regional budget for the first time. As a result, the cow population in the collective sector increased by 2300 animals.
The structure of dairy cattle has experienced significant positive changes for the last 13 years. Livestock of low-yield cattle (with milk yield less than 4,000 kg) decreased by 62 thousand animals (by 4.8 times). In the result, the proportion of cows that yield more than 5,000 kg of milk annually increased from 13.4 to 64% (tab. 6).
Special attention is paid to the enhancement of breeding and productive qualities of animals in some farms of the region. There is an indicative example of the integrated agricultural production center: collective farm “Rodina” in the Vologda Oblast. In 2006 the farm got the author’s certificate for selection achievements “Vologda type of black-motley cattle”. Cows of class “Elite” and “Elite-record” constitute 99% of the total flock.
In general, in the Vologda Oblast (according to the State Breeding Register), as of April, 14 2015, 39 households (of 189), including 15 breeding plants and 24 breeding reproducers, has the status of breeding organizations. They keep 57% (39.9 thousand) of cows of all breeding stock and produce 65% (271 thousand tons) of milk. Most organizations are located in
Table 7. Distribution of organizations for breeding cattle in the Vologda Oblast by districts and breeding stock
Breeding plants District Breeding stock, animals In % to total Number of households, units In % to total Vologodsky 10,113 57.6 9 60.0 Gryazovetsky 6,100 34.8 4 26.6 Totemsksy 825 5.0 1 6.7 Ustyuzhensky 520 2.6 1 6.7 Total 17,558 100.0 15 100.0 Breeding reproductors Velikoustyugsky 3,366 15.0 4 16.7 Vologodsky 4,315 19.2 4 16.7 Gryazovetsky 5,670 25.5 4 16.7 Cherepovetsky 3,410 15.2 3 12.5 Totemsky 1,280 5.8 2 8.3 Ustyuzhensky 991 4.4 2 8.3 Kirillovsky 1,300 5.8 1 4.1 Mezhdurechensky 681 3.0 1 4.1 Kaduysky 630 2.8 1 4.1 Sokolsky 465 2.0 1 4.1 Nikolsky 312 1.4 1 4.1 Total 22,420 100 24 100 Source: Gosudarstvennyy plemennoy registr [State Breeding Register.]. Available at:
Vologodsky District, Gryazovetsky District, Velikoustyugsky District and Cherepovets District ( tab. 7 ).
In the villages Dorozhnyy of Vologodsky District and Solmanskoe of Cherepovetsky District 2 breeding organizations for artificial insemination operate successfully. The State Breeding Register also includes service organizations of the region: 4 milk and 2 immunology laboratories, 1 regional information and selection center.
Due to the systematic selection and breeding work, the reduction of unproductive cattle and the improvement of forage reserve quality the milk yield per cow increased from 2,975 kg in 2000 to 5,930 kg in 2014, or by 2 times. However, there is potential for this indicator growth: for example, in breeding plants it amounts to 7,589 kg. Therefore, it is possible to increase milk production by reducing the level of macroeconomic, technological and foreign trade risks, conducting effective, consistent and predictable agricultural policy and having favorable conditions in the food market and skilled personnel in the industry.
Obviously, the intensification of dairy farming carried out on the new technical and technological base involves additional
Table 8. Productivity of cows depending on breed
|
Indicator |
Breed |
||
|
Black-and-white |
Dutch |
Holstein |
|
|
Length of productive use, lactations |
3.8 ± 0.27 |
2.3 ± 0.34 |
2.4 ± 0.31 |
|
Milk yield per lactation, kg |
3,824 |
6,548 |
6,850 |
|
Lifetime milk yield, kg |
14,543 |
15,039 |
16,428 |
|
Milk yield per 1 day of lactation, kg |
11.3 |
16.5 |
16.5 |
Source: Karamaev S.V. Produktivnost’ dolgoletiya korov v zavisimosti ot porodnoy prinadlezhnosti [Productive Longevity of Cows Depending on Breed]. Zootekhniya [Husbandry], 2009, no.5, pp. 16-17.
Table 9. Impact of cow productivity on economic indicators of the agricultural enterprises’ activity in the Vologda Oblast
|
Milk yield per cow, kg |
Number of households in the group |
Milk yield per cow, kg |
Production cost of 1 ton of milk, rubles |
Profitability of realized milk (without subsidies), % |
Per 100 ha of arable land |
|
|
Number of cows, animals |
Revenue from milk sale, thousand rubles |
|||||
|
Up to 3,723 |
2 |
3,722.9 |
15,190.0 |
-20.9 |
15.8 |
622.5 |
|
3,724–5,307 |
5 |
4,949.2 |
9,778.8 |
7.5 |
18.2 |
772.5 |
|
5,308–6,442 |
9 |
6,031.1 |
10,225.0 |
22.2 |
26.8 |
1,919.3 |
|
6,443–7,468 |
5 |
7,082.6 |
9,950.6 |
31.2 |
28.0 |
2,480.8 |
|
7,469 and above |
2 |
7,677.8 |
10,607.5 |
3.3 |
53.9 |
4,460.5 |
|
Total, in average |
23 |
6,303.9 |
10,289.2 |
19.1 |
26.4 |
1,918.1 |
Sources: Data of the Department of Socio-Economic Development of the Village of the Vologda Municipal District; calculations of the author.
costs, increased capital intensity of production, reduced duration of the productive use of animals. Thus, according to V.S. Karamaev, high-yielding breeds of cows (Holstein and Dutch) have the shortest use period – 2.4–2.3 lactations ( tab. 8 ).
The grouping of the Vologda Oblast agricultural enterprises suggests that the growth in milk yield per cow from 3,723 to 7,083 kg leads to the rise in cost effectiveness of realized milk, but then to the dramatic decline due to the increased production costs (tab. 9). Thus, we can conclude that it is necessary to take systematic measures of state stimulation and breeding work organization to increase dairy cattle productivity in the region.
It is crucial for the enterprises to have the opportunity to use modern equipment for maintenance and milking cows, providing a high level of productivity and competitiveness. Nowadays their scale is negligible. So, only 18% of the cow population in the region is characterized by loose housing and milking in milking parlors or by robot. Despite annual reconstruction and modernization of cattle-breeding premises, many of them are poorly mechanized (for example, the integrated agricultural production center “Iskra” in Vozhegodsky District has no milk delivery line).
According to the Department of Agriculture and Food Resources of the Vologda Oblast, about half of the cattlebreeding premises in the regional agricultural organizations have been operating for more than 20 years, and 38% – for more than 35 years. Due to severe environment and long operation the quarter of livestock facilities is in a terrible condition. However, according to RAS Academician N.M. Morozov, only through the establishment and maintenance of optimal temperature, humidity, speed of air masses movement in livestock premises it is possible to increase the productivity of cows (by 13–15%), accelerate the growth and development of young stock, lower the feed intake (by 10–15%), the loss of livestock, as well as the costs for animals treatment (7–10%) [3].
It is important for the households to pay special attention to the creation of conditions for strengthening the technical base of forage production. In 2013 the regional agricultural enterprises had 190 units of modern feeders and mobile mixers, which provided 79% of the dairy cattle livestock with homogenized feed mixtures. At the same time, high-quality grinding, blending, enrichment of protein-mineral supplements and heating up of the forage help increase the productivity of livestock by 12–15%, reduce the prime cost of milk by 4–6% and the consumption of food resources by 10–12% and completely eliminate their losses [4]. Hence, there is an objective need for significant technical re-equipment of enterprises, specializing in the maintenance of dairy cattle. Without the upgrade it would be very difficult to raise the level of milk sales profitability, which amounted to 15.3% in the region in 2013, and, consequently, transfer the industry to the expanded reproduction mode9.
Thus, the Vologda Oblast has reserves for higher production of milk and dairy products, including for meeting the needs of Arctic communities. However, this requires substantial transformation of agrarian policy of the state (primarily, the federal center). Without going into detail, we note that we share the view of some respected agricultural economists [7, 9], insisting on the necessity to change the economic mechanism of agriculture support and limit the growth of prices for material and technical resources, the development of cooperatives and leasing, the stability in agricultural prices during the year, the guarantees of state support funds for at least 3–5 years, the provision of tax incentives (subsidies) for investment. In our view, if the system of state management of agriculture is not changed significantly, it will be extremely difficult to address geopolitical risks and comply with the provisions of the Russian Federation Food Security Doctrine, the Strategy and the State Program for Development of the Arctic in the near future.
References Reserves of dairy cattle breeding growth in the Vologda oblast in the context of solving state strategic tasks to develop the arctic
- Analiz proizvodstvenno-finansovoi deyatel'nosti sel'skokhozyaistvennykh organizatsii Vologodskoi oblasti za 2013 god . Departament sel'skogo khozyaistva, prodovol'stvennykh resursov i torgovli Vologodskoi oblasti . Vologda, 2014. 153 p.
- Gubarev V. Osvoenie Arktiki: plany i real'nost' . Available at: http://www.pravda.ru/science/academy/16-02-2015/1248650-arctik-0.
- Morozov N.M. Novaya tekhnika i progressivnye tekhnologii -vazhneishie faktory povysheniya proizvoditel'nosti truda v zhivotnovodstve . Ekonomika sel'skokhozyaistvennykh i pererabatyvayushchikh predpriyatii , 2008, no. 9, pp. 5-8.
- Morozov N.M. Strategiya mekhanizatsii i avtomatizatsii proizvodstva -ekologicheskie i sotsial'nye voprosy . Ekologiya i sel'skokhozyaistvennaya tekhnika: materialy 6-i Mezhdunarodnoi nauchno-prakticheskoi konferentsii . Saint-Petersburg: GNU SZNIIMESKh Rossel'khozakademii, 2009, vol. 3, pp. 8-15.
- Ob utverzhdenii gosudarstvennoi programmy Rossiiskoi Federatsii “Sotsial'no-ekonomicheskoe razvitie Arkticheskoi zony Rossiiskoi Federatsii na period do 2020 goda”: postanovlenie Pravitel'stva RF ot 21.04.2014 № 366 . Konsul'tantPlyus: spravochno-pravovaya Sistema .
- Publichnyi doklad o rezul'tatakh deyatel'nosti Departamenta sel'skogo khozyaistva i prodovol'stvennykh resursov Vologodskoi oblasti za 2014 god . Available at: http://okuvshinnikov.ru/proekty/komanda_gubernatora_vasha_ocenka_2015.
- Uzun V.Ya. Printsipy formirovaniya i raskhodovaniya agrarnogo byudzheta v Rossii, SShA, Kanade i ES . Ekonomika sel'skokhozyaistvennykh i pererabatyvayushchikh predpriyatii , 2015, no. 2, pp. 32-41.
- Uchastie inostrannogo kapitala v pishchevoi promyshlennosti Rossii . Ministerstvo sel'skogo khozyaistva Rossiiskoi Federatsii . Available at: http://mcx-consult.ru
- Ushachev I.G. Strategicheskie podkhody k razvitiyu APK Rossii v kontekste mezhgosudarstvennoi integratsii . Ekonomika sel'skokhozyaistvennykh i pererabatyvayushchikh predpriyatii , 2015, no. 2, pp. 8-15.
- Epstein D.B. Neobkhodima dorabotka Gosprogrammy . Ekonomika sel'skogo khozyaistva Rossii , 2012, no. 2, pp. 16-21.
- The State of Food Insecurity in the World 2014. Strengthening the Enabling Environment for Food Security and Nutrition. Rome: FAO, IFAD and WFP, 2014, 55 p.
- Luk'yanovich N. Geopoliticheskie aspekty prodovol'stvennoi bezopasnosti . Ekonomist , 2015, no. 3, pp. 14-23
- Chekavinskii A.N. Razvitie sel'skogo khozyaistva Rossii -sostavnaya chast' resheniya prodovol'stvennoi problemy v mire . Ekonomicheskie i sotsial'nye peremeny: fakty, tendentsii, prognoz , 2012, no. 6 (24), pp. 197-204
- Gosudarstvennyy plemennoy registr . Available at: http://www.mcx.ru/documents/section/show/3831.85.htm
- Karamaev S.V. Produktivnost' dolgoletiya korov v zavisimosti ot porodnoy prinadlezhnosti . Zootekhniya , 2009, no.5, pp. 16-17
