Resources for growth: Young people outside employment and education

Author: Fedchenko A.A., Dashkova E.S., Dorokhova N.V., Azarnova T.V.
Journal: Economic and Social Changes: Facts, Trends, Forecast @volnc-esc-en
Section: Social and economic development
Article in issue: 1 т.19, 2026.
Free access
The Russian economy is experiencing an acute shortage of labor resources, which brings to the forefront the issue of seeking alternative sources for their replenishment. At the same time, both in Russia and abroad, a group of young people aged 15–24 who are not in education, employment, or training (NEET youth) has emerged. The need to study this group stems not only from exacerbated demographic problems but also from the risk of its further expansion, which may in the future negatively impact many socio-economic processes. The aim of the work is to assess the scale of NEET youth prevalence in Russian society, identify its characteristics, and substantiate recommendations of a tactical and strategic nature aimed at addressing the problem under study. Through an analysis of works by a number of foreign and Russian scholars, analytical materials from the International Labour Organization, as well as international and Russian statistics, it is substantiated that the NEET youth problem is highly relevant; the scale and features of NEET youth prevalence in Russia, including regional and gender dimensions, are identified. An empirical study of the characteristics and problems of NEET youth in the Russian Federation was conducted involving experts and determining mathematical relationships. This made it possible to clarify the structure of the NEET youth group in Russia, the main reasons for its formation, and to prove the degree of influence of the identified causes on the problem under study, as well as to assess the consequences of NEET youth prevalence for the domestic economy and forecast the size of this group in the medium term. Based on the study results, a list of tactical and strategic measures is substantiated, aimed at solving this problem and integrating NEET youth into the process of social reproduction. The scientific contribution of the study lies in the development of a methodological approach to assessing the extent of the spread of NEET youth in the Russian economy, based on a comprehensive analysis using statistical analysis and expert survey methods
Labor market, labor potential, NEET youth, Russian economy
Short address: https://sciup.org/147253454
IDR: 147253454 | UDC: 316.34 | DOI: 10.15838/esc.2026.1.103.16
Text of the scientific article Resources for growth: Young people outside employment and education
The global socio-economic system is currently in a state of profound transformation due to the fourth industrial revolution, which is a consequence of the high pace of scientific and technological progress, the introduction of its results into all spheres of society, primarily Internet technologies and artificial intelligence. Schwab noted: “We are at the origins of a revolution that will fundamentally change our lives, our work and our communication… The nature of the changes taking place is so fundamental that world history has not yet known such an epoch – a time of both great opportunities and potential dangers” (Sсhwab, 2016). The concerns expressed by K. Schwab are not unfounded. For instance, along with the obvious advantages, the most pronounced destructive consequences of the ongoing transformations are the degradation of democracy and the weakening of statehood, a fundamental change in the model of the world order, the regression of spiritual values of society, the growing socio-economic crisis, projected on the production and institutional aspects of the economic system, including significantly transforming social and labor relations.
The social and labor sphere, which covers the entire set of social and labor relations, according to experts of the International Labor Organization (ILO), is also influenced by these negative processes. The report on global employment and social prospects for 2024, presented by ILO experts, notes the persistence of instability in the social and labor sphere worldwide, increasing inequality, with special emphasis on the problems of youth in this area. Currently, the effects of the COVID-19 pandemic remain completely insurmountable for the labor market and the employment sector.
Among the most acute problems of the social and labor sphere on global scale, experts note the following1:
– low labor productivity, which persists despite the high rates of technological renewal of production, which acts as a significant barrier to further economic growth;
– aggravation of income inequality, including labor inequality, as well as aggravation of the problem of the working poor;
– low rates of job creation with decent working conditions;
– persistence of the problem of informal employment in most countries of the world, as well as an increasing proportion of young people involved in informal labor relations;
– gender inequality in employment prospects, career growth, and labor income;
– updating the problem of NEET youth;
– increasing shortage of labor in developed and transition economies, which is a consequence, on the one hand, of the demographic crisis, on the other hand, of the lack of necessary competencies among labor immigrants arriving from developing countries.
Currently, the problem of labor shortage is one of the most discussed in the international arena: its aggravation and prospects for solving it are the subject of active scientific discourse; programs are being developed to solve this problem at the level of individual states and their associations. It is obvious that young people with high labor potential are a key source of replenishment of the labor force. However, the proliferation of such a group as NEET youth (people aged 15–24 who do not work or study), as evidenced by statistical data and research by ILO experts, as well as the work of foreign and Russian scientists, determines the need for a comprehensive study of it.
The relevance of this problem and its crosscountry specifics are reflected in the following ILO materials: “Global employment and social prospects: trends in 2024”2, “Profile of young NEET students in Portugal” (O’Higgins, Brockie, 2024), “Trends, characteristics and impact of COVID-19 on youth who do not work, do not study and do not acquire professional skills (NEET) in Thailand”3, “Promotion of employment and training of NEET youth in the Southern Mediterranean”4 , “The number of young people without jobs, education or vocational training (NEET) is worrying, despite the decrease in the unemployment rate”5.
The large-scale scientific project “Youth Vulnerability in European Cities” (Paabort et al., 2023), implemented by an international group of scientists M. Beilmann, E. Gerohazi, M. Medgyesi, T. Tammaru and others with the grant support of the European Union’s Horizon 2020 Research and Innovation Program, is devoted to the study of the NEET youth problem. Large-scale studies were also conducted by M. Gunnes, K. Thaulow, S.L. Kaspersky, K. Jensen, S.O. Ase, which allowed identifying a wide range of factors that lead to the formation of the NEET youth problem. The researchers structured these factors into the following groups: individual, family, and socioeconomic. Scientists have proven that in the long term, the formation of NEET youth is influenced by a low level of education, a high risk of mental disorders and high unemployment (Gunnes et al., 2025). In turn, I. Swart, H. Hillamo, B.H. Holte’s research on the practical applicability of the NEET youth concept in different countries (Northern Europe and South Africa) has proved its scientific validity and practical significance (Swart et al., 2021). The work of C. Mayombe is of great interest, where the author proposed an innovative model of interaction between social partners to employ graduates from the category of potential NEET youth (Mayombe, 2022).
In Russia, NEET youth has become the subject of scientific research relatively recently. One of the first large-scale studies on this issue is the work of E.Ya. Varshavskaya “NEET Youth in Russia: Characteristics and Typology”, which for the first time assessed the extent of the spread and structure of NEET youth in Russia, as well as identified the factors determining its formation (Varshavskaya, 2016). Currently, the number of studies on this issue has increased. For example, M.B. Bulanova justified the need to expand the range of NEET youth sub-groups by identifying “those who voluntarily chose this life option”, and also studied in detail the social characteristics and impact of transformational processes on NEET (Bulanova, 2019; Bulanova, 2020; Bulanova, Artamonova, 2020). In turn, S.V. Mitrukhina investigated the features of this sub-group of NEET youth in modern conditions and identified the reasons for its formation corresponding to current realities (Petrenko, Mitrukhina, 2024). A great contribution to the development of this issue was made by the research of A.A. Zudina, who not only deeply studied the social and psychological aspects of NEET youth, but also revealed the impact on them of the restrictions associated with the coronavirus pandemic (Zudina, 2019; Zudina, 2024). N.N. Shestakova and her co-authors identified the reasons for the formation of this group of young people due to national specifics. As a result of the study, scientists proved that the main reason for joining NEET youth is a violation of family and social ties (Shestakova et al., 2019). E.A. Yakovleva, as part of an empirical study, estimated the share of young people in the Southern Federal District who have the highest risk of falling into the NEET group. Based on a sociological study, this proportion was 20% of the respondents (Yakovleva, Galakhova, 2017). The analytical materials published by A.R. Turenko characterize the national peculiarities of the spread of NEET youth in the CIS countries (Turenko, 2023).
Thus, in the presented works of Russian scientists, NEET youth is not considered as a potential labor resource for the development of the modern Russian economy, as an opportunity to reduce the shortage of young personnel in the labor market, and strategic and tactical measures aimed at including NEET youth in the process of social reproduction are not being worked out. These circumstances determine the relevance and novelty of this study. The aim of the work is to assess the extent of the spread of NEET youth in Russian society, identify its features and substantiate tactical and strategic recommendations aimed at solving the problem under study. The aim is specified by a number of research tasks: to analyze the extent of the spread of the NEET youth problem in the global and Russian economies; to identify the features of NEET youth in Russia, to determine factors and assess their impact on the problem of NEET youth; to substantiate a set of strategic and tactical measures aimed at involving NEET youth in the workforce. The hypothesis of the study is that the problem of NEET youth will remain relevant for the Russian economy in the medium term and will contribute to an increase in the labor shortage.
Methodology and research methods
The methodological basis of this research is scientific work in the field of labor economics and the sociology of youth. The problems of forming the value structure of young people, the transformation of the model of labor behavior of this demographic group, issues of youth unemployment and employment were among the scientific interests of many Russian scientists6 (Bobkov, Bobkov, 2016; Varshavskaya, 2016; Gnevasheva, 2010; Gnevasheva, 2025; Employment..., 1998; Zubok et al., 2021; Leonidova, Golovchin, 2018; Popov, 2023; Toshchenko, 2021; Roshchin, 2003; Shabunova et al., 2013).
Our study was performed using a set of methods, including general scientific (deduction, induction, analysis, synthesis, etc.), as well as private (statistical analysis, including correlation analysis, factor analysis, regression analysis; tree classification methods; expert survey).
The empirical data was obtained on the basis of an expert survey conducted using Google Forms (link: . The experts were representatives of the scientific community engaged in research in the field of economics and sociology of labor, as well as representatives of relevant government agencies responsible for the implementation of youth policy. In total, 30 experts from eleven constituent entities of the Russian Federation were interviewed: the Republic of Bashkortostan, the Republic of Crimea, the Voronezh, Lipetsk, Novosibirsk, Rostov, Samara, Saratov, Sverdlovsk, Orenburg regions, and Moscow.
The use of correlation analysis made it possible to determine the degree of paired linear dependence between the indicators characterizing the analyzed causes and the resulting variable – NEET youth in the total population of the corresponding age group (%). Factor analysis was aimed at reducing the dimension of the indicator space by constructing generalized factors based on them, which are linear combinations of initial indicators and preserving basic statistical information about the initial indicators. Tree classification methods are used to form classifying regression trees for the resulting variable. The regression analysis method allowed constructing a regression equation in which the role of the dependent variable is played by the resulting variable, and the role of explanatory variables is played by generalized factors.
Research results and their discussion
The statistical information published in the ILO report “Global Employment and Social Prospects: Trends in 2024”7 served as the information base for the analysis. The materials in the report, presented in 189 countries, reflect the situation both in the world as a whole and in the following groups of countries: Africa (North Africa and sub-Saharan Africa), Arab countries (Arab countries without GCC8, Arab countries of GCC), America (Latin America and the Caribbean, North America), Asia and the Pacific (East Asia, Southeast Asia, Pacific Region, South Asia), Europe and Central Asia (North, South and Western Europe, Eastern Europe, Central and Western Asia). The Russian Federation is included in the group of Eastern European countries. The ILO report covers the period from 2000 to 2022.
Table 1 presents the situation of young people (aged 15 to 24 years) in the global labor market.
The analysis of the indicators and statistical data in table 1 allows drawing the following conclusions.
Table 1. Dynamics of the main indicators of the global labor market, %
|
Indicator |
Year |
|||||
|
2000 |
2010 |
2019 |
2020 |
2021 |
2022 |
|
|
Labor force participation rate, % of total |
64.2 |
62.0 |
60.5 |
59.2 |
59.8 |
60.3 |
|
Labor force participation rate, % youth |
51.3 |
45.6 |
40.9 |
39.3 |
39.8 |
40.0 |
|
Employment rate, % of total |
60.2 |
58.1 |
57.1 |
55.3 |
56.2 |
57.1 |
|
Employment rate, % youth |
45.1 |
39.6 |
35.2 |
33.2 |
34.1 |
34.7 |
|
Unemployment rate, % of total |
6.1 |
6.4 |
5.6 |
6.6 |
6.1 |
5.3 |
|
Unemployment rate, % youth |
12.1 |
13.3 |
13.8 |
15.7 |
14.5 |
13.3 |
|
Share of NEET youth, % |
- |
22.3 |
22.4 |
23.8 |
22.4 |
21.7 |
Source: World Employment and Social Outlook: Trends 2024. Available at: report/995343385502676 (accessed: 30.08.2024).
The global labor force participation rate decreased by 4.4 p.p. from 2000 to 2021. However, the labor force increased by 774.2 million people during this period. This discrepancy in the dynamics of the indicators is due to a number of reasons, including the different rate of change in the population and the workforce, the aging of the world’s population, and others. In the age group of 15–24 years, the labor force participation rate decreased significantly – by 11.5 p.p. In absolute terms, there was also a decrease of 71.5 million people. In 2022, the level of population participation in the labor force increased in both analyzed groups, but this indicator did not reach the expected values.
The indicator “employment rate” for the period 2000–2020 decreased by 4.9 p.p. for the world population as a whole, and by 11.9 p.p. for the group “youth aged 15–24”. In 2021, this indicator reached a growth trajectory and in 2022 reached values of 57.1 and 34.7%, respectively. In the youth group, the indicator did not reach the level of the preacademic period.
The indicator “unemployment rate” in 2000– 2022 has constantly fluctuated in the range from 5.3% in 2022 to 6.6% in 2020 in the labor market as a whole, and in the youth segment – from 12.1% in 2000 to 15.7% in 2020. In general, the data presented confirm the thesis about the difficult situation of young people in the labor market and their vulnerability. In 2022, the “unemployment rate” indicator decreased compared to the nonstandard values for both study groups.
The indicator “share of NEET youth” in the ILO report has been presented only since 2010. Its values for the entire observed period were high and exceeded 20%. The indicator reached its maximum value in 2020 (23.8%), due to restrictions related to COVID-19.
Experts also provide forward-looking estimates of the main indicators of the global labor market for 2023–2025, which do not imply drastic and significant changes in the designated period.
Let us consider the dynamics of the indicator “share of NEET youth” in the groups of countries presented above ( Fig. 1 ).
Based on the data presented in Figure 1, we can state that the highest level of the analyzed indicator for the entire study period is observed in the states of the group “Arab countries without GCC”, which includes Egypt, Iran, Iraq, Jordan, Palestine, Yemen. This indicator reached its maximum value in 2020, when it was 39.7%; the minimum value was 38.2% in 2010.
Figure 1. Dynamics of the indicator “share of NEET youth” by country groups for 2010–2022, %
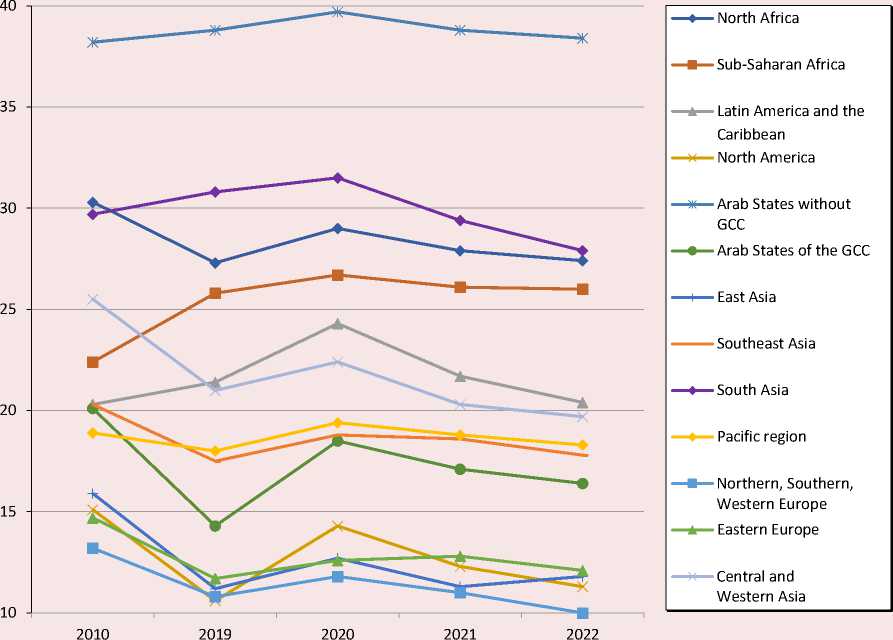
Source: World Employment and Social Outlook: Trends 2024. Available at: report/995343385502676 (accessed: 30.08.2024).
By comparing the values of the indicator for groups of countries with the global average values for the period under study, we can combine these groups into three categories:
-
1) groups of countries with a value below the global average (15% or less): North, South, Western Europe, Eastern Europe, North America, East Asia;
-
2) groups of countries with close to the global average (in the range of 15–25%): Latin America and the Caribbean, the Arab States of the GCC, Southeast Asia, the Pacific region, Central and Western Asia;
-
3) groups of countries with a value higher than the global average (25% and above): North Africa, Sub-Saharan Africa, South Asia, Arab countries without GCC.
The existence of such differentiation between the countries of the world, in our opinion, is a consequence of the influence of a wide range of factors, including the features of historical and cultural development, as well as socioeconomic situation, demographic situation and political structure. Consequently, in the context of each individual country, the problem of NEET youth has its own specifics of formation and development, which determines the need for its deeper study at the level of a particular state.
In the Russian Federation, the statistical measurement of the indicator “share of young people who do not study, work or acquire professional skills at the age of 15–24 in the total
Figure 2. Dynamics of the share of youth aged 15–24 who do not study, work or acquire professional skills in the total population of the corresponding age group for 2001–2022, %
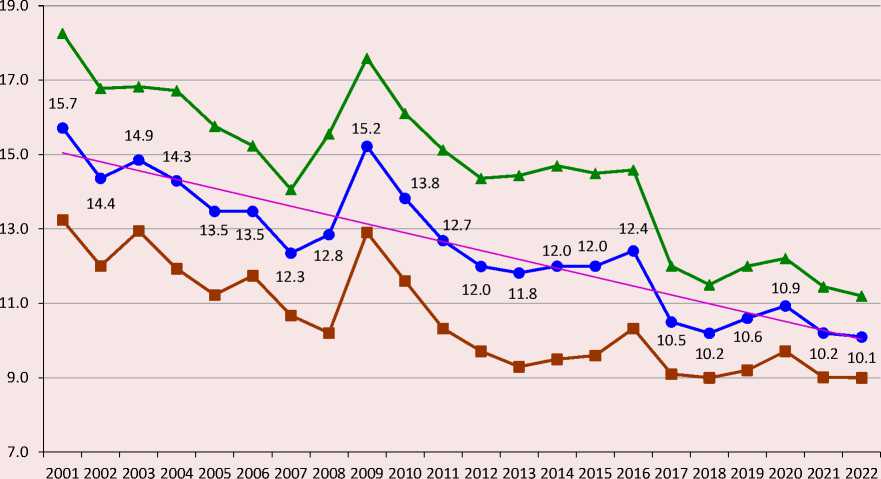
—•—Total — ■ — Men —A— Women Linear (Total)
Source: Indicators of decent work. Available at: (accessed: 10.09.2024).
population of the corresponding age group” (i.e., the share of NEET youth) has been conducted since the early 2000s ( Fig. 2 ).
The share of NEET youth in the study period shows a downward trend. It reached its peak values in 2001 and 2009 (15.7% and 15.2%, respectively). In absolute terms, the reduction in the number of NEET youth in 2022 compared to 2001 amounted to 365,955 people, in relative terms – 20%. A comparison with the global averages of this indicator has led to the conclusion that the level of NEET youth in Russia is significantly lower than the global average and comparable to its values in economically developed countries.
Analyzing the structure of NEET youth in Russia by gender, we can state the differentiation in this indicator, which is observed throughout the entire study period. The involvement of men in the NEET group is significantly lower than that of women. Among men in the analyzed period, this indicator ranged from 9.0 to 13.2%, among women – from 11.2 to 18.3%.
Based on statistical data, the values of indicators for the NEET-unemployed9 and NEET-econo-mically inactive10 sub-groups were calculated ( Fig. 3 ), and their percentage ratio was determined ( Tab. 2 ).
We can draw the following conclusions based on the calculated indicators.
Figure 3. Changes in the structure of the NEET youth group by main sub-groups in 2001–2022, %
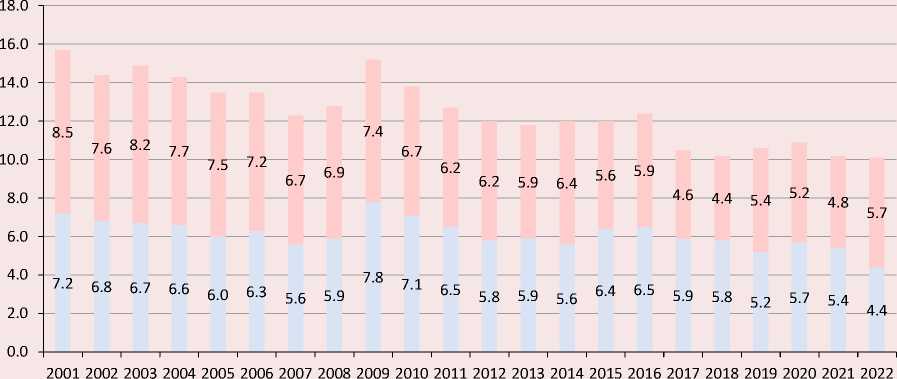
NEET-unemployed NEET-economically inactive
According to: Rosstat data.
Table 2. Ratio of the main sub-groups in the structure of the NEET youth group for 2001–2022, %
|
Sub-group |
2001 |
2002 |
2003 |
2004 |
2005 |
2006 |
2007 |
2008 |
2009 |
2010 |
2011 |
|
NEET youth, including: |
100 |
100 |
100 |
100 |
100 |
100 |
100 |
100 |
100 |
100 |
100 |
|
NEET unemployed |
45.9 |
47.2 |
45.0 |
46.2 |
44.4 |
46.7 |
45.5 |
46.1 |
51.3 |
51.4 |
51.2 |
|
NEET economically inactive |
54.1 |
52.8 |
55.0 |
53.8 |
55.6 |
53.3 |
54.5 |
53.9 |
48.7 |
48.6 |
48.8 |
|
2012 |
2013 |
2014 |
2015 |
2016 |
2017 |
2018 |
2019 |
2020 |
2021 |
2022 |
|
|
NEET youth, including: |
100 |
100 |
100 |
100 |
100 |
100 |
100 |
100 |
100 |
100 |
100 |
|
NEET unemployed |
48.3 |
50.0 |
46.7 |
53.3 |
52.4 |
56.2 |
56.9 |
49.1 |
52.3 |
52.9 |
43.6 |
|
NEET economically inactive |
51.7 |
50.0 |
53.3 |
46.7 |
47.6 |
43.8 |
43.1 |
50.9 |
47.7 |
47.1 |
56.4 |
|
According to: Rosstat data. |
|||||||||||
In the analyzed period, there were no pronounced trends in the ratio of sub-groups in the NEET youth structure. At the same time, from 2001 to 2008, “NEET economically inactive” sub-group prevailed in the overall structure, and since 2009 this trend has been absent. In our opinion, such a ratio of sub-groups in the NEET youth structure carries risks, since “NEET economically inactive” sub-group is extremely heterogeneous in its composition, and the motives for “inactivity”
are not always obvious, which requires additional research of this sub-group and the development of appropriate mechanisms for its reduction.
During periods of economic crises, “NEET unemployed” sub-group prevailed (2009 – 51.3%; 2015 – 53.3%; 2020 – 52.3%). NEET unemployment reached its maximum in 2018 (56.9%), and its minimum in 2022 (43.6%). Consequently, NEET unemployment increases naturally in Russia during crisis periods.
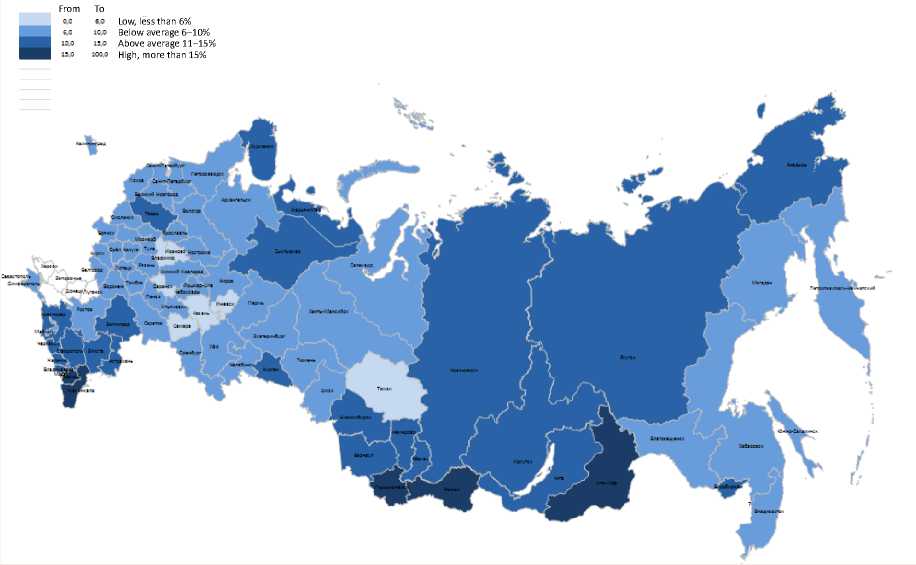
In the context of the constituent entities of the Russian Federation, the situation with the spread of NEET youth is significantly differentiated. For example, in a number of regions, as of 2022, the share of NEET youth is extremely high and reaches the following values: the Chechen Republic – 34.7%; the Republic of Dagestan – 28%; the Republic of Ingushetia – 23.9%. At the same time, this indicator in Saint Petersburg shows the lowest value among all regions of the Russian Federation – 3.2%. In this regard, all constituent entities of the Russian Federation are grouped according to the value of this indicator ( Fig. 4 ).
Analyzing the grouping results shown in Figure 4, we can state that only in eight regions of the Russian Federation there is a low share of NEET youth, not exceeding 6% as of 2022. The majority of regions (49) belong to the “below average” category, where the range of values of this indicator ranges from 6 to 10%, inclusive. The group of regions with an indicator value “above average” (11–15%) includes 24 constituent entities of the Russian Federation. In other words, almost a third of Russian regions are characterized as “disadvantaged” in terms of the extent of the spread of NEET among young people. The situation is extremely negative in six Russian regions, where the share of NEET youth is more than 15%. When analyzing the trend line for each of the RF constituent entities for the period from 2017 to 2022, only five regions revealed a steady positive trend in the decline in the share of NEET youth: the Bryansk Region, the Vladimir Region, the Kostroma Region, the Republic of Crimea, the Omsk Region. There is an increase in the indicator in the Tambov Region.
The analysis of the extent of the spread of NEET youth in the Russian Federation allows concluding that, the situation in the country is relatively
Figure 4. Grouping of the constituent entities of the Russian Federation according to the indicator “share of youth aged 15–24 who do not study, work or acquire professional skills in the total population of the corresponding age group” in 2022
To
10,0 13,0 100,0
Low, less than 6% Below average 6–10% Above average 11–15%
High, more than 15%
From
0,0
S..0
10,0
According to: Rosstat data.
favorable compared with global trends. However, the problem of labor shortage in Russia, which has significantly worsened at the moment and negative forecasts of its aggravation in the future due to the difficult demographic situation, actualize the search for labor reserves, as one of which, as noted above, NEET youth can be considered.
We conducted an expert survey, which resulted in the following results to study the characteristics and problems of NEET youth in the Russian Federation.
The majority of experts (60%) consider the problem of the existence of NEET youth to be relevant for the Russian economy, only 10% deny its importance. At the same time, all experts agree that this phenomenon is currently not widespread. Thus, 20% of respondents rate the prevalence of NEET among young people as extremely low (less than 6%), 40% as low (6–10%) and 40% as average (11–15%).
Regarding the forecast of the spread of this phenomenon in the Russian economy in the medium term, 1/3 of experts indicated that it would grow ( Fig. 5 ).
An important aspect for finding mechanisms to “remove” young people from the NEET category is to understand the internal structure of this group. The classification proposed by M.B. Bulanova (Bulanova, 2019) was used in the survey of experts (Fig. 6).
From the point of view of experts, the most common categories in the structure of NEET youth are the temporarily inactive, who have an agreement on work and study and are going to start it in the near future (76.7%), who voluntarily made a choice in favor of this life option (60%), and other inactive people who cannot indicate the reason for their inactivity. but they deliberately refuse to work and study (46.7%). In the NEET structure, the “desperate” category has not been singled out by experts. Thus, the survey results confirm the heterogeneity of the NEET youth group structure and are consistent with the statistical data presented in Figure 3. At the same time, “NEET economically inactive” sub-group is most likely represented to a greater extent by such categories as those who voluntarily made a choice in favor of this life option and others who are inactive, and to a lesser extent economically inactive due to illness, disability and family responsibilities.
According to experts, the spread of NEET among young people is accompanied by a wide range of negative socio-economic consequences ( Fig. 7 ).
Figure 5. Distribution of responses to the question “What is your forecast regarding changes in the prevalence of NEET youth in the Russian Federation in the medium term?”, %
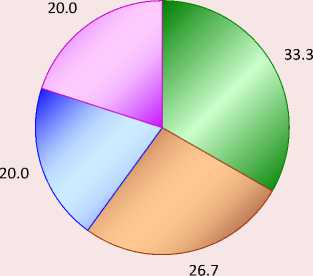
-
□ Growth
-
□ Decline
-
□ Without changes
-
□ Hesitate to respond
According to: expert survey results.
Figure 6. Distribution of answers to the question “Which three groups, in your opinion, prevail in the structure of NEET youth in the Russian Federation?”, %
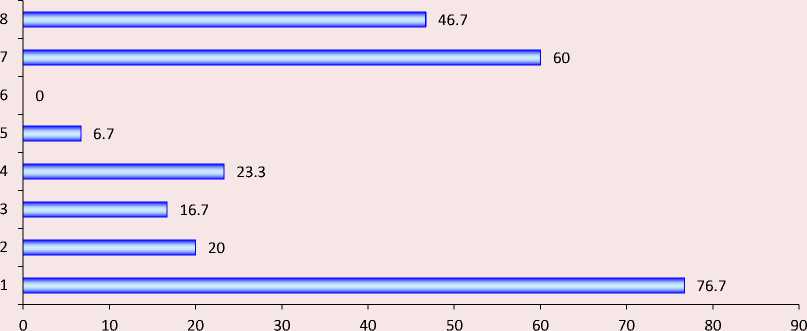
1 – temporarily inactive, having an agreement on work and study, intending to start it in the near future; 2 – short-term unemployed, i.e. officially registered as unemployed and staying in this status for less than a year; 3 – long–term unemployed, i.e. unemployed for more than a year; 4 – economically inactive due to illness and disability; 5 – economically inactive due to family responsibilities; 6 – desperate, i.e. stopped actively looking for a new job; 7 – voluntarily made a choice in favor of this life option.; 8 – other inactive people who cannot indicate the reason for their inactivity, but deliberately refuse to work and study.
According to: expert survey results.
Figure 7. Distribution of answers to the question “What consequences does the increase in the number of NEET youth have for the Russian economy?”, %
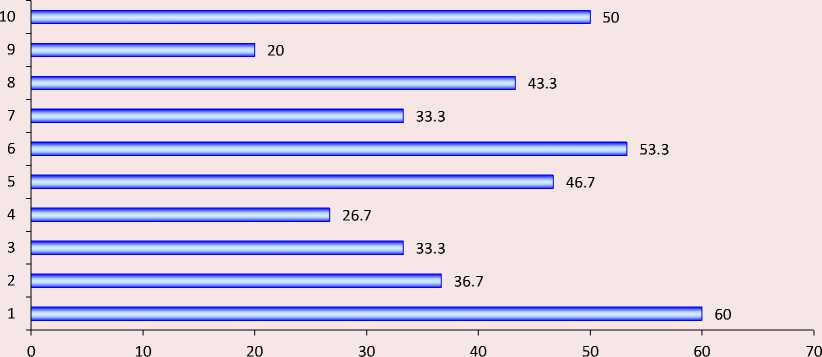
1 – increasing shortage of labor; 2 – increase in informal employment; 3 – decrease in the standard and quality of life; 4 – increase in income differentiation; 5 – increase in social tension; 6 – marginalization; 7 – increase in crime; 8 – increase in drug addiction and alcoholism; 9 – increase in state budget expenditures for the maintenance of NEET-youth; 10 – reduction of tax revenues to the budget.
According to: expert survey results.
The most frequently noted consequences of an increase in the number of NEET youth for the Russian economy were an increase in labor shortages (60%), marginalization (53.3%), a reduction in tax revenues to the budget (50%), and an increase in social tension (46.7%).
The results obtained confirm our earlier hypothesis about considering NEET youth as a labor reserve. Consequently, it is increasingly important to solve the problem of finding the causes of the formation of this group to develop measures to reduce its scale.
The expert survey revealed the main reasons for the formation of the NEET youth group in the Russian Federation ( Fig. 8 ).
According to the data obtained, the main reasons for the formation of the NEET youth group in Russia are the depreciation of the prestige of work (63.3%) and falling into the category of drug or alcohol addicts (53.3%).
Experts attributed social problems (30%), living in rural areas (26.7%), health problems (26.7%), early employment in the informal sector (26.7%), and unavailability of education (20%) to less pronounced reasons. The experts supplemented the proposed list of reasons such as high family income (3.3%); unwillingness to work in their profession (3.3%); civic inactivity (3.3%).
We used methods of correlation, factor analysis, regression analysis and tree classification to determine the degree of influence of the identified causes on the problem of NEET youth.
For the implementation of these methods, only those reasons for the formation of NEET youth in the RF have been selected, which can be measured by statistical indicators and which, according to experts, have received 10% or more. Thus, we selected the following reasons as evaluated:
-
– early age employment in the informal sector;
-
– unavailability of education;
-
– living in rural areas;
-
– health problems;
-
– falling into the category of drug or alcohol addicts;
-
– social problems (early motherhood, caring for sick family members, etc.);
-
– low family income.
Figure 8. Distribution of answers to the question “Specify the main reasons for the formation of NEET youth in the Russian Federation”, %
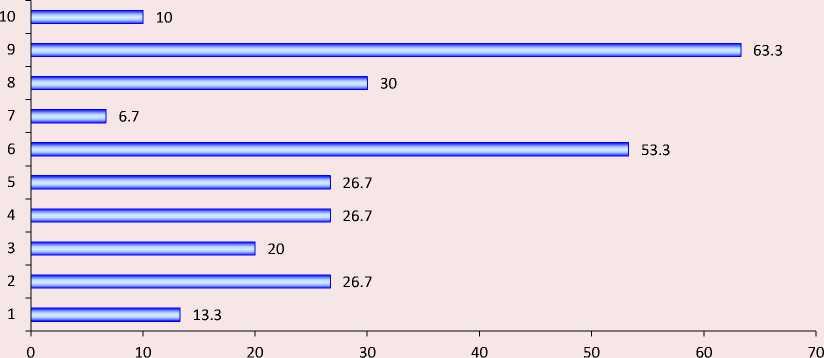
1 – low family income; 2 – early employment in the informal sector; 3 – unavailability of education; 4 – living in rural areas; 5 – health problems; 6 – falling into the category of drug or alcohol addicts; 7 – spread of crime among young people; 8 – social problems (early motherhood, care for sick family members, etc.); 9 – depreciation of the prestige of work among young people; 10 – other.
According to: expert survey results.
At the next stage, a system of indicators (explanatory variables) was formed that characterize the reasons outlined above:
-
Х1 – number of people employed in the informal sector in the age group of 15–19 years, thousand people;
Х2 – number of students enrolled in mid-level, bachelor’s, specialist’s, and master’s degree programs at the beginning of the academic year, thousand people;
X3 – number of rural population aged 15–24 years, people;
X4 – number of disabled people under the age of 18, thousand people;
X5 – number of drug addicts registered in medical and preventive organizations at the end of the reporting year, thousand people;
X6 – number of patients with alcoholism and alcoholic psychoses registered in medical and preventive organizations at the end of the reporting year, thousand people;
X7 – birth rate among adolescents (aged 15 to 19 years) per 1,000 women in the corresponding age group;
X8 – percentage of the population living below the national poverty line, %.
Table 3 shows the values of these indicators for the period from 2013 to 2022.
Table 4 presents the values of the resulting indicator Y (share of NEET youth in the total population of the corresponding age group, %) for 2013–2022.
Figure 9 shows the correlation matrix for the selected system of resultant and explanatory variables:
The analysis of the correlation matrix shows a fairly high correlation between the proportion of NEET youth (Y) and such indicators as: the number of people employed in the informal sector in the age group of 15–19 years (X1), the number of rural population aged 15–24 years (X3), the number of people with disabilities under the age of 18 (X4), the number of people with drug addiction, registered in medical and preventive organizations (X5), the number of patients with alcoholism and alcoholic psychosis registered in medical and preventive organizations (X6), the birth rate among adolescents (aged 15 to 19 years) per 1,000 women in the corresponding age group (X7).
To deepen the field of research based on the analysis of the correlation coefficient, we use the tree classification method, which allows us to build a predictive model based on the classification for the resulting variable, i.e. to identify classes of observations with its various average values.
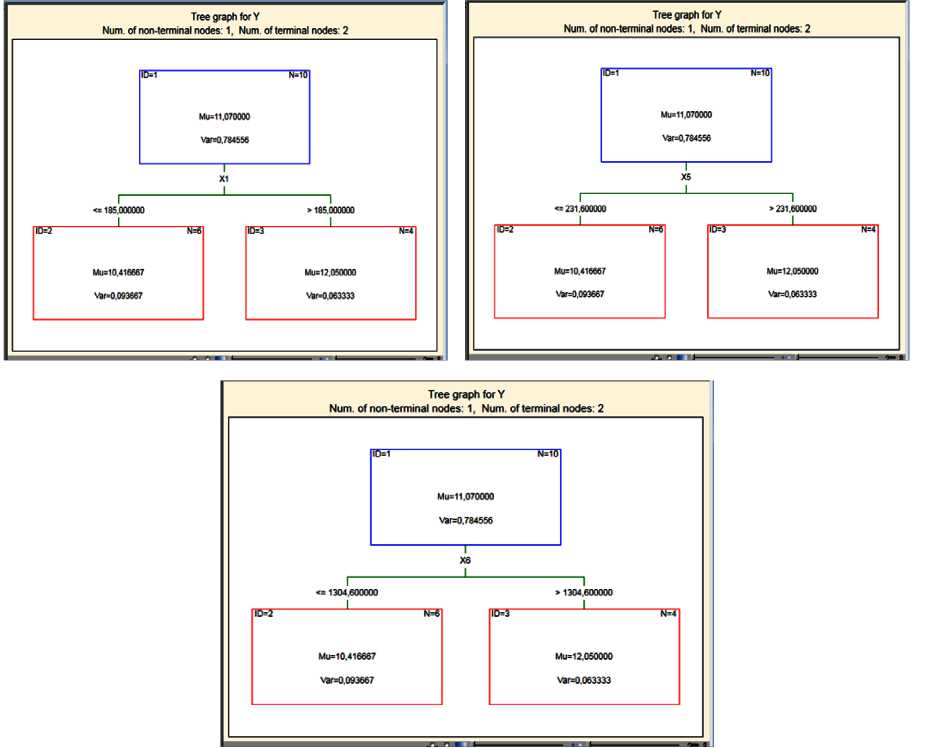
At the first stage of constructing a predictive model based on classifying regression trees using the CHAID method, all variables X1, X2, X3, X4, X5, X6, X7, X8 were considered as explanatory variables. The results shown in Figure 10 prove that good classification quality is achieved when using only one separating variable X1, this variable it
Table 3. Data for analysis
|
Variable |
2013 |
2014 |
2015 |
2016 |
2017 |
2018 |
2019 |
2020 |
2021 |
2022 |
|
Х1 |
248 |
202 |
204 |
219 |
185 |
180 |
168 |
155 |
149 |
142 |
|
Х2 |
7628.8 |
7312.1 |
6939.1 |
6704.3 |
6633.6 |
6626.0 |
6644.5 |
6809.1 |
6900.4 |
7113.1 |
|
Х3 |
4300619 |
4153494 |
3971969 |
3872864 |
3849171 |
3858149 |
3876083 |
3460295 |
3469200 |
3344226 |
|
Х4 |
568 |
580 |
605 |
617 |
636 |
651 |
671 |
689 |
704 |
729 |
|
Х5 |
308.3 |
300.7 |
288.0 |
259.5 |
231.6 |
217.4 |
207.0 |
207.5 |
212.0 |
213.8 |
|
Х6 |
1749.5 |
1690.0 |
1577.0 |
1444.5 |
1304.6 |
1208.6 |
1126.7 |
1102.8 |
1077.7 |
1051.4 |
|
Х7 |
26.6 |
26.0 |
24.0 |
21.5 |
18.4 |
16.1 |
14.6 |
14.1 |
13.5 |
13.4 |
|
Х8 |
10.8 |
11.3 |
13.4 |
13.2 |
12.9 |
12.6 |
12.3 |
12.1 |
11.0 |
9.8 |
|
According to: Rosstat data. |
||||||||||
Table 4. Resulting indicator
|
Indicator |
2013 |
2014 |
2015 |
2016 |
2017 |
2018 |
2019 |
2020 |
2021 |
2022 |
|
Y |
11.8 |
12.0 |
12.0 |
12.4 |
10.5 |
10.2 |
10.6 |
10.9 |
10.2 |
10.1 |
|
According to: Rosstat data. |
||||||||||
Figure 9. Correlation matrix for the selected indicator system
|
Variable |
Correlations (Федченко.sta) Marked correlations are significant at p < ,05000 N=10 (Casewise deletion of missing data) |
||||||||
|
Y |
XI |
X2 |
X3 |
X4 |
X5 |
X6 |
X7 |
X8 |
|
|
Y |
1 0000001 0.804353 |
0,380855 |
0.662176 |
-0.805198 |
0.835638 |
0.838340 |
0.854769 |
0.340006 |
|
|
X1 |
0.804353 |
1.000000 |
0.459932 |
0.897215 |
-0.939732 |
0.865992 |
0.915084 |
0.910432 |
0.280703 |
|
X2 |
0,380855 |
0.459932 |
1.000000 |
0.416009 |
-0.442560 |
0.700193 |
0,623320 |
0,601181 |
-0.649649 |
|
X3 |
0,662176 |
0.897215 |
0.416009 |
1.000000 |
-0.952931 |
0.818607 |
0.889618 |
0.878043 |
0.274012 |
|
X4 |
-0.805198 |
-0.939732 |
-0.442560 |
-0.952931 |
1.000000 |
-0.907752 |
-0.964197 |
-0.960715 |
-0.331949 |
|
X5 |
0.835638 |
0.865992 |
0.700193 |
0.818607 |
-0.907752 |
1.000000 |
0.986002 |
0.986275 |
0.046955 |
|
X6 |
0.838340 |
0.915084 |
0,623320 |
0.889618 |
-0.964197 |
0.986002 |
1.000000 |
0.998440 |
0.148757 |
|
XT |
0.854769 |
0.910432 |
0.601181 |
0.878043 |
-0.960715 |
0.986275 |
0.998440 |
1.000000 |
0.171936 |
|
X8 |
0.340006 |
0.280703 |
-0,649649 |
0,274012 |
-0,331949 |
0,046955 |
0,148757 |
0.171936 |
1.000000 |
Source: own compilation.
Figure 10. Results of the use of classifying regression trees in the construction of a predictive model
Source: own compilation.
has a high separation capacity. The observations are divided into two classes according to the value of the variable X1 – the number of people employed in the informal sector in the age group of 15–19 years, thousand. people, the left class contains observations for which this indicator is less than or equal to 185, the right class contains observations greater than 185. For observations of the left class, the average value of the resulting variable is 10.42%, the standard deviation is 0.093. For observations of the right class, the average value of the resulting variable is 12.5, the standard deviation is 0.063.
When the variable X1 is excluded from the analysis, the classification tree is also built on just one variable X5 – the number of drug addicts registered in medical and preventive organizations at the end of the reporting year, thousand people. This variable has the following separation capacity in terms of power. Observations are divided into two classes according to the value of the variable X5. The left class contains observations for which this indicator is less than or equal to 231, and the right class contains observations for which this indicator is greater than 231. For observations of the left class, the average value of the resulting variable is 10.42%, the standard deviation is 0.093. For observations of the right class, the average value of the resulting variable is 12.5, the standard deviation is 0.063.
When excluding variables X1, X5 from the analysis, variable X6 has the next most powerful dividing ability – the number of patients with alcoholism and alcoholic psychosis registered in medical and preventive organizations at the end of the reporting year, thousand people. Observations are divided into two classes according to the value of the variable X6, the left class contains observations for which this indicator is less than or equal to 1304.6, the right class is greater than 1304.6. For observations of the left class, the average value of the resulting variable is 10.42%, the standard deviation is 0.093. For observations of the right class, the average value of the resulting variable is 12.5, the standard deviation is 0.063.
Thus, using the tree classification method allowed identifying three variables that have the greatest impact on the resulting one (share of NEET youth): the first in terms of the degree of impact is the variable “number of people employed in the informal sector in the age group of 15–19 years”; the second is the variable “number of drug addicts registered in medical and preventive organizations”; the third is the variable “number of patients with alcoholism and alcoholic psychoses registered in medical and preventive organizations”.
The correlation matrix shown in Figure 9 reflects not only the strong correlation of variables X1, X3, X4, X5, X6, X7 with the resulting variable, but also their strong correlation with each other, so the use of regression analysis is hampered by the presence of multicollinearity of explanatory variables. In this regard, within the framework of our study, we carried out a factor analysis of explanatory variables, aimed at reducing the dimension of the
Figure 11. Results of the accumulated significance test to determine the number of factors
|
Value |
Eigenvalues (Федченко.sta) Extraction: Principal components |
|||
|
Eigenvalue |
% Total variance |
Cumulative Eigenvalue |
Cumulative % |
|
|
1 |
6.001582 |
75,01978 |
6.001582 |
75,01978 |
|
2 |
1 667571 20.84464 |
7,669154 |
9 5,8 6442 |
|
Source: own compilation.
space of explanatory variables and forming a small number of common factors, and then a regression equation was constructed, where common factors act as explanatory variables.
As a result of the factor analysis, we identified two common factors, which together explain 95% of the variation in the baseline indicators ( Fig. 11 ).
Figure 12 shows the factor loads. The first factor has a strong influence on the formation of indicators such as X1, X3, X4, X5, X6, X7. This factor characterizes those employed in the unobserved, shadow economy and categories of people with problems with employment due to health, mental health and temporary disability. The second factor has a strong influence on the indicators X2, X8. This factor characterizes the categories of young people who do not have decent incomes due to education or employment with low wages.
Figure 13 presents the results of regression analysis using factors as explanatory variables. The second factor turned out to be an insignificant variable. The model has a fairly high R2 = 0.697, therefore, about 70% of the variation in the resulting variable is explained by the regression equation. The equation as a whole is significant (F = 18.422, p = 0.00264), the standard error is 0.51695.
Figure 12. Indicators forming the first and second factors
|
Variable |
Factor Loadings (Varimax normalized) (Федченко.з1а) Extraction: Principal components (Marked loadings are >,700000) |
||||
|
Factor 1 |
Factor 2 |
||||
|
X1 |
0.954314 |
-0.045284 |
|||
|
X2 |
0,520642’ 0.844777 |
||||
|
X3 |
0,936948 |
-0,071354 |
|||
|
X4 |
-0,990200 |
0.082693 |
|||
|
X5 |
0.949363 |
0.240891 |
|||
|
X6 |
0,986267 |
0,129749 |
|||
|
X7 |
0,983977 |
0,107427 |
|||
|
X8 |
0,264781 -0.950072 |
||||
|
Expl.Var |
5,952483 1,716671 |
||||
|
Prp.Totl |
0,744060 |
0.214584 |
|||
и
Source: own compilation.
Figure 13. Regression analysis results
|
N=10 |
Regression Summary for Dependent Variable: Y (Федченко.sta) R= ,83499927 R?= ,69722377 Adjusted R?= ,65937675 F(1,8)=18,422 p<,00264 Std.Error of estimate: ,51695 |
||||||
|
b* |
Std.Err. of b* |
b |
Std.Err. of b |
t[8) |
p-value |
||
|
Intercept |
11,07000 |
0,163474 |
67,71714 |
0,000000 |
|||
|
фактор 1 |
0.834999 0.194543 |
0,73960 |
0,172317 |
4,29210 |
0,002644 |
||
Source: own compilation.
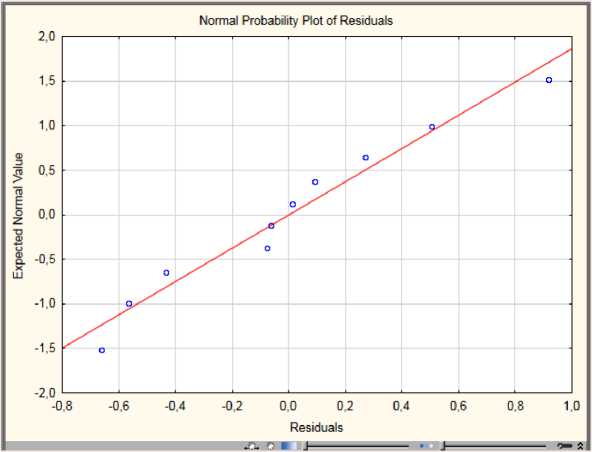
The hypotheses about the normal distribution of model errors ( Fig. 14 ) and the absence of correlation in errors ( Fig. 15 ) are fulfilled, which indicates the good quality of the regression model.
The analysis confirms that the indicators selected for the analysis have a significant impact on the formation of the resulting variable and allow building predictive models for its prediction.
Summing up the results of the expert survey and the mathematical methods used, we have drawn the following conclusions:
– the problem of the existence of NEET youth is relevant for our state, despite the relatively small scale of its spread;
– the structure of the NEET youth group is rather heterogeneous (temporarily inactive, having an agreement on work and study, intending to start it in the near future; voluntarily making a choice in favor of this life option; other inactive, who cannot indicate the reason for their inactivity, but deliberately refuse to work and study), which is confirmed by the results of an expert survey and statistical analysis;
– the main reasons that most influence the formation of NEET youth are the devaluation of the prestige of work among young people, early employment in the informal sector and falling into the category of drug or alcohol addicts; there is also a high correlation with such reasons as living in rural areas, health problems, social problems (early motherhood, care for sick family members, etc.);
Figure 14. An eye-based method for checking the normality of model errors
Source: own compilation.
Figure 15. Durbin – Watson statistic
|
Durbin-Watson d (Федченко.sta) * and serial correlation of residuals |
|||
|
Durbin- Watson d |
Serial Corr. |
||
|
Estimate |
1.855616. |
0.028229 |
|
Source: own compilation.
– the most dangerous socio-economic consequences of the existence of this group of youth are an increasing shortage of labor, marginalization, a reduction in tax revenues to the budget, and increased social tension, which requires the development of a set of regulatory measures in the context of the projected growth of this phenomenon.
Thus, the use of retrospective and statistical analysis, empirical research allowed us to study the features of this phenomenon in the global and Russian economies, identify the main causes of its spread and confirm the hypothesis put forward above.
Conclusion
The problem concerning NEET youth has gained wide scientific interest among researchers around the world in recent years. This is due to the negative consequences of this phenomenon. For countries with developed economies and difficult demographic situations, NEET youth is one of the sources of replenishment of the labor force in a labor-deficient labor market environment. For developing countries with low economic development rates and an abundance of labor, the problem of NEET youth is even more significant, since the scaling of this phenomenon leads to serious social and economic consequences in the long term. Consequently, this problem has its own specifics of formation and development for a particular country, which determines the content of the relevant state policy. Based on the research results, we proposed to implement a set of tactical (mainly aimed at those who are already part of the NEET youth) and strategic (preventive) measures for the Russian Federation.
We consider it appropriate to take tactical measures:
-
1) the inclusion in the state youth policy of a set of measures aimed at this group of youth and differentiated for the NEET unemployed and the NEET-economically inactive; due to the fact that in recent years the share of economically inactive people has prevailed among NEET youth, it is
necessary to improve the legislative and regulatory framework concerning this group and psychological and educational work in its environment; Based on the heterogeneity of the “NEET economically inactive” sub-group and the lack of clearly defined motives for its formation, it is recommended to conduct regular studies of the causes of “inactivity”, since the turbulence of socio-economic processes does not allow the formation of such activities in the future;
-
2) expanding government support measures for young people during economic crises to reduce the proportion of NEET unemployed, including through job quotas in government and budgetary organizations;
-
3) the involvement of NEET youth from “disadvantaged” regions of the Russian Federation, where this figure is 11% or higher, in employment using a wide range of forms of non-standard employment, namely remote or virtual employment, self-employment, platform employment, shift work, temporary employment;
-
4) expansion of legislative support measures for young women caring for young children (to guarantee the ability to work remotely, use flexible working hours, and part-time employment); it is advisable to develop “roadmaps” for the involvement of such women in the workforce, taking into account regional and industry specifics;
-
5) an increase in the scale of state assistance, including the cost of identification and treatment, for drug and alcohol addicts with an emphasis on young people; activities that promote social and labor adaptation, including those focused on the formation or “rehabilitation” of labor and professional skills of such a population, should be of particular importance;
-
6) stepping up measures to create a barrier-free environment, expand vocational education opportunities for people with disabilities, and involve people with disabilities in the workforce, including supporting employers who provide jobs for people with disabilities.
We consider it necessary to take strategic measures:
-
1) large-scale transformations in educational, cultural and educational work among children and youth, focused on the formation and awareness of the value of work, its role in the life of an individual and modern society; it is important to establish correct ideas about professions and their contribution to the development of the country’s economy, as well as respect for labor achievement from an early age;
-
2) systematic career guidance, implemented from the early stages of personality development and based on a wide range of tools, including digital ones;
-
3) preventive measures aimed at promoting a healthy lifestyle among children and youth, including expanding opportunities for physical education and sports, primarily on a pro bono basis,
and fostering negative attitudes toward smoking, alcoholism, and drug addiction.
Further prospects for studying NEET youth as a labor potential for development are seen in the direct connection of this problem with the digital transformation of the world and socio-economic relations at all levels – global, country, regional, as well as corporate and personal. The directions of further research of NEET youth in the Russian labor market relate to such changes as the emergence of platforms on the labor market (changing the customer-human relationship) and the expansion of the use of artificial intelligence in all areas, which affects all components of the work architecture related to the physical and social environment. The behavior of NEET youth is directly related to the change in the format of work, the growing value of human capital, the development of technology, and turbulence in some industries and spheres.
