Retinal Blood Vessel Segmentation with Optic Disc Pixels Exclusion
Author: Randy Cahya Wihandika, Nanik Suciati
Journal: International Journal of Image, Graphics and Signal Processing(IJIGSP) @ijigsp
Article in issue: 7 vol.5, 2013.
Free access
The morphological changes of retinal blood vessels are important indicators used to diagnose and monitor the progression of various diseases. A number of retinal blood vessel segmentation methods have been introduced, including the line operator based methods, which have shown satisfactory results. However, the basic line operator method cannot discriminate the pixels around the retinal optic disc, resulting in false classification of those pixels. In this paper, we integrate the detection of pixels around the retinal optic disc to the line operator method so that those pixels can be excluded from the vessel pixels. The method is evaluated on the widely used retinal dataset, the DRIVE dataset. The results demonstrate that the proposed method has made improvements over the basic and the multi-scale line detector with accuracy and area under curve of 0.942 and 0.9521, respectively.
Retinal vessel segmentation, line detector, optic disc exclusion
Short address: https://sciup.org/15013011
IDR: 15013011
Text of the scientific article Retinal Blood Vessel Segmentation with Optic Disc Pixels Exclusion
Digital image analysis has a vital role in the diagnosis and prevention of several diseases. One important thing which has gained attention in medical image analysis is the segmentation of retinal blood vessels. It is considered as one of the most important features for the diagnosis of diabetic retinopathy [1]. Information about the retinal blood vessel such as the diameter, color, reflectivity, tortuosity, abnormal branching, and width of the vessels can be useful for the analysis of disease progression, such as hypertension, diabetes mellitus, arteriosclerosis, cardiovascular diseases, and stroke [1, 2]. Furthermore, early detection of changes in those vessels is also important to prevent the patients from visual capability loss [3]. In the Western World, such visual loss is mainly caused by diabetic retinopathy [4]. In addition, retinal blood vessel analysis can also help in the analysis of other parts in the eye. For example, analysis of exudates caused by diabetes mellitus may be helped by segmenting the blood vessels and ignores the pixels in the vessels.
On the other hand, medical image analysis requires a lot of resources because the work has to be done by experts. For instance, in the diagnosis of diabetic retinopathy, which is damage that occurs in the eye caused diabetes mellitus, the number of patients who should be treated is usually high and the process is very time consuming. Approximately 10% of all diabetic patients have diabetic retinopathy [4]. Moreover, the screening should be done every six months that includes obtaining and analyzing retinal images [1]. Therefore, an automatic method using computer will help to speed up the process.
Segmentation of retinal blood vessels cannot be done with simple methods due to a number of causes such as the presence of noise, the low level of contrast between the blood vessels and the background, the difference in width of the vessels, and the brightness of the vessels. Various retinal blood segmentation methods have been suggested, from filtering methods, thresholding methods, unsupervised methods, supervised methods, to mathematical methods. Those methods fall into two categories, namely pixel processing-based methods and tracking methods [2].
Zwiggelaar et al. [5] designed a line detector method to detect linear structures in mammographic images. The method inspired Ricci and Perfetti [6] to apply the line detector to segment retinal blood vessels. It uses 12 rotated lines to detect lines (i.e. blood vessels) in the image. The outcome is an image with bright colors on the blood vessel, indicating the high line strength on the area, and dark color on other part of the image. The image is then thresholded to obtain the unsupervised binary pixel classification. To improve the performance, a supervised method is proposed to classify the vessel and background pixels with linear support vector machine (SVM) used as the classifier. The performance of both the supervised and unsupervised method is measured using receiver operator characteristic (ROC) curve. Better performance produces larger area under the curve. The supervised method gives better accuracy compared to the unsupervised method.
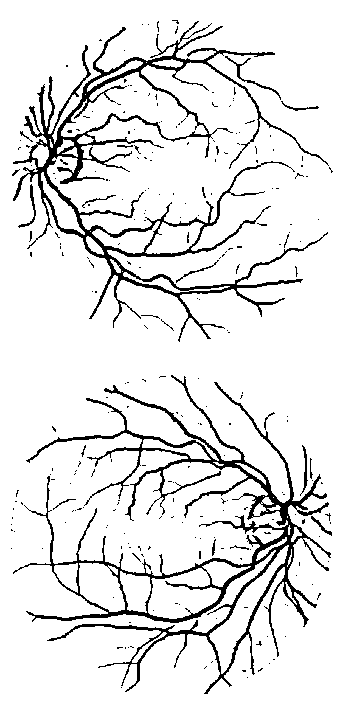
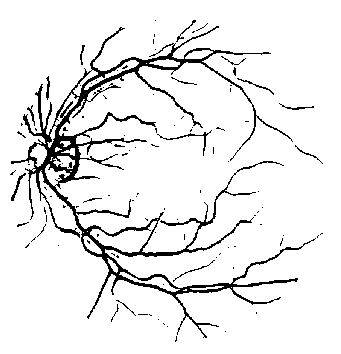
Nguyen et al. [3] mentioned a number of drawbacks found in the unsupervised method, including the wrong classification of the pixels (1) near strong vessels (vessels high intensity values), (2) near a corner of crossover points, and (3) pixels located between two close vessels. They overcome the drawbacks by introducing the multi-scale line detector. The line detectors at different scales are applied to obtain several line strength values which is then combined to get single line strength. The method is able to remove the false positive pixels produced at the three areas mentioned above and therefore improve the accuracy. However, despite the method is able to improve the performance of the segmentation system, it still leaves an issue of misclassification. As depicted in Fig. 1 (a), the method wrongly classifies background pixels around the retinal optic disc as vessel pixels. The correct classification of the same image is shown by the ground truth image in
(a)
Fig. 1 (b) where the segmentation of blood vessels around the retinal optic disc is not affected by the presence of the retinal optic disc itself. Therefore, another method is required to detect the pixels around the optic disc to be excluded from the vessel pixels in order to overcome the misclassification problem.
(b)
Fig. 1. (a) False positive occurs at pixels near the retinal optic disc in the result of multi-scale line detector method. (b) The ground truth image of the corresponding image on the left.
A number of techniques have been proposed to detect the retinal optic disc and give good results [7-12]. However, the outcome of those techniques is the location and the radius of the retinal optic disc, including blood vessels inside the retinal optic disc. Therefore, they are not suitable for the misclassification problem since it leads to another classification problem i.e. classifying the blood vessels inside the optic disc. A more feasible way is to integrate the classification of the pixels around the optic disc into the line detector method. In this paper, we propose a novel method to detect pixels near the retinal optic disc which are then excluded from the vessel pixels to improve the segmentation accuracy.
The remainder of this paper is organized as follows. Section 2 describes the details of the proposed method. The experimental results and the performance of the method are evaluated in Section 3. Finally, the paper is concluded in Section 4.
-
II. PROPOSED METHOD
-
A. Preprocessing
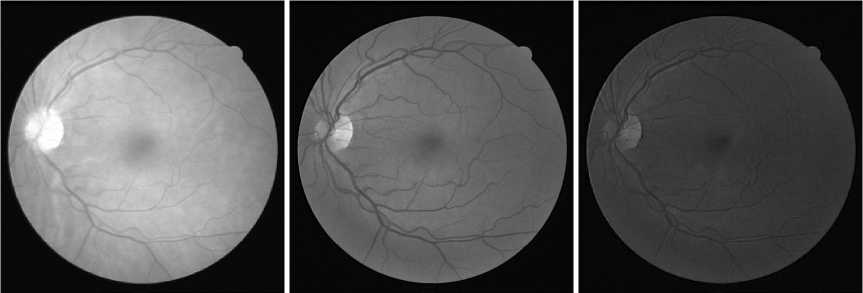
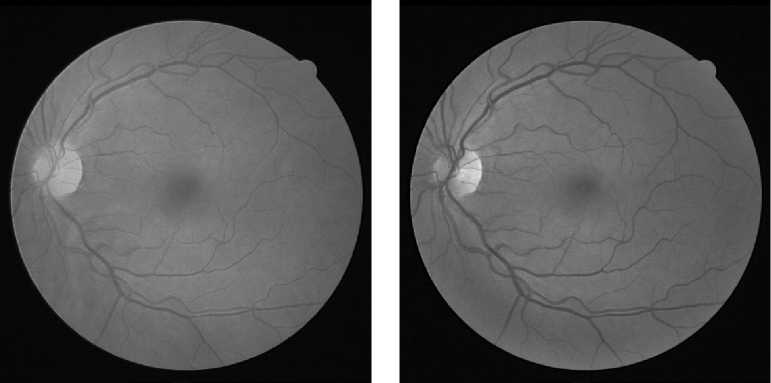
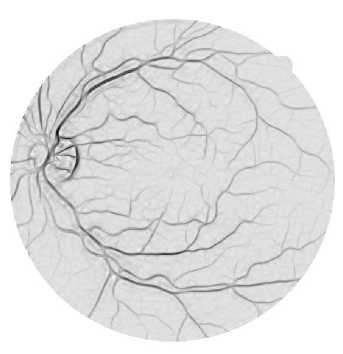
As done in many previous studies, in this study, not all color channels in the input image are used. As shown Fig. 2, the green channel image provides a good contrast and details. The brightness level of the red channel is too high, making it difficult to distinguish the blood vessels, particularly the small ones, from the background. The blue channel image is not good either because it is noisy all over the image. The grayscale version of the color image is also not better than the green channel image, as demonstrated in Fig. 3. Thus, only the green channel is used since the green channel image provides the best contrast and details. The image is then inverted so that the vessel pixels are in high values.
(a) (b) (c)
Fig. 2. The (a) red, (b) green, and (c) blue channel of the input retinal image. The green channel image provides the best contrast and details.
(a) (b)
Fig. 3. (a) The grayscale image. (b) The green channel image.
-
B. Line detector
Segmentation of retinal blood vessels is done with the line detection method proposed by Ricci and Perfetti [6]. The method uses 12 lines rotated by 15° with the central point in the middle of the window, as illustrated in Fig. 4. The line detector method works by moving the 12 lines along with the window across the image. Each line computes the average value of the pixels it passes through. Of all the twelve lines, one with the largest average value is selected, which average value is denoted with L(i, j) . On the vessel pixels, the selected line is supposed to be the one with the same orientation as the vessel. The average of pixel values in the entire window is also computed, denoted with N(i, j) . The resulting line strength of the pixel S(i, j) is computed as:
S(i, j) = L(i, j) - N(i, j) (1)
Thus, pixels on the blood vessels will have higher line strength compared to pixels on the background because there will be a large difference between the average of the selected line and the average of the entire window. Therefore, blood vessel pixels can be distinguished from the background. Pixels outside the field of view are omitted from the calculation. [6] has shown that the optimal window size is 15×15 pixels for retinal images in the DRIVE dataset. It has also been shown that the optimal window size is obtained as two times the width of the blood vessels, which are typically 7-8 pixels [3]. The pixels that are passed through by each line at different angles are determined using Bresenham algorithm. The line strength image is shown in Fig. 5 (a). The image is then thresholded to obtain the binary image shown in Fig. 5 (b).
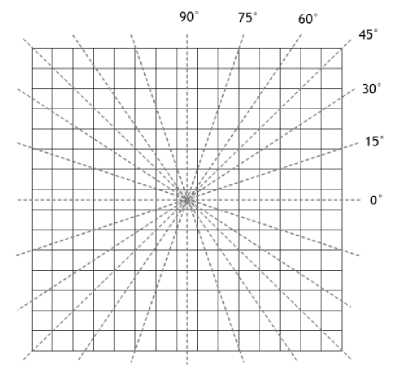
Fig. 4. The 12 rotating lines.
(a)
(b)
Fig. 5. (a) The line strength image. (b) The binary line strength image.
However, a number of drawbacks are found in some areas in the binary line strength image. As shown in Fig. 6, they are found as false positives in three areas in the image, including the areas (1) between two close blood vessels, (2) near thick blood vessels, and (3) near blood vessel branching points. It is because the selected lines in those areas pass through the blood vessels mentioned above, resulting in large line strength at those pixels. One possible way to overcome the problem is by reducing the size of the rotating line while preserving the size of the window so that the blood vessels mentioned above will be excluded from the line strength computation. Fig. 7 depicts the thresholded resulting line strength image with the line size of 3 pixels, showing improvements over the previous line size. The false positive pixels found in three areas in the previous image do not appear in the resulting image. However, the new line size produces noise in the whole image as the result of reducing the line size. More noise is produced as the line size is reduced. Hence, the line strengths in different size need to be averaged to remove the produced noise pixels while. The result is a single line strength value for each pixel in the image. By averaging the line strength values in different size of line, the produced noise pixels have been successfully removed while keeping the false positive pixels in the three areas removed. The resulting line strength image is shown in Fig. 8.

(a) (b) (c)
Fig. 6. False positive found in some areas in the binary line strength image: (a) between two close blood vessels, (b) near thick blood vessels, and (c) near blood vessel branching points.
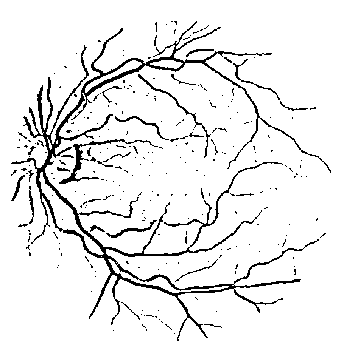
Fig. 7. The line strength image using 3-pixel line size.
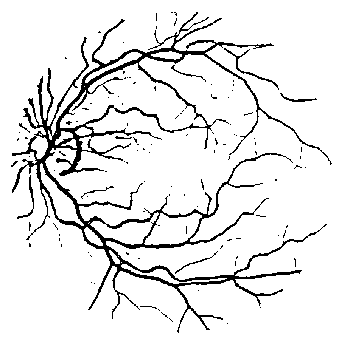
Fig. 8. The line strength image obtained from the average line strength at different line size.
-
C. Optic disc segmentation
Other false positive pixels appear in the resulting image near the retinal optic disc. Retinal optic disc is an important part of the eye where the retinal vasculature enters and leaves the eye and it marks the exit point of the optic nerve [8]. It appears as a bright circular area in the retinal image. The problem is that the pixels around it are classified vessel pixels, appearing as false positive pixels. It is because the optic disc appears as a dark area in the inverted green channel image. As a result, pixels around it will have low window average value N(i, j) , resulting in high line strength value S(i, j) . Fig. 9 illustrates this situation.
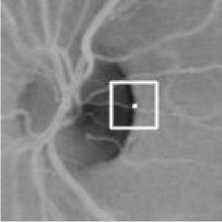
Fig. 9. A situation around the retinal optic disc where the window average value is low, resulting in the high line strength.
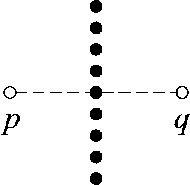
Fig. 10. Two points p and q used to segment pixels around the optic disc.
To address the problem, we introduce two points p and q located at the ends of a line perpendicular to the selected line (i.e. line with the largest average value), as illustrated in Fig. 10. The solid black circles represent the pixels in the selected line. The difference value D(i, j) between two pixels located at points p and q is added to (1), yielding:
S(i, j) = L(i, j) - N(i, j) - D(i, j)
The underlying idea behind this is as follows. Consider the situation illustrated in Fig. 9 where the line detector window moves to the edge of the optic disc (i.e. the location where the false positive occurs). The vertical line will be selected since it has the largest average value. Other lines will have lower average values because some part of the lines passes through the optic disc area which consists of low intensity pixels. In this situation, point p is located inside the optic disc area while point q is located outside the optic disc area. Therefore, there will be a high difference between the pixels located at points p and q . When the points p and q are located outside the optic disc area, the difference between the pixel values at the two points is not high so the line strength value S(i, j) will not be much affected. Hence, it can be used to characterize the pixels around the optic disc.
Thus, a new line strength image is obtained which is then inverted and thresholded to get the segmentation of the optic disc, as depicted in Fig. 11. The resulting binary image is able to segment most of the pixels around the optic disc. The image is then used to subtract from the previously produced line strength image (Fig. 8), resulting in the line strength image shown in Fig. 12. The image is then thresholded to obtain the final retinal blood vessel segmentation shown in Fig. 13.
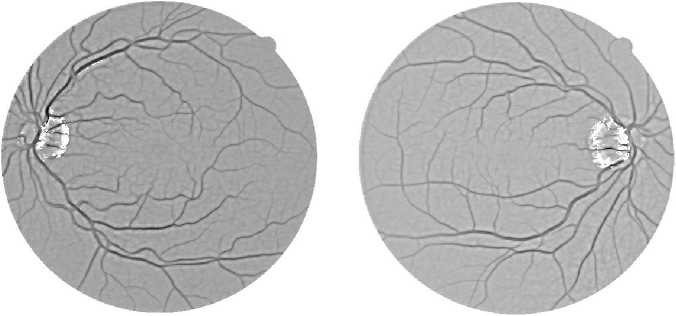
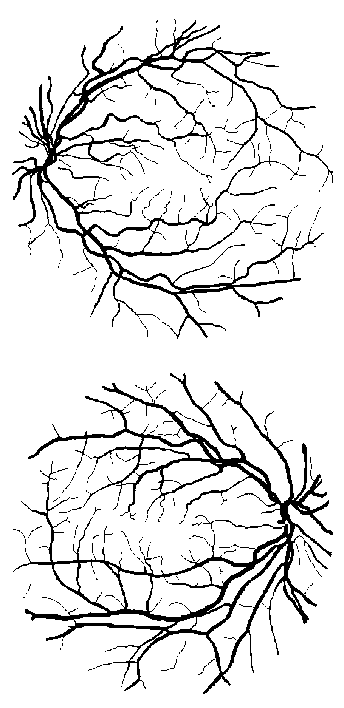
Fig. 12. The line strength images after optic disc pixels exclusion. The used input images are the same as in Fig. 1.

Fig. 11. The segmentation result of the retinal optic disc pixels.
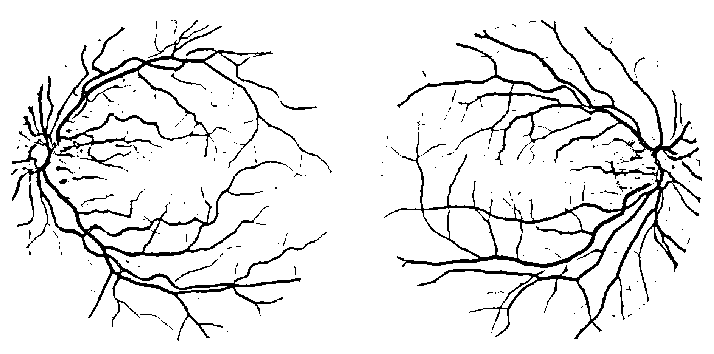
Fig. 13. The final segmentation images. The used input images are the same as in Fig. 1.
-
III. RESULTS AND DISCUSSION
-
A. Dataset
The dataset used in this study is the DRIVE (Digital Retinal Images for Vessel Extraction) dataset collected by Niemeijer et al. [13]. It is a publicly available dataset which consists of 40 color retinal images divided into training set and test set. They were taken from a diabetic retinopathy screening program in the Nederlands. The camera used to capture the images is a Canon CR5 non-mydriatic 3-CCD camera with a 45° field of view (FOV). All the images are of size 768×584 pixels in 24 bits color depth. It comes with a mask image and a ground truth image for each color images. The mask images are used to get the field of view of the input color images so that manual segmentation of the region of interest is not needed. The ground truth images are manually created by observers, used to compare with the output images of the proposed method to obtain its accuracy. Two ground truth images are available for each color images in the test set, while only one ground truth image is available in the training set.
Table.1 Performance of different distance d of the two POINTS p AND q.
|
d |
Accuracy |
|
9 |
0.9408 |
|
11 |
0.9412 |
|
13 |
0.9414 |
|
15 |
0.9415 |
|
17 |
0.9415 |
|
19 |
0.9416 |
|
21 |
0.9415 |
|
23 |
0.9414 |
-
B. Performance measures
The performance of the proposed method is measured using two commonly used measures, accuracy and receiver operating characteristic (ROC) curve. Accuracy, being the simplest measure, is obtained as the ratio of the number of correctly classified pixels (sum of true positives and true negatives) to the total number of pixels in the field of view. ROC curve is also a widely used measure to evaluate retinal blood vessels segmentation method [6]. It is drawn by plotting the fraction of the true positive rate (TPR) versus the fraction of false positive rate (FPR) of the segmentation results. True positive rate, also known as sensitivity, is the proportion of vessel pixels correctly classified as vessel pixels, while false negative rate is the proportion of vessel pixels wrongly classified as background pixels. Different TPR and FPR are obtained by thresholding the line strength image at various threshold levels between 0 and 255. A good segmentation result is one with the curve near the top left corner. Area under the curve (AUC) is one of the most common measures used to compare ROC’s.
There are two parameters to tune in this experiment, the threshold value to obtain the binary image and the distance between the two points p and q . The first experiment is to find the optimal distance which can achieve the best accuracy. For the experiment, the threshold value is kept fixed at 127. The optimal distance value is then used to find the optimal threshold value. The result using the optimal configuration of those values is used to compare with other segmentation methods.
Table.2 Performance of different methods in terms of accuracy and area under curve (AUC).
|
Method |
Accuracy |
AUC |
|
Ricci & Perfetti |
0.9319 |
0.9424 |
|
Nguyen et al. |
0.9411 |
0.9496 |
|
Proposed |
0.942 |
0.9521 |
-
C. Results
Different accuracy can be achieved using different distance of the two points p and q (Fig. 10) in the process of segmenting the optic disc pixels. Table 1 shows the comparison of different accuracy. The best result in terms of accuracy is achieved when the distance is set to 19 used to run the method on the 20 images in the dataset. The same distance value is used for all images to find the best threshold value for each image.
The accuracy achieved using the method by Ricci and Perfetti [6] is different from the accuracy they reported in their paper. As also reported in [3, 14], we fail to achieve the same accuracy. Table 2 shows the comparison of the proposed method with the methods in [3, 6] in terms of both accuracy and AUC. The increase of accuracy of the proposed method against other methods is not high due to the small number of pixels around the optic disc compared to the total number of pixels in the field of view. Hence, despite of the small increase, the proposed method has given satisfactory results.
-
IV. Conclusion
In this work, we have presented a retinal blood vessel segmentation method with optic disc pixels detection. Firstly, the segmentation of the retinal blood vessels is done using multi-scale line detector technique. Then, the pixels around the retinal optic disc are segmented. The resulting optic disc segmentation image is then used to subtract from the image obtained using the multi-scale line detector technique. The result is a blood vessels segmentation image which excludes false positive pixels around the optic disc that occurs when using the line detector technique alone. The experimental results show that the proposed method is able to remove most pixels around the retinal optic disc thus improving the accuracy of the segmentation. It achieves the best accuracy and area under curve of 0.942 and 0.9521, respectively. However, the method can be further improved to detect small vessels since it fails in segmenting many small blood vessels.
References Retinal Blood Vessel Segmentation with Optic Disc Pixels Exclusion
- M.D. Saleh, C. Eswaran, A. Mueen, "An automated blood vessel segmentation algorithm using histogram equalization and automatic threshold selection", Journal of Digital Imaging, Vol. 24, No. 4, Aug. 2011.
- A.M. Mendonça, A. Campilho, "Segmentation of retinal blood vessels by combining the detection of centerlines and morphological reconstruction", IEEE Transactions on Medical Imaging, Vol. 25, No. 9, Sep. 2006.
- U.T.V. Nguyen, A. Bhuiyan, L.A.F. Park, K. Ramamohanarao, "An effective retinal blood vessel segmentation method using multi-scale line detection", Pattern Recognition, Vol. 46, No. 3, pp. 703–715, Mar. 2013.
- J. Staal, M.D. Abràmoff, M. Niemeijer, M.A. Viergever, "Ridge-based vessel segmentation in color images of the retina", IEEE Transactions on Medical Imaging, Vol. 23, No. 4, pp. 501-509, Apr. 2004.
- R. Zwiggelaar, S. M. Astley, C. R. M. Boggis, and C. J. Taylor, "Linear structures in mammographic images: Detection and classification", IEEE Transactions on Medical Imaging, Vol. 23, No. 9, pp. 1077–1086, Sep. 2004.
- E. Ricci, R. Perfetti, "Retinal blood vessel segmentation using line operators and support vector machine", IEEE Transaction on Medical Imaging, Vol. 26, No. 10, pp. 1357-1365, 2007.
- D. Welfer, J. Scharsanski, D.R. Marinho, "Fovea center detection based on the retina anatomy and mathematical morphology", Computer Methods and Programs in Biomedicine, Vol. 104, No. 3, Dec. 2011.
- M. Niemeijer, M.D. Abràmoff, B.v. Ginneken, "Fast detection of the optic disc and fovea in color fundus photographs", Medical Image Analysis, Vol. 13, No. 6, pp. 859-870, Dec. 2009.
- H.K. Hsiao, C.C. Liu, C.Y. Yu, S.W. Kuo, S.S. Yu, "A novel optic disc detection scheme on retinal images", Expert Systems with Applications, Vol. 39, No. 12, pp. 10600-10606, Sep. 2012.
- H. Tjandrasa, A. Wijayanti, N. Suciati, "Optic nerve head segmentation using Hough transform and active contours", Telkomnika, Vol. 10, No. 3, pp. 531-536, Jul. 2012.
- J. Xu, O. Chutatape, E. Sung, C. Zheng, P.C.T. Kuan, "Optic disk feature extraction via modified deformable model technique for glaucoma analysis", Pattern Recognition, Vol. 40, No. 7, pp. 2063-2076, Jul. 2007.
- J. Kaur, H.P. Sinha, "Automated Localisation of Optic Disc and Macula from Fundus Images", International Journal of Advanced Research in Computer Science and Software Engineering, Vol. 2, No. 4, pp. 242-249, Apr. 2012.
- M. Niemeijer, J. Staal, B. van Ginneken, M. Loog, and M. D. Abramoff, "Comparative study of retinal vessel segmentation methods on a new publicly available database," in SPIE Medical Imaging, J. M. Fitzpatrick and M. Sonka, Eds., Vol. 5370, pp. 648–656, 2004.
- B.S.Y. Lam, Y. Gao, A.W.C. Liew, "General retinal vessel segmentation using regularization-based multiconcavity modeling", IEEE Transactions on Medical Imaging, Vol. 29, No. 7, pp. 1369–1381, Jul. 2010.
