RGB color camera for dynamical measurements of high temperature distribution on a surface of the heated solid

Author: Bulatov Kamil M., Zinin Pavel V., Bykov Alexey A., Malykhina Irina V.
Journal: Компьютерная оптика @computer-optics
Section: Дифракционная оптика, оптические технологии
Article in issue: 1 т.47, 2023.
Free access
In this report we describe a fast 3-color method of the measurement of temperature distributions on a surface of a heated solid using a RGB color camera with a high frame rate (100 images per second). Statistical error the RGB method is not high, and do not exceed around 5.5 % which is surprising taking in to account the number of the measurements at each pixel. Comparison of the results of the temperature measurements on a tungsten plate heated by infra-red laser radiation and conducted with this technique and those obtained with the acousto-optical tunable filter technique demonstrate that error of the temperature measured by 3-color method is only two times as high as that of the tandem acousto-optic filter technique method.
Rgb camera, temperature measurement, spectral imaging
Short address: https://sciup.org/140296261
IDR: 140296261 | DOI: 10.18287/2412-6179-CO-1125
Text of the scientific article RGB color camera for dynamical measurements of high temperature distribution on a surface of the heated solid
It was demonstrated recently that a tandem acoustooptic filter (TAOF) used in combination with a monochrome camera allows to measure temperature distribution (TD) of laser heated objects with unknown emissivity [1, 2]. Temperature distribution measurement with accuracy of less than 3 % is carried out by the method of hyperspectral images of thermal radiation of the heated area of the object [3, 4]. Unfortunately, this method cannot be used for investigation of fast thermal processes such as fast phase transitions, melting etc. because the typical exposure time of the TAOF measurements varies from 0.5 to 0.1 s.
In this report we describe an algorithm for fast image processing of RGB camera that allows measurements of the TD on the laser heated surface with the exposure time of 300 ц s.
Method
The temperature of a heated specimen can be determined by measuring the radiation emitted by a material as a function of wavelength and fitting the experimental data to the Planck’s gray object equation [5, 6]
I = (X, 8, T ) =8 * g (X, T ),(1)
g (X, T) = —----c1 ■ .,(2)
X 5 exp I - c ^ | - 1
I UTJ where I is the spectral intensity, c1 and c2 are the physical constants (c1 =2πc 2,c2 = hc/kB = 0.01432 m K), c is the velocity of light, h is the Planck’s constant, and kB is the Boltzmann constant. The emissivity 8 is defined as the ratio of radiation emitted by the real surface to that emitted by the blackbody at the same temperature and for the same spectral bandwidth.
In the TAOF imaging system, the image captured by the camera represents a distribution of the intensity irradiated by a specimen at a given wavelength λ controlled by the TAOF. The measured intensity in each pixel ( x , y ) of the TAOF spectroscopic image is proportional to the intensity of electromagnetic radiation irradiated by an element of the inspected object’s surface at a given wavelength λ [4]. Study of the thermal radiation conducted with laser heating (LH-TAOF) system revealed that the intensity of thermal radiation at the selected wavelength was sufficient for recording a hyperspectral image of a video camera when the exposure time is higher than 0.1 s in the temperature range from 1000 to 5000 K [2]. The idea to use an RGB camera for measuring fast thermal processes is straightforward. To measure TD under laser heating with the speed higher than 0.1 s it is necessary to use an imaging system where each point on the Plank’s curve is the results of the measurement of the thermal radiation not a single wavelength but over a fixed wavelength range which is sufficient for recording a signal with the amplitude higher than that of noise.
The standard method to estimate the temperature of a heated body is to use Correlated Color Temperature (CCT) approach described elsewhere [7, 8]. In the CCT method, three coordinates X, Y, Z, called as “light source's chromaticity coordinates”, of the black body radiator are introduced. The values of the coordinates can be calculated using the Planck’s law of the source and CIE standard “observer matching functions” x (λ), y (λ), z (λ) [9].
X = K I X= 380 g ( X T ) * ^ (X) , (3)
Y = K X '"„g 0, T ) * y W • (4)
Z = K X Z.^ ( ^ .T ) - •' (5)
where K is normalizing constant: the value of the coordinate Y varies from 1 to 100. These functions can be regarded as the spectral sensitivity curves of three linear light detectors, which produce the CIE tristimulus values. The set of functions are known as the Standard Observer. In [10], authors define the CIE standard colorimetric observer tables that were used for the calculations in this paper. The next step is to introduce chromaticity coordinates u , v .
X u =-----------,
X + Y + Z
Y v =-----------,
X + Y + Z
The coordinates are used in the McCamy’s equation that estimates color temperature from the chromaticity coordinates [8]:
CCT = 449 n 3 + 3525 n 2 + 6823 n + 5520, (8)
where u -0.332
0.1858 - v
Eqs. (8–9) are determined for standard functions x (λ), y (λ), z (λ) and they are different for different detectors and optical setups.
Recently, the method based on the eqs. (6) and (7) was applied for determination of the temperature distribution using an RGB camera [11 – 13]. A methodology was proposed to obtain the spectral response of a photodetector by constructing the characteristic curve using the monochromatic response [9, 13]. A broadband light source and a spectrometer were used to measure “observer matching functions” and to determine the temperature of the irradiated headed body. Unfortunately, these techniques do not take into account the emissivity of the heated body. It leads to the high errors of the temperature measurements [14].
Despite of the simplicity of the method it can be used only for the determination of the temperature of a black body. However, majority of solids radiate in a manner different from that of a black body. The distinctions are described by the emissivity ε (λ, Т) ≤ 1, which is an individual characteristic of materials and surfaces [15]. For grey bodies, for which emissivity is not dependent on the wavelength, the algorithm of the temperature determination is well developed and is based on method of the least squares (LSQ) [1, 5]. In this study, we propose an approach based of the use of the spectral sensitivity curves of the R, G, B sensors and the LSQ method for determination temperature of the grey heated body [1, 2]. The distinctive feature of our proposed method is its simplicity and the fact that it allows us to determine the temperature distribution over 3 wide spectral channels, with an unknown emissivity of the object. During laser heating, the emissivity coefficient is unknown, which will lead to a temperature error of up to 100 percent.
We can write an expression of the signal (2) for the RGB sensors when a specimen heated to the temperature T
I theor ( T ) = X Z80 S oPt M ■ S^ am W ' g (X , T ) " (W)
Where the spectral sensitivity curves of the RGB sensors of the camera: S cam , = R, G, B and the spectral sensitivity curves the optical system: S sys , =R, G, B. If the value of the signal of the sensor is I exp the least square method can be formulated in the following form. The least-squares method finds the optimal values of the temperature T and emissivity s by minimizing the sum of squared residuals
S = X i = R , G,B ( P exP -S^ Р^г ( T ) ) 2. (11)
The two-dimensional minimization (11) can be reduced to one dimensional minimization taking into account the fact that emissivity s in (11) is a linear parameter. This method was described in details elsewhere [1, 2]. The function S has a minimum when:
dS/ds = 0.(12)
Then:
X i = R , GJexp ■ I theor ( T )
S =
X ' = R , G , B ( Ptheor ( T ) )
.
Substituting an expression (13) into the eq. (11) we obtain
Г Ti ii(vx'x
X ' = R , G , Bex I theor ( T )
S = X i = R , G,B I exp -■ I theor ( T )” T" —.T -(14)
v X ' = R , G , B ( I theor ( T ) ) ,
Therefore, the procedure described above reduces the problem of 2-D non-linear least squares fitting (11) to onedimensional (1-D) non-linear least square fitting, eq. (14).
Experimental setup
Experimental setup for temperature measurement is shown in fig. 1. The specimen is placed on the xyz-stage (Standa 8MVT40-13) for alignment. The imaging optical system includes a long working distance, infinity-corrected objective x10 (Obj), beam splitter (BS) 50/50 in the wavelength range 500-850 nm, a lens (L1) with focal distance 400 mm and CCD color camera of (MT9P031 1/2.5-Inch 5Mp Digital Image Sensor). The thermal radiation of the heated specimen after splitter is focused by the lens L2 with focal distance 50 mm on entrance slit of the spectrometer (M266 Solar). Mirrors M1, M2 are used for alignment, and flip-flop mirror M3, M4 for calibration. We use a tungsten plate of the lamp SI6-100 for the calibration. The temperature of the lamp can be varied by a DC power supply.
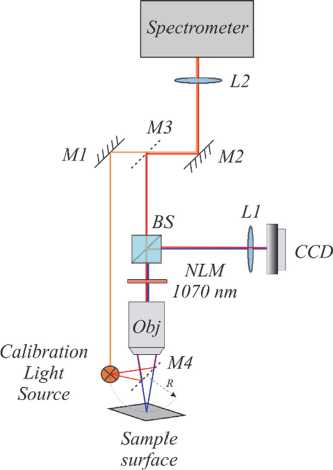
Fig. 1. Experimental setup for temperature measurements by the RGB camera
Calibration
For measure the TD we need to know the spectral sensitivity curves of the RGB sensors of the camera: S i cam , i =R, G, B . In this report we use the spectral sensitivity curves provided by the producer of the RGB camera (MT9P031 1/2.5-Inch 5 Mp Digital Image Sensor). The choice of the 8 bit camera was based on the requirement to have high speed method for high temperature distribution measurements. The use of 12-bit cameras significantly increases the reading time. Our simulations show that the camera with 8 digits allows measurements of temperatures from 1400 K and above.
The spectral sensitivity curves of the RGB sensors of the camera are shown in fig. 2. However, during experiments the spectral sensitivity curves distorted within the optical system (objective, splitters) should be used: S isys , i =R, G, B. Expression for the S isys a form:
S isys ( λ ) =S opt ( λ )* S i cam ( λ ), (15) where S i cam ( λ ) is spectral curve for the distortion introduced by optical elements of the system for i channel.
Now, it is necessary to determine spectral curve for the optical system S opt ( λ ). To measure S opt ( λ ) we will use the tungsten plate of the lamp SI6-100 heated to the T c= 1720 K. If the thermal radiation from the heated lamp is directed through mirrors M 2 and M 3 then the signal on the spectrometer, S spect+opt ( λ ) can be written as
S spect+opt ( λ ) =S det ( λ ) ⋅ S opt ( λ ) ⋅ε c g ( λ ,T с ), (16)
where Sdet (λ) is the spectral sensitivity curve if the detector in the spectrometer. To measure Sspect(λ) we direct the thermal irradiation of the lamp though mirrors M1 and M2 directly to the spectrometer. The signal on the spectrometer can be written as:
S spect ( λ ) = S det ( λ ) ⋅ε c g ( λ ,T с ). (17)
From eq. (11) and (12) we see that
S spect + opt ( λ )
Sopt ( λ ) = . (18)
S spect ( λ )
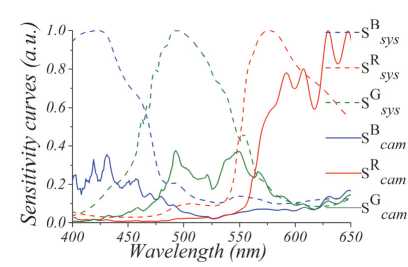
Fig. 2. Sensitivity curves, Si cam ( λ ) and Si sys ( λ ) for different camera’s sensors
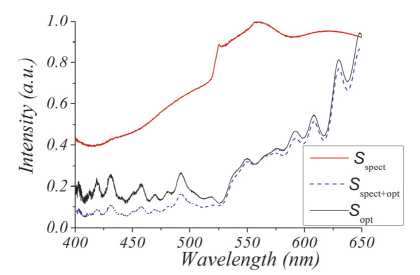
Fig. 3. The spectral sensitivity curves of S spect spectrometer; S spect+opt optical way witch spectrometer and optical elements, S opt only optical way
We also accept in eqs. (15– 18) the fact that lenses L 1 and L 2 are identical do not distort sensitivity corves S spect+opt and S spect . In this experiment we used AC254-400-A lens from Thorlabs that introduce spectral distortion of no more than two percent in the range 400700 nm [16]. Fig. 3 shows spectral sensitivity curves of (a) spectrometer, S spect , (b) the sum of spectrometer and optical elements, and (c) that of only optical way S opt . Now we can determinate an expression of the signal for the RGB sensors when a specimen heated to the temperature T is placed in the focus of the system (10).
Results
The tungsten plate was heated by a current of 10 A. Fig. 4 shows the intensity distribution obtained by the blue sensor of the RGB camera. The procedure is similar to that described in Ref. [2]. The temperature at each pixel of RGB camera is determined by finding minimum of the sum of squares (14). The distribution temperature obtained by 1-D minimization is shown in fig. 5.
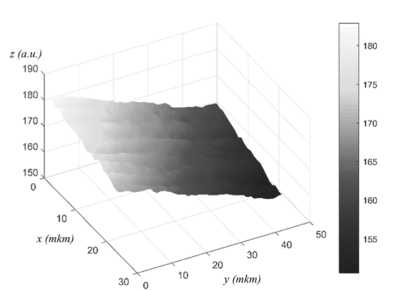
Fig. 4. Signal distribution on blue channel of RGB camera
the confidential probability [17]. This gives Δ T 0.95 = ± 105 K for the confidence interval for the temperature in fig. 5 with a 0.95 level of confidence, and for n =3, p =2.
2100200019001800-g 1700160015001400
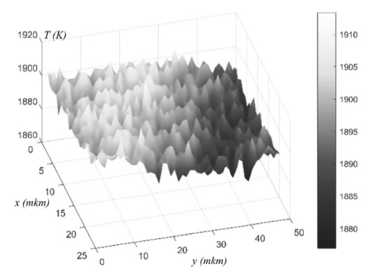
Fig. 5. Temperature distribution tungsten plate, with current 10 A
Fig. 6 shows the behavior of the sum of squares S at a selected pixel on the temperature map as a function of temperature T . It has a minimum at T = 1910 K. The confidence interval of the temperature T was determined by using a standard technique for non-linear regression described in [17].
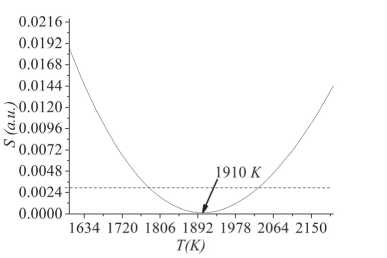
Fig. 6. Experimental data fitting using 1-D minimization procedure for a selected point on the tungsten plate in the lamp when the current was 10 A. Graph shows the behavior of the normalized S (Equation (18)) as a function of temperature. The function S has a minimum at Trgb = 1910 K. With the confidence of 95 % the confidence interval is ΔT 0.95 = ± 112 K
We can determine the confidential interval Δ T for a chosen confidence level of 95 %. The confidence interval is defined by taking S ( T ) = constant, where the constant is determined by expression
S (T)= S (T0)[1+p/(n – p)×F(n, p, α)], where p is the number of parameters, n is the number of experiments, F(n, p, α) is the Fisher parameter, and α is
1300-- 1—1—।—1—।—1—।—-—।—1—।—-
7 8 9 10 11 12
/(A)
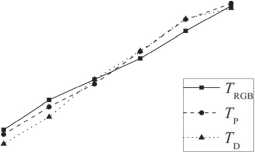
Fig. 7. Temperature of the tungsten lamp as a function of the electrical current I measured by three methods: (1) Trgb (filled squares) is temperature measured by the RGB camera (eq. 18);
-
( 2) Td (filled triangles) is the temperature measured by diffraction spectrometer; (3) Tp (filled cycles) is the temperature measured by commercial pyrometer
To compare results obtained by the RGB camera, a diffraction spectrometer and commercial pyrometer were used to conduct an experiment similar to that described in Refs. [1, 2]. In this experiment a tungsten lamp was heated by an electric current and the temperature of the heated tungsten plate was measured as a function of the electric current by three techniques simultaneously. Results of the RGB camera measurements are shown in fig. 7. The value of the temperature T D was measured by a diffraction spectrometer as described in Ref. [2]. The difference of temperature measured by three techniques is less than exceed 70 K indicating that the estimation of the statistical error of the method described above is in a good agreement with this value. Statistical error the RGB method is not high, and do not exceed around 5.5 % which is surprising taking into account the number of the measurements at each pixel.
To estimate the temperature range in which the method provides an acceptable accuracy, the signal was simulated on three channels at temperatures of 2500 and 3500 K. It was done by multiplication of the Planck function by the transmission function of the system and the sensitivity of the camera for different channels in the wavelength range 450–700 nm. The simulation results show that at temperatures of 2500 K and 3500 K, the long-wavelength part of the spectrum makes a big contribution, even in channels B and G. With increasing temperature, the contribution of the blue channel increases. At the same time, the values of the signals of all channels fall within the dynamic range of the camera. Thus, theoretically, the upper bound of this method lies above 3500 K. In practice, to determine temperatures above 2950 K it is required to use a neutral filter due to overexposure of the matrix.
The lower temperature limit is around 1400 K. At lower temperatures, the intensity of the signal from the blue channel becomes comparable with the noise level. For a different camera and optical system, this value may be different.
Conclusion
In this study, we propose an approach based of the use of the spectral sensitivity curves of the R, G, B sensors and the least square method for determination temperature of the grey bodies [1, 2]. The distinctive feature of our proposed method is its simplicity and the fact that it allows us to determine the temperature distribution over 3 wide spectral channels, with an unknown emissivity of the object.
Comparison of the results of the temperature measurements on a tungsten plate heated by infra-red impulse laser radiation and conducted with this technique and those obtained with the acousto-optical tunable filter technique demonstrate that error of the temperature measured by 3-color method is only two times as high as that of the TAOF technique method. It might be related to the fact that the procedure finding the least of squares (14) is also indirectly include curves of the sensitivities of the RGB sensors.
The proposed method makes it possible to determine the temperature distribution in the range from 1400 K to 3000 K (result tungsten plate), along 3 wide spectral channels, with an unknown emissivity of the object.
References RGB color camera for dynamical measurements of high temperature distribution on a surface of the heated solid
- Bulatov KM, Mantrova YV, Bykov AA, Gaponov MI, Zinin PV, Machikhin AS, Troyan IA, Batshev VI, Kutuza IB. Multi-spectral image processing for the measurement of a spatial temperature distribution on the surface of a laser-heated microscopic object. Computer Optics 2017; 41(6): 864-868. DOI: 10.18287/2412-6179-2017-41-6-864-868.
- Zinin PV, et al. Measurement of the temperature distribution on the surface of the laser heated specimen in a diamond anvil cell system by the tandem imaging acousto-optical filter. High Press Res 2019; 39(1): 131-149.
- Machikhin AS, Shurygin AV, Pozhar VE. Spatial and spectral calibration of an acousto-optical spectrometer. Instrum Exp Tech 2016; 59(5): 692-697.
- Machikhin AS, et al. Imaging system based on a tandem acousto-optical tunable filter for in situ measurements of the high temperature distribution. Opt Lett 2016; 41(5): 901-904.
- Magunov AN. Spectral pyrometry (Review). Instrum Exp Tech 2009; 52(4): 451-472.
- Heinz DL, Jeanloz R. Temperature measurements in the laser-heated diamond cell. In: Manghnani MH, Syono Y, eds. High-pressure research in mineral physics: A volume in honor of Syun-iti Akimoto. Washington DC: American Geophysical Union; 1987: 113-127.
- Borbely A, Samson A, Schanda J. The concept of correlated colour temperature revisited. Color Res Appl 2001; 26(6): 450-457.
- McCamy CS. Correlated color temperature as an explicit function of chromaticity coordinates. Color Res Appl 1992; 17(2): 142-144.
- Botero JS, Lopez FE, Vargas JF. Characterization of photodectors using a monochromator and a broadband light source in the XYZ color space. Int J Smart Sens Intell Syst 2016; 9(2): 752-764.
- Zinin P, et al. Bonding, elastic and vibrational properties in low and high pressure synthesized diamond-like BCx phases. J Phys-Conf Ser 2017; 950: 042050.
- Glushkov DO, Egorov RI, Klepikov DM. High-speed contactless measurements of temperature evolution during ignition and combustion of coal-based fuel pellets. Int J Heat Mass Transf 2021; 175: 121359.
- Densmore JM, et al. High-speed digital color imaging pyrometry. Appl Opt 2011; 50(17): 2659-2665.
- Valencia J-SB, Giraldo F-EL, Bonilla J-FV. Calibration method for Correlated Color Temperature (CCT) measurement using RGB color sensors. Symposium of Signals, Images and Artificial Vision 2013: 1-6.
- Magunov AN, Zakharov AO, Lapshinov BA. Measurements of nonstationary temperatures by the spectral pyrometry method. Instrum Exp Tech 2012; 55(1): 134-139.
- Magunov AN. The choice of a spectral interval within which a heated opaque object radiates as a gray body. Instrum Exp Tech 2010; 53(6): 910-914.
- Thorlab. 2020. Source: (https://www.thorlabs.com/ newgrouppage9.cfm?objectgroup_id=259).
- Draper NR, Smith H. Applied regression analysis. New York: Wiley; 1966: ix, 407.
