RISAT-1 Image Despeckling using a Modified Undecimated BM3D Technique

Author: Murali Mohan Babu. Y, K. Radhika
Journal: International Journal of Image, Graphics and Signal Processing(IJIGSP) @ijigsp
Article in issue: 5 vol.8, 2016.
Free access
In synthetic aperture radar (SAR) imaging, the transmitted microwave pulses from space born antenna interacts with ground objects and returned energy or back scattered energy will be collected to get backscattered image. In SAR image processing, a not anticipated noise (speckle noise) is added due to the coherent imaging system, which makes the image analysis troublesome. For better SAR image processing, the noise is to be removed or minimized in the begging stages of pre-processing and texture features are to be effectively maintained. The wavelet based Block Matching 3D (BM3D) method is normally considered as the state of art technique in the area of denoising of images. This method generally depends on up and down sampling conversion. In this paper, it is proposed a denoising technique which is independent on sampling conversion, so that texture features can be maintained, in which the speckle noise is reduced to the maximum extent.
BM3D, Image, SAR, Speckle, Wavelet
Short address: https://sciup.org/15013976
IDR: 15013976
Text of the scientific article RISAT-1 Image Despeckling using a Modified Undecimated BM3D Technique
Published Online May 2016 in MECS DOI: 10.5815/ijigsp.2016.05.04
The interest on Synthetic Aperture Radar images has been growing for the last few years due to its significance in a variety of applications such as mapping, search-and-rescue and target recognition. It is an active imaging process that uses the motion of a radar with physical aperture antenna mounted on a platform, such as an aircraft or a satellite, to synthesize the effect of a long aperture in order to attain the high resolution of a virtual focused array system with a much larger aperture.
The observation of the earth from some safe ground has always been an important task from the earliest times in human history. The high ground has been extended from trees to early observation balloons, reconnaissance aircraft, and finally to cameras in space. This desire to view the earth has been extended to the observation of things in ways that could never be achieved with our own eyesight. Observation using radiation invisible to the human eye is also becoming very important. It is the ability of radar imagery to penetrate most atmospheric barriers to observation that makes it very desirable.
Since its origin in the 1950's, SAR has been developed into a mature technology and is now recognized as a highly successful imaging tool for weather monitoring, crop growing, forest deformation, mine detection, mapping and military systems that need imaging at high resolutions. It is an active microwave sensor that transmits signals in microwave region. SAR operation is entirely different from regular sensors like optical sensors. Radar Indian Satellite-1 (RISAT-1) is the first Indian microwave sensor that operates in C-band and is used mainly to monitor crop growth. Different resolutions and different swaths are possible with RISAT-1 sensor.
Speckle is a common and special type of noise in all coherent imaging systems that is possible in SAR imaging system [11]. The frequency domain filters mainly started with revolution from the invention of wavelets. The speckle has to be minimized to analyze the SAR image correctly. The removable of speckle plays critical and important role in preprocessing of any SAR system. A variety of spatial domain filters and transform domain procedures are available in SAR domain. But still there is possibility to despeckle further and further to achieve maximum reduction of speckle. Spatial domain filters like lee and map filters [1-5,12-13] gave better despeckling results and are failed in preserving the edge details. Wavelet domain filters [6-9] have produced better response than spatial filters. That is the reason, the researchers have concentrated on transform domain filters [14-16,18,20].
A combination of transform domain and spatial domain image denoising algorithms is presented in BM-3D algorithm. It consists of hard thresholding and wiener filter in wavelet domain. However, the smoothing of homogeneous areas and the preserving of edges are still not well balanced in these methods. The BM3D method is generally considered as state of art method in denoising of images and despeckling of SAR images[10]. The compressive sensing 3D (CS-3D) despeckling framework is comprised of three major steps; selection of subsets of pixels from SAR images, reconstruction of SAR image from each subset of pixels using CS theory, and statistical combining of multiple reconstructed images by employing selective 3D filtering. In this paper, we proposed a technique to despeckle the SAR images to the maximum extent while maintaining the edge characteristics. We compared our proposed method with state-of-art methods in terms of quality parameters like Equivalent Number of Looks (ENL), Speckle Suppression Index (SSI), Peak Signal to Noise Ratio (PSNR) and Edge Saving or Preservation Index (ESI or EPI).
-
II. Modified BM-3D Method
The radar image will be cropped according to user's specification. If the image is in (high level product) GEOTIFF format, generally it is a noise-free one, otherwise it is contaminated with noise. This SAR image is given as input to undecimated wavelet transform for extracting the possible coefficients. On separating the coefficients, the needy low frequency coefficients are processed by inverse undecimated wavelet transform.
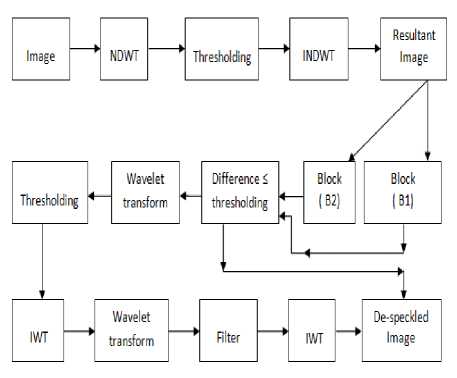
Fig.1. Proposed Method
The output image of previous step is split into various blocks of standard size, which are compared with each other to calculate euclidean distances. The block with euclidean distance lesser than the threshold value is fed to discrete wavelet transform and coefficients are extracted. The low frequency coefficients extracted are then processed for hard threshold and image is reconstructed by using inverse discrete wavelet transform. This is process is illustrated in the flowchart shown in figure 1.
The reconstructed image obtained in the last step is forwarded to discrete wavelet transform for once again calculating the possible coefficients. On low frequency coefficients a Wiener filter is applied for processing and the inverse discrete wavelet transform is applied on the coefficients for reconstructing the image.
Generally, the microwave satellite image can be tested in terms of the quality parameters like EQNL, SSI, CC, ESI or EPI, MSE and PSNR values. The said quality parameters are tested and noted on Indian RISAT-1, German Terrasar-X and Japanese ALOS sensors. The proposed and existing algoritms are tested on above said sensors to evaluate the quality parameters like EQNL, SSI, CC, ESI or EPI, MSE and PSNR values.
-
III. Results and Discussions
The modified BM-3D method along with existing methods like compressive sensing theory based 3D, block matching based 3D, principal component analysis, etc are considered and tested for MRS-VH (Medium resolution stripmap mode and vertical transmit and horizontal receive polarized data set) image data of RISAT-1 satellite. The SAR image is having the standard size of 512*512 pixels. The noise variance of 0.25 is added to the original image and obtained image is processed for despeckling.
The quality parameters like EQNL, SSI, CC, ESI or EPI, MSE and PSNR values are measured for the taken MRS-VH image. The value 11.8, equivalent number of looks obtained in this present method is the best among other existing techniques, which describes the SAR image quality. Comparison of quality factors obtained for various methods is provided in table-1 with corresponding images shown in figure 2. The LEE method has given better EQNL value next to the proposed method. Generally LEE method is very common despeckling method in RADAR image processing softwares.
The value 0.055, speckle suppression index obtained in this present method is the best among other existing techniques, which describes speckle content remaining in the image. This value should be minimum and ideally zero. The correlation coefficient value measures the similarity between the original and despeckled images. Its value generally lies between 0 and 1. Its value should be maximum as much as possible and ideally 1. The value 0.977, correlation coefficient obtained in this present method is the best among other existing techniques, which depicts similarity between original SAR and despeckled images.
The value 0.683, edge saving or preserving index obtained in this present method is the best among other existing techniques, which illustrates the preservation of edges of the image. The despeckled images should contain the edge features that exist the original image. The measuring parameter of the edge preserving is edge saving index. The value 27.51, peak signal to noise ratio obtained in this present method is the best among other existing techniques, which describes quality of the image.
Similarly the quality factors have been evaluated for MRS-HH image, which is having the standard size of 256*256 pixels. The noise variance of 0.1 is added to the original image and obtained image is processed for despeckling. The obtained quality factors are given table-2 and clearly shown in figure 3.
Table 1. Quantitative Comparison of Despeckling Techniques for MRS-HV Image (size=512*512 and variance=0.25)
|
EQNL |
SSI |
EPI |
CC |
PSNR |
|
|
LEE FILTER |
1.79443 |
0.25991 |
0.24561 |
0.62142 |
11.85488 |
|
WAVELET |
0.17824 |
0.68324 |
0.16868 |
0.68436 |
12.48479 |
|
CURVELET |
0.14160 |
0.86171 |
0.39323 |
0.87608 |
18.44182 |
|
PCA |
0.14406 |
0.80361 |
0.50108 |
0.96371 |
21.62268 |
|
BM-3D |
8.55110 |
0.40614 |
0.61196 |
0.91883 |
17.81902 |
|
CS-3D |
9.75436 |
0.06951 |
0.61720 |
0.91902 |
17.81960 |
|
PROPOSED |
11.8540 |
0.05586 |
0.68354 |
0.97700 |
27.51640 |
(i)
(ii)
(iii)
(iv) (v) (vi)
(vii) (viii) (ix)
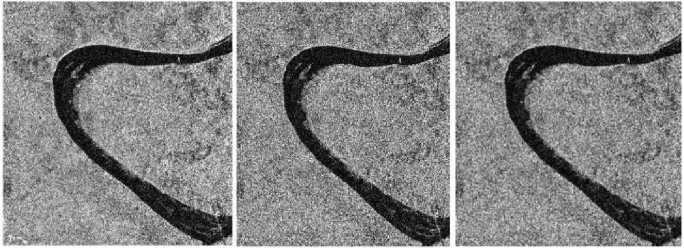
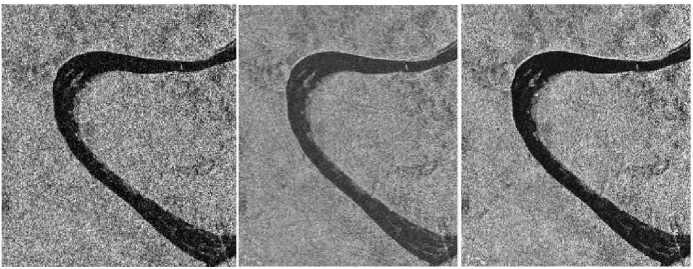
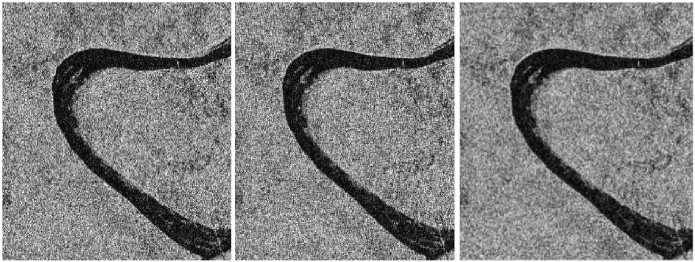
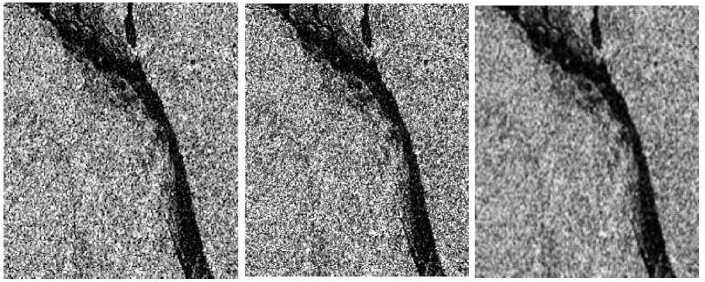
Fig.2. (i) Initial RISAT-1 image (MRS-HV), (ii) Speckle Noisy image, (iii) LEE Despeckled image, (iv) Wavelet despeckled image, (v) Curvelet Despeckled image,(vi) PCA Despeckled image, (vii) BM-3D Despeckled image, (viii) CS-3D Despeckled image and (ix) Proposed despeckled image.
(i)
(ii)
(iii)
(iv) (v) (vi)
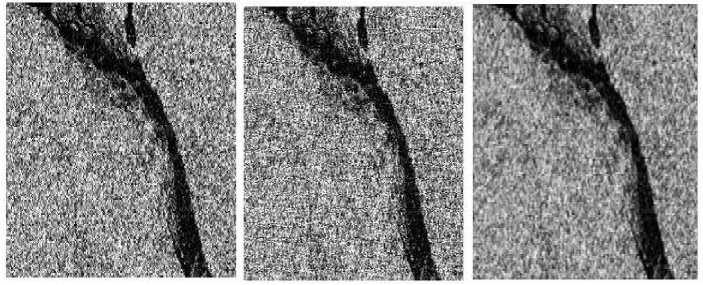
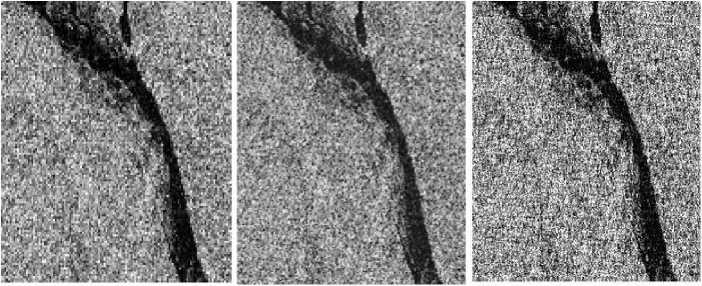
Fig.3. (i) Initial RISAT-1 image (MRS-HH), (ii) Speckle Noisy image, (iii) LEE Despeckled image, (iv) Wavelet despeckled image, (v) Curvelet Despeckled Image, (vi) PCA Despeckled image, (vii) BM-3D Despeckled image, (viii) CS-3D Despeckled image and (ix) Proposed despeckled image.
Table 2. Quantitative Comparison of Despeckling Techniques for MRS-HH Image (size=256*256 and variance=0.1)
|
EQNL |
SSI |
EPI |
CC |
PSNR |
|
|
LEE FILTER |
1.077529 |
0.234594 |
0.271679 |
0.71899 |
13.64129 |
|
WAVELET |
0.137571 |
0.749178 |
0.175743 |
0.749454 |
14.14445 |
|
CURVELET |
0.135499 |
0.975577 |
0.592498 |
0.971982 |
24.09441 |
|
PCA |
0.426229 |
0.687924 |
0.175429 |
0.688187 |
14.26394 |
|
BM-3D |
3.114688 |
0.330706 |
0.602597 |
0.929226 |
19.20398 |
|
CS-3D |
3.497576 |
0.065502 |
0.61333 |
0.924604 |
18.91376 |
|
PROPOSED |
5.152332 |
0.055748 |
0.690656 |
0.979853 |
27.94648 |
-
IV. Conclusion
The proposed and existing methods also are tested on CFRS-RH- 1, CFRS-RV-1, CRS-HH-1, CRS-HV-1, FRS-VH-1, FRS-VV-1, MRS-HH of Anantapur, AndhraPradesh area (MRS-HH-1(1)), MRS-HV of Anantapur (MRS-HV-1(1)), AndhraPradesh area, MRS-HH of Fatehpur (MRS-HH-1(2)), UttarPradesh area and MRS-HV of Fatehpur (MRS-HV-1(2)), UttarPradesh area images of RISAT-1.
The EQNL values of different RISAT-1 imagery have been compared in the figure 4. CRS-HH image and MRS-HH of Fatehpur, Uttar Pradesh are having high EQNL values among all the images, because of less variation of the grey levels in the images. CRS-HV image is having low EQNL values among all the images, because of high variation of the grey levels in the image. The LEE filter has given better results in obtaining of EQNL values except for FRS images.
The SSI values of RISAT-1 imagery have been compared in the figure 6. The SSI plays an important role in the RADAR processing area. The proposed method gave low values among all. The CC values of RISAT-1 imagery have been compared in the figure 6. The correlation values should be near to 1. The proposed method has given good results.
The ESI values of RISAT-1 imagery have been compared in the figure 7. It plays crucial role in judging an algorithm that suits for denoising. If this value is more it gives more clarity in the scene. The proposed method has given good results among all. The existing methods like BM-3D and CS-3D methods have given better results after the proposed method. The PSNR values of RISAT-1 imagery have been compared in the figure 8.
The PSNR value plays a major role in selecting a denoising algorithm in the image processing area. Mean square root values of proposed method are very low, in return the PSNR values are high. The PSNR values of proposed method are very good compared to all other existing techniques. The undecimation plays major role in this method. The sampling conversions are avoided in this method at transmitting and receiving end. This leads to preservation of edge features effectively. The threshold values that are used in hard thresholding process and the blocks that are used block matching 3D technique plays a critical role in this total process.
The proposed method and existing methods have been applied and tested with noise variance values of 0.1, 0.25 and 0.5 for the Terra-SAR image. The quality parameters like ENL, CC, SSI, ESI and PSNR have been calculated with different variances for the same image. Figure 9 shows the comparison of different transform techniques to evaluate ENL value for different variance values like 0.1, 0.25 and 0.5.Our proposed method gave better ENL compared to other methods. But lee method is also giving good ENL. Because of this reason all the softwares are using lee filter for denoising of SAR images.
Figure 10 shows the comparison of different transform techniques to evaluate SSI for different variance values like 0.1, 0.25 and 0.5. Figure 11 shows the comparison of different transform techniques to evaluate CC for different variance values like 0.1, 0.25 and 0.5. Figure 12 shows the comparison of different transform techniques to evaluate ESI for different variance values like 0.1, 0.25 and 0.5. But lee is failed to preserve the edges. Our method gave appreciable value of ESI. This happened because of non sampling of the data. Figure 13 shows the comparison of different transform techniques to evaluate PSNR for different variance values like 0.1, 0.25 and 0.5.
Acknowledgement
The authors would like to thank Indian Space Research Organization (ISRO) and German Aerospace Center for providing Synthetic Aperture Radar data.
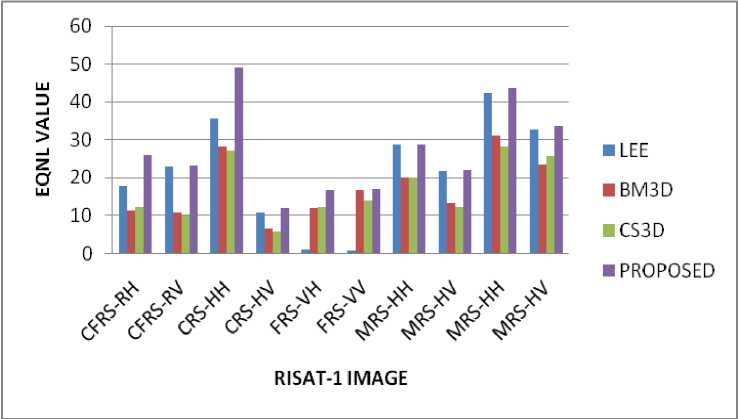
Fig.4. Comparison of EQNL Values for Different RISAT-1 DATA
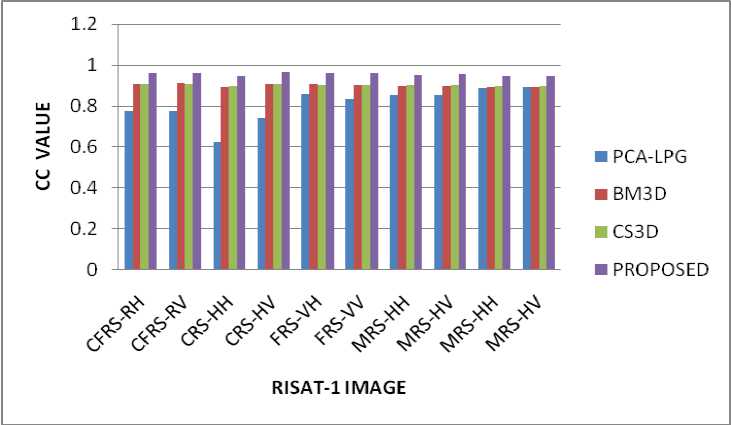
Fig.5. Comparison of CC Values for Different RISAT-1 DATA
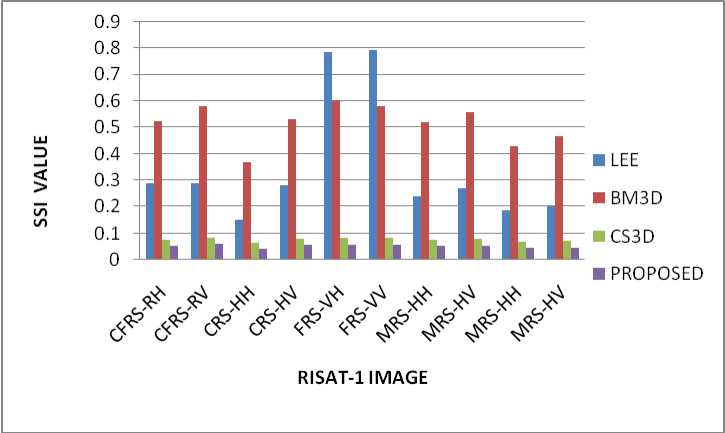
Fig.6. Comparison of SSI Values for Different RISAT-1 DATA
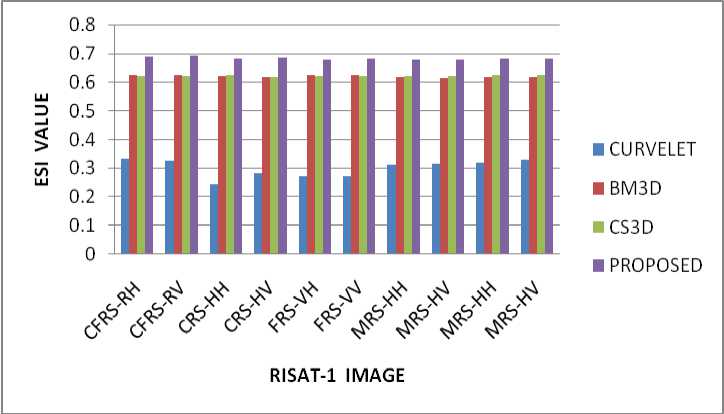
Fig.7. Comparison of ESI Values for Different RISAT-1 DATA
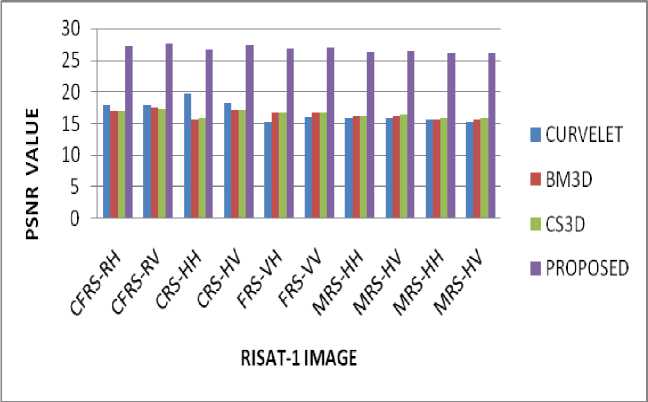
Fig.8. Comparison of PSNR Values for Different RISAT-1 DATA
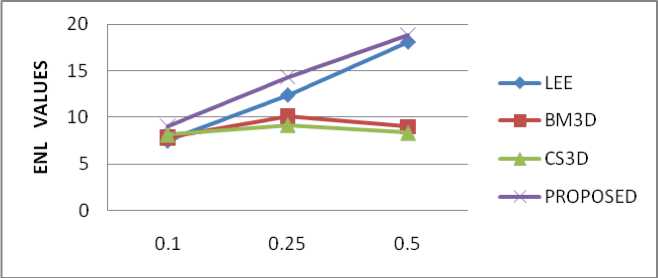
Fig.9. Comparison of ENL Values for TerraSAR-X -VV image with Different Variance Values
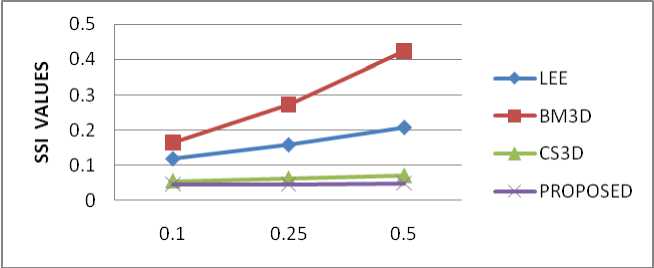
Fig.10. Comparison of SSI Values for TerraSAR-X -VV image with Different Variance Values
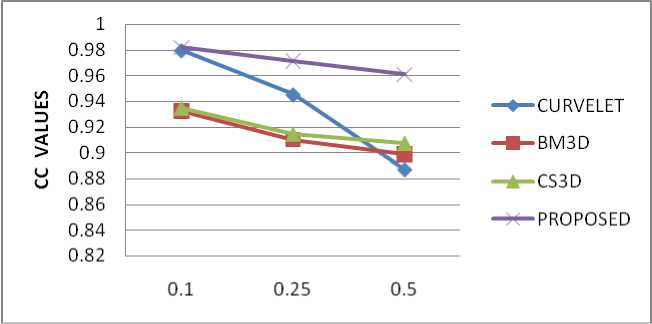
Fig.11. Comparison of CC Values for TerraSAR-X -VV image with Different Variance Values
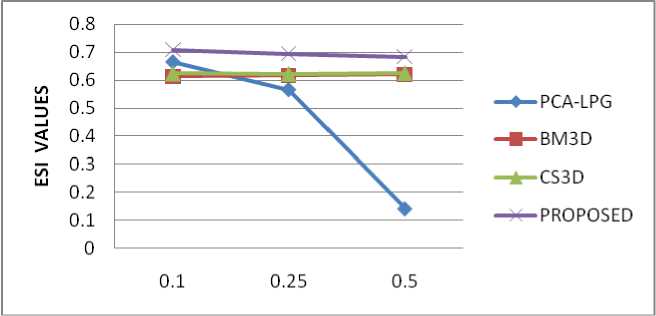
Fig.12. Comparison of ESI Values for TerraSAR-X -VV image with Different Variance Values
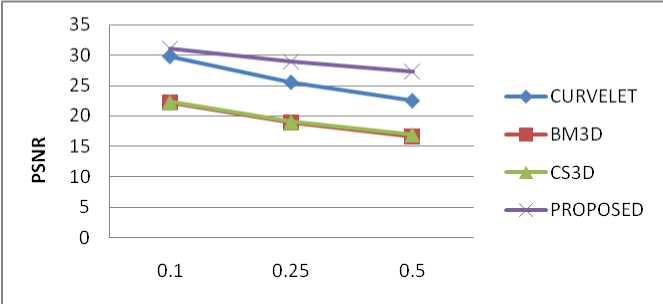
Fig.13. Comparison of PSNR Values for TerraSAR-X -VV image with Different Variance Values
References RISAT-1 Image Despeckling using a Modified Undecimated BM3D Technique
- Lee, J. S. and E. Pottier, Polarimetric Radar Imaging from Basics to Applications, CRC Press, 2009.
- Lee, J. S., L. Jurkevich, P. Dewaele, P. Wambacq, and A. Oosterlinck, Speckle filtering of synthetic aperture radar images: A review," Remote Sensing Reviews, Vol. 8, No. 4, 313-340, 1994.
- Frost, V. S., J. A. Stiles, K. S. Shanmugan, and J. C. Holtzman, A model for radar images and its application to adaptive digital filtering of multiplicative noise," IEEE Transactions on Pattern Analysis and Machine Intelligence, Vol. 4, No. 2, 157- 166, Mar. 1982.
- Lopes.A, Nezry.E, Touzi.R, and Laur.H, "Maximum a posteriori speckle filtering and first order texture models in SAR images," in Proc. IEEE Int. Geosci. Remote Sens. Symp., vol. 3, pp. 2409-2412, 1990.
- Gagnon.L and Jouan.A, "Speckle filtering of SAR images-A comparative study between complex-wavelet-based and standard filters," in Proc.SPIE, pp. 80-91, 1997.
- Argenti.F and Alparone.L, "Speckle removal from SAR images in the undecimated wavelet domain," IEEE Trans. Geosci. Remote Sens., vol. 40, no. 11, pp. 2363-2374, Nov. 2002.
- Zhang.L, Dong.W, Zhang.D, and Shi.G, "Two-stage image denoising by principal component analysis with local pixel grouping," Pattern Recog., vol. 43, no. 4, pp. 1531-1549, Apr. 2010.
- Coupé.P, Hellier.P, Kervrann.C, and Barillot.C, "Bayesian non local means-based speckle filtering," in Proc. 5th IEEE Int. Symp. Biomed. Imaging, pp. 1291-1294, May 2008.
- Dabov.K, Foi.A, Katkovnik.V, and Egiazarian.K, "Image denoising by sparse 3D transform-domain collaborative filtering," IEEE Trans. Image Process., vol. 16, no. 8, pp. 2080-2095, Aug. 2007.
- Parrilli, S., M. Poderico, C. V. Angelino, and L. Verdoliva, A nonlocal SAR image denoising algorithm based on llmmse wavelet shrinkage," IEEE Transactions on Geoscience and Remote Sensing, Vol. 50, No. 2, 606-616, Feb. 2012.
- Goodman.J.W, "Some fundamental properties of speckle," Journal of the Optical Society of America, vol. 66, no. 11, pp. 1145-1150, 1976.
- Lee.J.S, Grunes.M.R, and Mango.S.A, "Speckle reduction in multipolarization, multifrequency SAR imagery," IEEE Transactions on Geoscience and Remote Sensing, vol. 29, no. 4, pp. 535-544, 1991.
- J.S. Lee, M. R. Grunes, D. L. Schuler, E. Pottier, and L. Ferro-Famil, "Scattering-model-based speckle filtering of Polarimetric SAR data," IEEE Transactions on Geoscience and Remote Sensing, vol. 44, no. 1, pp. 176- 187, 2006.
- Chang.S.G, Yu.B, and Vetterli.M, "Spatially adaptive wavelet thresholding with context modeling for image denoising," IEEE Trans. Image Processing, vol. 9, pp. 1522-1531, Sept. 2000.
- Sveinsson.J.R and Benediktsson.J.A, "Speckle reduction and enhancement of SAR images using multi wavelets and adaptive thresholding," in Proc. SPIE Conf. Image and Signal Processing for Remote Sensing V, S. B. Serpico, Ed: EUROPTO Series, vol. 3871, pp. 239-250, 1999.
- MuraliMohanBabu.Y Subramanyam.M.V & Giriprasad.M.N. "PCA based image denoising", Signal & Image Processing: An International Journal (SIPIJ) Vol.3, No.2, 236-244, April 2012.
- Iqbal, M., J. Chen, W. Yang, P. Wang, and B. Sun, "SAR image despeckling by selective 3D filtering of multiple compressive reconstructed images," Progress In Electromagnetics Research, Vol. 134, No. 12, 209-226, 2013.
- MuraliMohanBabu.Y Subramanyam.M.V & Giriprasad.M.N. "Fusion and Texture based Classification of Indian Microwave Data-A Comparative Study", International Journal of Applied Engineering Research, vol 10, 1, 1003-1009, 2015.
- Brown, S., Gillespie, A.J.R., Lugo, A.E., Biomass of tropical forests of south and Southeast Asia. Can. J. For. Res. 21, 111–117, 1991.
- Saraf, A.K., 1999. IRS-1C-LISS-III and PAN data fusion: an approach to improve remote sensing based mapping techniques. International Journal of Remote Sensing 20 (10), 1929–1934.
