Risk Management Strategies for the Use of Cloud Computing

Author: Chiang Ku Fan, Chen-Mei Fan Chiang, Tong Liang Kao
Journal: International Journal of Computer Network and Information Security(IJCNIS) @ijcnis
Article in issue: 12 vol.4, 2012.
Free access
Cloud computing may lead to both cost-efficiency and flexibility, but it also inevitably triggers a certain degree of loss exposure. Unfortunately, there is little objective, scientific research focused on identifying and evaluating the loss exposure that results from cloud computing. In this study, a modified Delphi method and the analytic network process were employed to identify and evaluate risks of cloud computing. This research finds all solutions for "contract or agreements", "cross-cloud compatibility" and "social engineering" can only reduce the risks of recurrence (risk frequency) but not eliminate recurrences. In other words, risk is inevitable, but risks with severe consequences may be heavy burdens. Purchasing insurance, if possible, is also strongly recommended.
Cloud computing, risk management, risk identification, risk evaluation, Delphi method, analytic network process
Short address: https://sciup.org/15011145
IDR: 15011145
Text of the scientific article Risk Management Strategies for the Use of Cloud Computing
Published Online November 2012 in MECS (http://www. DOI: 10.5815/ijcnis.2012.12.05
Cloud computing has revolutionized the architecture of computer systems. Enterprises can lower costs, save energy, and automatically upgrade their systems by replacing traditional computer systems and facilities with cloud computing services. Because of its increasing popularity, cloud computing is surely the future of information technology. Eventually, cloud computing will provide the basic levels of computing services that are considered essential to meet the everyday needs of the general community, similar to water, gas, telephone, and electrical utilities [1].
Nevertheless, certain concerns exist regarding cloud computing and its related services. For example, the International Data Corporation (IDC) reported that 30% of respondents wanted data security and “24 hours a day, 7 days a week” support from their cloud providers. Cloud users are also deeply concerned about the reliability, security, availability, privacy, performance, and management of service-level software agreements. Chief information security officers (CISOs) have raised particular concerns about the lack of standards, software as a service (SaaS), and secure Internet access for cloud computing. The absence of standards means that companies cannot back up their data to other cloud service providers, making it difficult to deal with service outages from cloud providers [2, 3].
Cloud computing may lead to both cost-efficiency and flexibility, but it also inevitably triggers a certain degree of loss exposure. Unfortunately, there is little objective, scientific research focused on identifying and evaluating the loss exposure that results from cloud computing. Insurers and enterprises have limited information to aid them in creating an appropriate risk management program. This study has the following objectives:
-
1. Identify the loss exposure attributable to cloud computing services using scientific and objective methods;
-
2. Measure and analyze loss exposure from cloud computing;
-
3. Provide administrators with the information necessary to make risk management decisions with regard to cloud computing;
-
4. Provide support for management's authorization of cloud computing based on objective, scientific, risk-focused assessments; and
-
5. Propose essential risk management strategies to control or reduce losses attributable to cloud computing.
The remainder of this paper is organized as follows. Section II reviews related studies about risk assessment, risk management matrix, and risks of cloud computing services. Section III describes the experimental methodology. Experimental results are present in Section IV. Finally, the conclusions and implications are provided in Section V.
II. LITERATURE REVIEW
A. Risk Assessment and Plotting the Risk Management Matrix
High (10)
Probabilit
Low (1)
Loss Prevention
(5,5)
Retention
Low (1)
Avoidance
Transfer or Insurance
Consequence
High (10)
Figure 1. Risk Management Matrix
To determine the appropriate technique or techniques for handling losses, a matrix (see Figure 1) may be helpful to identify different types of loss exposure according to the frequency and severity of risks [4].
There is a widespread belief that the qualitative ranking provided by matrices reflects an underlying quantitative ranking. However, risk management matrices are constructed in an intuitive, often arbitrary, manner. Unfortunately, it is impossible to maintain perfect correspondence between qualitative matrices and quantitative rankings [5], because it is not possible to represent quantitative rankings accurately on a rectangular grid [6]. Moreover, severity cannot be assessed objectively for uncertain outcomes. Risk matrix inputs (e.g., frequency and severity classifications) and their resulting outputs (e.g., risk ratings) require subjective interpretation, and different users may offer inconsistent ratings for the same quantitative risks. Therefore, the development of an appropriate risk assessment approach may enable risk managers to plot risks on matrices in a more logical manner. Fortunately, several studies provide a frame of reference for dealing with common problems related to quantitative risk assessment [7, 8, 9, 10]. The common approach of these studies is to employ relative severity and frequency to assess risks, while utilizing information about the severity and frequency of risks from the literature and feedback from experts. In this study, an appropriate technique for the assessment of loss exposure is selected according to this approach.
-
B. Risks of Cloud Computing Services
In a traditional model of on-premises application deployment, the sensitive data of each enterprise resides within the enterprise itself and is subject to its physical, logistical, and personnel security control policies [11]. However, in most cloud computing service models, enterprise data are stored externally. Because malicious users can exploit weaknesses in the data security model to gain unauthorized access to data, cloud computing vendors are urged to adopt additional security measures to prevent breaches. In other words, the use of cloud computing services implies system vulnerability associated with malicious employees [12]. Unfortunately, not all security breaches in cloud computing are caused by cloud service providers. Employees’ mistakes may also result in security breaches [13]. One example is the use of weak security passwords or a standard company default password to log on to a network or e-mail platform [12, 13].
Enterprises that use a cloud computing service may also have legal problems related to privacy, jurisdiction, and agreement or contract risks. The cloud infrastructure must address challenges beyond the traditional issues of remote access, data transfer, and intrusion detection and control through constant system monitoring [14]. Cloud computing unique schema for physical data storage may sufficiently store the data of multiple clients on one physical device. This shared physical server model requires the vendor to ensure that each customer’s data are kept separate, so that no data bleeding occurs across virtual servers [15]. Furthermore, enterprises and individuals interested in using cloud computing services must be aware of the privacy risks associated with their use and take these risks into account when deciding to use cloud computing services [16]. In many cases, vendor servers span multiple countries with different compliance and data privacy laws, making it unclear which legal entity has jurisdiction over the data [11, 14]. Cloud computing also raises potential legal issues between cloud users and cloud providers [15, 17]. The apportionment of liability in a cloud service contract may be unclear, or a user may get locked into a contractual arrangement that does not cater to the user’s needs.
Cross-cloud compatibility is another risk that enterprises face when using a cloud computing service. An online storage service called “The Linkup” shut down on August 8, 2008, after losing access to as much as 45% of customer data. The Linkup’s 20,000 users were told that the service was no longer available and were urged to use another storage site. Developing a new generalized usage model in which the same software infrastructure can be used across cloud service systems would mitigate these data lock-in concerns. Therefore, before developing interoperability technology and improving the portability of data and resources between different parts of the cloud, cloud computing services should first address the risk of cross-cloud compatibility because it creates significant uncertainty that will impact the efficiency of using a cloud computing service [14].
-
III. METHODOLOGY
In this study, the estimation model is built in three phases (see Figure 2).
In the first phase, the risks of applying cloud computing and a hierarchical structure of risks are evaluated, identified, and developed using a modified Delphi method. In the second phase, the relative weights of the risk frequency and severity are used as the evaluation criteria and are calculated by employing the analytic network process (ANP). In the third phase, measures to mitigate the risks of cloud computing are proposed by using a frequency and severity matrix. The ANP adopted in this study is described as follows.
-
A. Participants and sampling
The sample (N = 7) was selected using a purposive sampling technique and included the same respondents from the Delphi study.
-
B. Instrumentation
The two ANP questionnaires covering the evaluation of risk frequency and severity were developed based on the results of the Delphi study. Based on the risk frequency and severity of the upper hierarchy, which serves as an evaluation standard, a pairwise comparison is performed for each risk. Although n risks are assumed, n(n-1)/2 risks of the pairwise comparison are derived while assessing the relative weights of risk frequency or severity. The respondents were asked to rate the relative frequency or severity of two identified risks using a scale with the values 1, 3, 5, 7, and 9, where 1 refers to “equal frequency or severity,” 3 denotes “slightly more frequency or severity,” 5 equals “strongly more frequency or severity,” 7 represents “demonstrably more frequency or severity”, and 9 denotes “absolutely more frequency or severity.”
-
C. Procedures
The ANP questionnaires were e-mailed to seven experts with an enclosed cover letter. The cover letter emphasized that participation in this study was completely voluntary and responses would be kept confidential. To increase the response rate, phone calls were made to the experts to remind them to complete the questionnaires within two weeks.
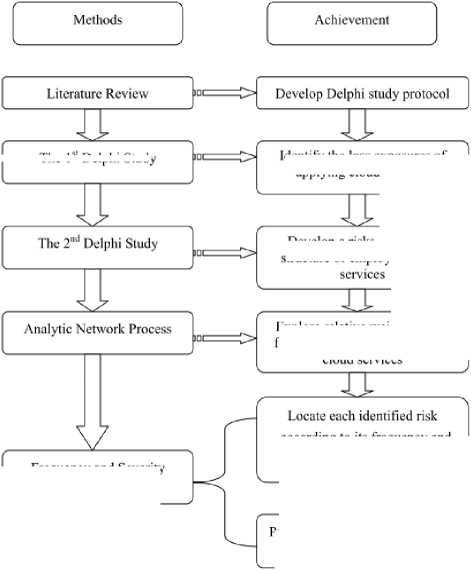
The Is' Delphi Study
Develop a risks evaluation structure of employing cloud according to its frequency and severity in the matrix
Propose an appropriate treatment to each identified risk
Frequency and Severity Matrix
Figure 2. Theoretical Approach Adopted in This Study
Identity the loss exposures ot applying cloud services
Explore relative weighs of risk frequency and severity in using cloud services

-
D. Data analysis
The ANP is a comprehensive decision-making technique that captures the outcome of the dependence and feedback within and between clusters of elements [18]. The ANP consists of two parts; the first part contains a control hierarchy or network of criteria and sub-criteria that controls the interactions, and the second part is a network of influences among the elements and clusters. The ANP uses a network without specifying the levels in a hierarchy. The main reason for choosing the ANP to assess the relative risk frequency and severity of cloud services is its suitability in offering solutions in a complex multi-criteria decision-making environment. Moreover, in accordance with suggestions made by Cox [6], the ANP is an appropriate assessment approach to evaluate relative risk frequency and severity so that risk managers can plot risks on matrices in a more logical manner.
The ANP consists of four major steps [18], described as follows.
Step 1: Model construction and problem structuring
The problem should be stated clearly and decomposed into a rational system that resembles a network. The problem structure can be obtained using the opinion of decision-makers through brainstorming or other appropriate methods.
Step 2: Pairwise comparisons matrices and priority vectors
In the ANP, pairwise comparisons are made between decision elements for each component based on their importance with regard to their control criterion, and pairwise comparisons are also made between the components themselves with respect to their contribution to the goal. Decision-makers are asked to respond to a series of pair-wise comparisons in which two elements or components are compared simultaneously in terms of how they contribute to their particular upper-level criteria. In addition, if there are interdependencies among elements of a component, pair-wise comparisons also need to be created, and an eigenvector can be obtained for each element to show the influence of other elements on it. The relative importance values are based on a scale that ranges from 1 to 9, where a score of 1 represents equal importance between the two elements and a score of 9 indicates greater importance of one element (row component in the matrix) compared with another element (column component in the matrix). A reciprocal value is assigned to the inverse comparison: a.. = 1/ q.. , where a ( a ) denotes the importance of the i th ( j th) element compared with the j th ( i th) element. The pairwise comparison in the ANP is made using the framework of a matrix, and a local priority vector can be derived as an estimate of relative importance associated with the elements (or components) being compared by solving the following formula:
A • w = ^mex • w, (1)
where A is the matrix of pair-wise comparisons, w is the eigenvector, and Л is the largest eigenvalue of A. Saaty proposes several algorithms for approximating w . In this paper, the following three-step procedure is used to synthesize priorities [19].
-
(a) Sum the values in each column of the pair-wise comparison matrix.
-
(b) Divide each element in a column by the sum of its respective column. The resulting matrix is referred to as the normalized pair-wise comparison matrix.
-
(c) Sum the elements in each row of the normalized pair-wise comparison matrix, and divide the sum by n elements in the row. These final numbers provide an estimate of the relative priorities for the elements being compared with respect to its upper-
- level criterion. Priority vectors must be derived for all of the comparison matrices.
Step 3: Super-matrix formation
The super-matrix concept is similar to a Markov chain process [18]. To obtain global priorities in a system with interdependent influences, the local priority vectors are entered in the appropriate columns of a matrix, known as a super-matrix. As a result, a super-matrix is actually a partitioned matrix, where each matrix segment represents a relationship between two nodes (components or clusters) in a system. Let the components of a decision system be C , k = 1,...,n , and each component k has m elements, denoted by . The local priority k1 , k , , kmk vectors obtained in Step 2 are grouped and located in the appropriate positions in a super-matrix based on the flow of influence from one component to another component, or from a component to itself as in a loop. A standard form of a super-matrix is presented in formula (2) [18] .
C 1 C k C n
For example, the super-matrix representation of a hierarchy with three levels is as follows [18]:
|
■ 0 |
0 |
0 |
|
|
W h = |
w 21 |
0 |
0 |
|
. 0 |
w 32 |
I |
where W is a vector that represents the impact of the goal on the criteria, W is a matrix that represents the impact of criteria on each of the alternatives, I is the identity matrix, and the zeros correspond to those elements that have no influence.
With regard to the above example, if the criteria are interrelated, the hierarchy is replaced by a network. The (2, 2) entry of W given by W would indicate interdependency, and the super-matrix would be [18]
|
" о |
0 |
0 |
|
|
W n = |
w 21 |
w 22 |
0 |
|
_ о |
w 32 |
I |
Note that any zero in the super-matrix can be replaced by a matrix if there is an interrelationship between the elements in a component or between two components. Because there usually is interdependence among clusters in a network, the columns of a super-matrix usually sum to more than one. The super-matrix must be transformed to make it stochastic; that is, each column of the matrix must sum to unity. A recommended approach by Saaty is to determine the relative importance of the clusters in the super-matrix with the column cluster (block) as the controlling component [19]. That is, the row components with non-zero entries for their blocks in that column block are compared according to their impact on the component of that column block [19]. With pair-wise comparison of the row components with respect to the column component, an eigenvector can be obtained. This process generates an eigenvector for each column block. For each column block, the first entry of the respective eigenvector is multiplied by all of the elements in the first block of that column, the second by all of the elements in the second block of that column, and so on. In this way, the block in each column of the super-matrix is weighted, and the result is known as the weighted super-matrix, which is stochastic.
Raising a matrix to powers generates the long-term, relative influences of the elements on one another. To achieve convergence on the importance weights, the weighted super-matrix is raised to the power of 2 k + 1, where k is an arbitrarily large number, and this new matrix is called the limit super-matrix [19]. The limit super-matrix has the same form as the weighted supermatrix, except that all of the columns of the limit supermatrix are the same. By normalizing each block of this super-matrix, the final priorities of all of the elements in the matrix can be obtained.
-
IV. RESULTS
To identify the risks of applying cloud services and develop an evaluation structure for identified risks’ frequency and severity, this study first used a purposive sampling technique to find participants for the Delphi study. This purposive sampling is applied to seven experts who match the characteristics shown in Table 1.
Table 1. Experts’ Backgrounds
|
Expert |
Employer |
Years of Working Experience in Information Technology |
Title |
|
NO. 1 |
Model company A |
12 |
Vice President. |
|
NO. 2 |
Model company В |
18 |
С. E. 0. |
|
NO. 3 |
Model company C |
14 |
Senior Manager |
|
NO. 4 |
Model company D |
11 |
Vice Assistant President |
|
NO. 5 |
Model company E |
10 |
Senior Manager |
|
NO. 6 |
Model company F |
12 |
Vice President |
|
NO.7 |
Model company G |
10 |
Senior Engineer |
-
A. Results from the First Delphi Study
The aim of the first Delphi study was to identify the risks of using cloud services. The Delphi respondents answered the interview questions and rated their level of agreement with risks, ranging from strongly agree (5) to strongly disagree (1). The interview protocol was developed based on a literature review. The interview more fully explored the perceptions of the experts regarding the risks of using cloud services. These qualitative responses helped explain quantitative responses to the standardized questions and qualitative themes that were representative of opinions expressed by a large majority of the Delphi respondents.
Descriptive statistics about the respondents’ attitudes toward each risk are listed in Table 2. In the final round, seven Delphi respondents strongly agreed that “Privacy,” “Agreement or contract,” “Damaged or spoiled by employees intentionally or accidentally,” “Natural disaster,” “Social engineering,” “Mistakes made by employees intentionally or accidentally,” “Cross-cloud compatibility,” and “Normal wear and tear or malfunction” were risks of using cloud services. Moreover, six Delphi respondents strongly agreed that “Jurisdiction,” “Burglary,” and “System vulnerability” were risks of using cloud services. No respondents said they were undecided, disagreed, or strongly disagreed that these factors were risks faced by users of cloud services in round 3.
Table 2. Descriptive Statistics for Attitudes toward Each Risk in Interview Rounds 2 and 3
________ Attitude toward Risks ________
Risks SA A UD D SD
R2 R3 R2 R3 R2 R3 R2 R3 R2 R3
|
Privacy |
6 |
7 |
0 |
0 |
fl |
0 |
0 |
0 |
0 |
0 |
|
Agreement or contract |
6 |
7 |
0 |
0 |
0 |
0 |
0 |
0 |
0 |
0 |
|
Jurisdiction |
5 |
6 |
1 |
1 |
1 |
0 |
0 |
0 |
0 |
0 |
|
Damaged or spoiled by employees intentionally or accidentally |
6 |
7 |
0 |
0 |
0 |
0 |
0 |
0 |
0 |
|
|
Burglary |
5 |
6 |
■ |
1 |
1 |
0 |
0 |
II |
0 |
0 |
|
Normal wear and tear or malfunction |
6 |
7 |
1 |
0 |
0 |
0 |
0 |
0 |
0 |
|
|
Natural disaster |
7 |
7 |
0 |
0 |
fl |
0 |
0 |
0 |
0 |
0 |
|
System vulnerability |
5 |
6 |
1 |
1 |
0 |
0 |
0 |
0 |
0 |
|
|
Social engineering |
5 |
7 |
2 |
0 |
0 |
0 |
0 |
0 |
0 |
0 |
|
Mistakes made by employees intentionally or accidentally |
7 |
7 |
0 |
0 |
0 |
ft |
0 |
0 |
0 |
fl |
|
Cross-cloud compatibility |
6 |
7 |
1 |
0 |
0 |
9 |
0 |
0 |
0 |
•Five Attitudes toward Key Success Factors: Strongly Agree (SA). Agree (A) Undecided (UD). Disagree (D), and Strongly Disagree (SD)
Based on the results of a Kendall’s Coefficient of Concordance Test, there were no significant attitude differences toward each risk among the seven Delphi experts. Thus, the 11 items proposed by this study should be identified as risks associated with the use of cloud services.
-
B. Results from the Second Delphi Study
The aim of the second Delphi study was to develop a network evaluation structure to calculate the relative frequency and severity of each identified risk associated with cloud services.
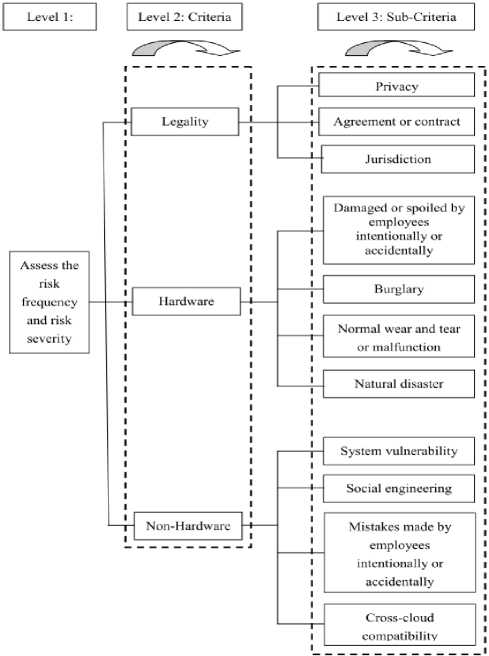
Figure 3. Hierarchy Structure to Assess the risk frequency and Severity
The Delphi respondents were asked to justify their answers to interview questions and to rate their level of agreement with the network evaluation structure developed by this research. Seven experts agreed on this evaluation structure in the second round of interviews based on the results of the Kendall’s Coefficient of Concordance Test, and no significant differences in attitudes toward the network evaluation structure were found among the seven Delphi experts. Therefore, no further interviews were deemed necessary. Accordingly, the network evaluation structure suggested by this study was identified as a suitable model to evaluate the relative frequency and severity of each identified risk of using cloud services.
In the Delphi study, the risks of using cloud services were derived from the experts’ opinions. The relative frequency and severity of the identified risks can be assessed based on three evaluation criteria and eleven evaluation sub-criteria (see Figure 3).
-
C. The Relative Weight of Each Identified Risk’s
4
0.75232
,
Severity
The ANP questionnaire was developed based on the results from the second Delphi study and was distributed to seven experts, all of whom were Delphi respondents. Following data collection, the relative weights for risk frequency and severity were obtained from the ANP process.
LegalityW 21 = HardwareNon — Hardware
' 0.20142 A 0.04626
Table 5. Interdependence Matrix of Criteria W22 of Risk Severity
|
Legality |
Hardware |
Non-Hardware |
|
|
Legality |
0.13565 |
0.00000 |
0.48554 |
|
1 lardware |
0.72214 |
0.00000 |
0.00000 |
|
Non-Hardware |
0.14221 |
0.00000 |
0.51446 |
Table 3. Pair-wise Comparison Matrix for Level 2 Risk Severity
|
Legality |
Hardware |
Non-Hardware |
|
|
Legality |
1.0000 |
8.1357 |
0.1433 |
|
Hardware |
0.1229 |
1.0000 |
0.1149 |
|
Non-Hardware |
6.9794 |
8.7032 |
1.0000 |
Table 4. Eigenvectors (Weights) for Level 2 and Level 3 Risk Severity
|
Criteria |
Criteria Weights |
Sub-Criteria |
Sub-Criteria Weights |
|
Privacy |
0.46869 |
||
|
Legality |
0.20141 |
Agreement or contract |
0.44233 |
|
Jurisdiction |
0.08898 |
||
|
Damaged or spoiled by employees intentionally or accidentally |
0.10411 |
||
|
Hardware |
0.04626 |
Burglary |
0.35657 |
|
Normal wear and tear or malfunction |
0.32515 |
||
|
Natural disaster |
0.21417 |
||
|
System vulnerability |
0.37349 |
||
|
Non-Hardware |
0.75232 |
Social engineering |
0.14448 |
|
Mistakes made by employees intentionally or accidentally |
0.33056 |
||
|
Cross-cloud compatibility |
0.15147 |
The weights of the three evaluative criteria are Legality (0.20142), Hardware (0.04626), and Non-Hardware (0.75232). The eigenvectors for Legality ( W 32 (C ) ), Hardware ( W 32 (C ) ), and Non-Hardware ( W 32 (C ) ) are organized into a matrix, W 32 , which represents the relative importance of the sub-criteria with respect to their upper-level criteria (see Tables 3 and 4).
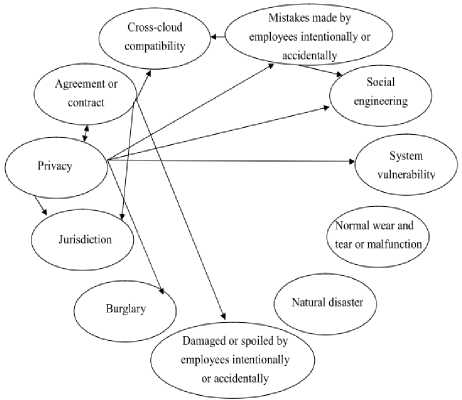
Figure 5. Inner Dependence among Sub-Criteria
Privacy
Agreement or contract Jurisdiction
Damaged or spoiled by employees intentionally or accidental
Burglary
Normal wear and tear or malfunction
Natural disaster
System vulnerability
Social engineering
Mistakes made by employees Intentionally or Accidentally
Cross-cloud compatibility
Legality Hardware
Hardware f0.46869
0.44233
0.08898
0.10411
0.35657
0.32515
0.21417
0.37349
0.14448
0.33056
0.15147 ,
The interdependency among the criteria and the subcriteria is W 22 and W 33, respectively (see Figure 4, Figure 5, Table 5, and Table 6).
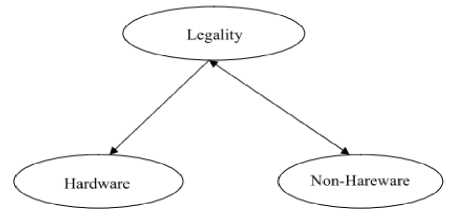
Figure 4. Inner Dependence among Criteria
Sub —
Goal Criteria Criteria
Goal f I A criteria W21 W22
Sub — Criteria ^ W 32 W 33 ^
Figure 6. Generalized super-matrix
As indicated by the dotted bracket in Figure 3, the super-matrix in this paper comprises all of the elements in the network. The generalized form of the super-matrix is shown in Figure 6.
Table 6. Inner Dependence Matrix of Criteria, W33
Privacy 0.10557 0.10557 0.00000 0.00000 0.00000
Agreement or contract 0.11686 0.11686 0.00000 0.00000 0.00000 Jurisdiction 0.05314 0.05314 0.00000 0.00000 0.00000 Damaged or spoiled by employees intention 0.18280 0.18280 0.00000 0.00000 0.00000 or accidental
Burglar 0.06442 0.06442 0.00000 0.00000 0.00000 огЗмоп ^ ^ 0 00000 °-00000 °"W 0Ш№ °-00000 Natural disaster 0.00000 0.00000 0.00000 0.00000 0.00000 System vulnerability 0.10779 0.10779 0.00000 0.00000 0.00000 Social engineering 0.15102 0.15102 0.00000 0.00000 0.00000 Mistakes made by
Employees intentionally 0.07754 0.07754 0.00000 0.00000 0.00000 or accidentally c™“ 0J187 o^os? oe oe a(ro
о.ш o.«m сдаю о» 0.10557 0,00000
0.00000 0.00000 0.W 0.00000 0.11686 0.00000
0.00000 0.00000 0.00000 0.00000 0.05314 0.00000
0.00000 0.00000 0.00000 0.00000 0.18280 0.00000
0O0 0.00000 0.00000 0.00000 0.06442 0,00000
0.00000 0.00000 0.00000 0.00000 0.00000 0.00000
0.00(00 0.00000 0.00000 0.000(0 0.00000 0.00000
0.00000 0.00070 0.00000 0.00000 0.10775 0.00000
0.00000 0.00000 0.00000 0.00000 0.15102 0.КШ1
0.00000 0.00000 0.00000 0.00000 0.07754 0.Ю000
0.00000 0.00070 0.00000 0.00000 0.1-1087 0«
The report of the synthesized results from the supermatrix (severity) is presented in Table 7. The criteria ranking is Hardware (0.35103) > Non-Hardware
(0.33350) > Legality (0.31547). In addition, the subcriteria ranking is: Damaged or spoiled intentionally or accidentally by employees (0.16961) > Social engineering (0.14277) > Cross-cloud compatibility (0.13297) > Agreement or contract (0.11624) > System vulnerability (0.10663) > Privacy (0.10547) > Mistakes made by employees intentionally or accidentally (0.07788) > Burglary (0.06221) > Jurisdiction (0.05058) > Normal wear and tear or malfunction (0.01977) > Natural disaster (0.01587).
Table 7. The Synthesized Results from the Super-Matrix (Severity)
|
Node Name |
Limiting Normalized by Cluster |
|
Legality |
0.31547 |
|
Hardware |
0.35103 |
|
Non-hardware |
0.33350 |
|
Privacy |
0.10547 |
|
Agreement or contract |
0.11624 |
|
Jurisdiction |
0.05058 |
|
Damaged or spoiled by employees intentionally or accidentally |
0.16961 |
|
Burglary |
0.06221 |
|
Normal wear and tear or malfunction |
0.01977 |
|
Natural disaster |
0.01587 |
|
System vulnerability |
0.10663 |
|
Social engineering |
0.14277 |
|
Mistakes made by employees intentionally or accidentally |
0.07788 |
|
Cross-cloud compatibility |
0.13297 |
-
D. The Relative Weight of Each Identified Risk’s Frequency
The relative weight for each identified risk’s frequency, presented in Table 8, was obtained by repeating the same evaluation procedures as in the previous section. The synthesized results from the super-matrix (frequency) are also presented in Table 10. The criteria ranking is Hardware (0.35463) > Non-Hardware (0.32843) > Legality (0.31694). Furthermore, the sub-criteria ranking is Cross-cloud compatibility (0.24513) > Social engineering (0.16244) > Agreement or contract (0.13074) > Mistakes made by employees intentionally or accidentally (0.07775) > Jurisdiction (0.07520) > Damaged or spoiled intentionally or accidentally by employees (0.07209) > Burglary (0.06035) > Privacy (0.05223) > Natural disaster (0.04429) > Normal wear and tear or malfunction (0.04320) > System vulnerability (0.03649).
Table 8. The Synthesized Results from the Super-Matrix (Frequency)
|
Node Name |
Limiting Normalized by Chisler |
|
Legality |
0.31694 |
|
Hardware |
0.35463 |
|
Non-hardware |
0.32843 |
|
Privacy |
0.05233 |
|
Agreement or contract |
0.13074 |
|
Jurisdiction |
0.07520 |
|
Damaged or spoiled by employees intentionally or accidentally |
0.07209 |
|
Burglary |
0.06035 |
|
Normal wear and tear or malfunction |
0.04320 |
|
Natural disaster |
0.04429 |
|
System vulnerability |
0.03649 |
|
Social engineering |
0.16244 |
|
Mistakes made by employees intentionally or accidentally |
0.07775 |
|
Cross-cloud compatibility |
0.24513 |
-
E. The Relative Weights of Severity and Frequency of Each Identified Risk
The relative weights of severity and frequency for each identified risk are presented in Table 9.
Table 9. The Relative Weights of Severity and Frequency for Each Identified Risk
|
Identified Risk |
Severity |
Frequency |
Location |
|
Privacy |
0.10547 |
0.05233 |
IV |
|
Agreement or contract |
0.11624 |
0.13074 |
1 |
|
Jurisdiction |
0.05058 |
0.07520 |
ill |
|
Damaged or spoiled by employees Intentionally or Accidentally |
0.16961 |
0.07209 |
IV |
|
Burglary |
0.06221 |
0.06035 |
ill |
|
Normal wear and tear or tnalfnnclicn |
0.01977 |
0.04320 |
ill |
|
Natural disaster |
0.01587 |
0.04429 |
ill |
|
System vulnerability |
0.10663 |
0.03649 |
IV |
|
Social engineering |
0.14277 |
0.16244 |
1 |
|
Mistakes made by employees intentionally or accidentally |
0.07788 |
0.07775 |
1 |
|
Cross-doud compatibility |
0.13297 |
0.24513 |
1 |
|
Geometric mean |
0.07321 |
0.07593 |
Origin |
-
F. The Customized Risk Management Matrix
The risk management matrix gives risk managers an overview of the relationship between risk factors and the frequency and severity of risks so that risk managers can develop strategies to mitigate risks. This study places frequency on the Y axis and severity on the X axis. The point where the two axes intersect is called the origin. The origin consists of two variables that are defined as the geometric means of risks’ relative frequencies and relative severities assessed in the ANP (see Table 9).
Figure 7 shows that the risks of Agreement or contract, Social engineering, Mistakes made by employees intentionally or accidentally, and Cross-cloud compatibility are located in quadrant (I) because they are rated highly on severity and frequency.
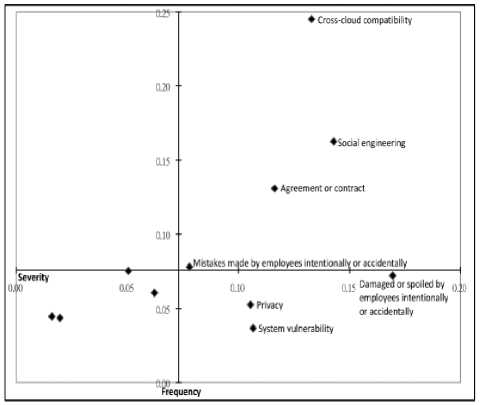
Figure 7. Risk Management Matrix
No risks are present in quadrant (II). The risks of Jurisdiction, Burglary, Normal wear and tear or malfunction, and Natural disaster are located in quadrant (III) because they are rated lower on severity and frequency. The risks of Privacy, Damaged or spoiled by employees intentionally or accidentally, and System vulnerability fall into quadrant (IV) because they are perceived as being more severe risks that occur at lower frequencies.
-
V. CONCLUSIONS AND IMPLICATIONS
Loss exposure attributable to Jurisdiction, Burglary, Natural disaster, Normal wear and tear or malfunctions located in quadrant III are characterized by high frequency but relatively low severity. Loss prevention should be used here to minimize the frequency of losses. Moreover, if losses occur regularly and are predictable, a retention technique, such as self-funding, is recommended.
Loss exposures attributable to Privacy, Damaged or spoiled by employees intentionally or accidentally, and System vulnerability can be addressed through insurance. Insurance is not only most appropriate for mitigating these risks but also economically feasible for risks that seldom occur but result in severe losses. It is recommended that risk managers also adopt a combination of insurance and retention techniques to mitigate these risk exposures.
Risks generated through Agreement or contract, Social engineering, Mistakes made by employees intentionally or accidentally, and Cross-cloud compatibility located in quadrant I are characterized by both high frequency and severity. This type of exposure is best handled by avoidance. But as a practical matter, not all risks can or even should be avoided. Therefore, to mitigate legal risks involving contracts or agreements, it is necessary to hire a contract lawyer to review agreements and help companies solve issues related to breaches of contract or disputes over agreements. To minimize the risk of cross-cloud compatibility, a company can propose a cross-cloud application management platform to administrate applications among heterogeneous clouds to control the application’s compatibility so that applications can run under heterogeneous cloud platforms. Although protecting against reverse social engineering is probably the most difficult challenge, it is recommended that risk managers design a defense against social engineering threats for the staff in a company. To reduce the risks of mistakes made by employees, it is important to provide more effective, task-related training to involved employees. However, all of the above solutions can only reduce the risks of recurrence (risk frequency) but not eliminate recurrences. In other words, risk is inevitable, but risks with severe consequences may be heavy burdens. Purchasing insurance, if possible, is also strongly recommended.
ACKNOWLEDGEMENTS: The author gratefully acknowledges the financial support from the National Science Council, Taiwan (NSC101-2410-H-158-011)
References Risk Management Strategies for the Use of Cloud Computing
- Buyya R. and Parashar M. User requirements for cloud computing architecture, Proc. 10th IEEE/ACM International Conference on Cluster, Cloud and Grid Computing, Melbourne, Australia, 17-20 May 2010, pp. 625-630.
- Ahmed Sultan, N. Reaching for the cloud: How SMEs can manage, International Journal of Information Management, 2011. 31: p. 272-278.
- Chow, R., Golle, P., Jakobsson, M. Controlling data in the cloud: Outsourcing computation without outsourcing control', Fujitsu Laboratories of America, Chicago: Illinois, 2009.
- Rejda, G. E. Principles of risk management and insurance. 11th Edition, New Jersey: Prentice Hall, 2011.
- Awati, K. Cox's risk matrix theorem and its implications for project risk management, from http://eight2late.wordpress.com/2009/07/01/cox%E2%80%99s-risk-matrix-theorem-and-its-implications-for-project-risk-management/, accessed 18 Dec 2011.
- Cox, L. A. What's wrong with risk matrices? Risk Analysis, 2008. 28(2): p. 497-515.
- Lim, S. H. Risks in the North Korean special economic zone: context, identification, and assessment. Emerging Markets Finance & Trade, 2011. 47(1): p. 50-66.
- Picado, F., Barmen, G., Bengtsson, G. Cuadra, S., Jakobsson, K., and Mendoza, A. Ecological, groundwater, and human health risk assessment in a mining region of Nicaragua. Risk Analysis: An International Journal, 2010. 30(6): p. 916-933.
- Pintar, K. D. M., Charron, D. F., Fazil, A., McEwen, S. A., Pollari, F., Waltner-Toews, D. (2010) A risk assessment model to evaluate the role of fecal contamination in recreational water on the incidence of Cryptosporidiosis at the community level in Ontario. Risk Analysis: An International Journal, Jan2010. 30(1): p. 49-64.
- Aven, T. and Renn, O. The role of quantitative risk assessments for characterizing risk and uncertainty and delineating appropriate risk management options, with special emphasis on terrorism risk. Risk Analysis: An International Journal. 2009. 29(4): p. 587-600.
- Subashini, S. and Kavitha, V. A survey on security issues in service delivery models of cloud computing. Journal of Network and Computer Applications, 2011. 34:p. 1-11.
- Casale, J. Social networking, cloud computing bring new risk exposures. Business Insurance, 2010. 44(38):p. 17.
- Bublitz, E. (2010). Catching The Cloud: Managing Risk When Utilizing Cloud Computing. National Underwriter P & C, 2010. 114(39):p. 12-16.
- Paquette, S., Jaeger, P. T. and Wilson, S. C. Identifying the security risks associated with governmental use of cloud computing. Government Information Quarterly, 2010. 27:p. 245-53.
- Jaeger, P. T., Grimes, J. M., Lin, J. and Simmons, S. N. Where is the cloud? Geography. Economics, Environment, and Jurisdiction in Cloud Computing, 2009. 14(5):p. 4-15.
- Svantesson, D. and Clarke, R. Privacy and consumer risks in cloud computing, Computer Law & Security Review, 2010. 26:p. 391-397.
- Armburst, M., Fox, A., Griffith, R. Joseph, A. D., Katz, R. and Konwinski, A. et al. Above the clouds: a Berkley view of cloud computing, from http://radlab.cs.berkekey.edu/, accessed 5 Dec 2011.
- Saaty T. L. Decision making with dependence and feedback: The analytic network process. Pittsburgh: RWS Publications, 1996.
- Saaty T. L. The analytic hierarchy process. New York: McGraw Hill Publications. 1980.
