Road traffic accident rate as an indicator of the quality of life

Author: Petrov Artur Igorevich
Journal: Economic and Social Changes: Facts, Trends, Forecast @volnc-esc-en
Section: Social development
Article in issue: 3 (45) т.9, 2016.
Free access
The paper considers the issues devoted to assessing the connection between the quality of life and road traffic accident rate in different countries. The hypothesis put forward in the paper is based on the idea that the organization and functioning of the state road traffic safety management system and the outcome characteristics of road traffic accident rate in the road complex are closely related and are derived from the level of development of non-governmental institutions in a particular country. In order to determine how true this hypothesis is, the author carried out statistical studies of the relations between the estimates of the Quality of Life presented for 60 countries in the US News & World Report and the Human Risk indicators estimated for these countries. This indicator proposed by R. Smeed in 1949 for assessing the state of affairs in the field of road safety allows us to evaluate adequately the position of countries in the world ranking of road traffic accident rate...
Quality of life, road traffic accident rate, human risk, correlation and regression analysis, non- governmental institutions, transport culture of the population
Short address: https://sciup.org/147223834
IDR: 147223834 | UDC: 316.42 | DOI: 10.15838/esc.2016.3.45.9
Text of the scientific article Road traffic accident rate as an indicator of the quality of life
Introduction. Research into different aspects of road safety in different countries [3; 7; 15; 16] shows that the global issue of uneven spatial distribution of road traffic accidents has been formed in the world; this problem exists for a long time and is lingering in its nature. For the purpose of seeking out and identifying the reasons for differences in the level and specifics of manifestation of accidents that are typical for different countries, the author of the paper analyzed dozens of papers published in different years in a specialized journal “Safety Science”, a world leader in its area of expertise. The results of this analysis, as well as the ideas of T. Vanderbilt [18], a renowned expert in the field of road safety, show that there exists a chain of causal links between human well-being and the level and specifics of manifestation of road traffic accidents. This chain can be described as (1):
“Provision with benefits and household friendliness – Economic welfare of the population – Possession and use of vehicles with high active, passive and postaccident safety – Preservation of life of the (1) victim in a road traffic accident– Accident rate that assesses the probability of death in a traffic accident of the average citizen – Human Risk HR”. (1)
The motor vehicle has always been an object of increased danger, which is formed by significant kinetic energy that is not always controlled by the driver. This is why most countries today have formed a clear and unambiguous understanding of the need for strict speed limits and rigorous requirements for the qualification of the persons who drive the vehicles. At the same time, for many years, all the countries of the world have formed the view that road safety is only a consequence of the quality of social institutions, in particular, a manifestation of the so-called transport culture of the population [6], a set of socially significant stereotypes of transport-related behavior. Full treatment of this concept can be presented as follows.
Transport culture is part of general human culture, including the value qualities of the personality that contribute to the selection of law-abiding, cultural and, as a consequence, safety behavior in the transport environment. This conscious choice is only possible if an individual corresponds to the modern requirements to knowledge, skills and abilities that ensure safety of human life, and conscious human desire for safe participation in transport processes.
The philosophy of transport culture and the methodology of its relation to road safety are generally developed by Western scientific schools [11; 19; 20]. In particular, G.J.S. Wilde, one of the classics of the theory of driver behavior [19; 20], considers cause-and-effect relationship between the transport culture of the population and actual traffic accident rate and concludes that: “Each society has the number of accidents that the population wants to have, no more, no less” (fig. 1 ).
But whether transport culture depends on the quality of life is still a disputed question that occupies the minds of many researchers [18]. In other words, is there a place for an element called “Transport culture” in the above chain of causality between the quality of life and indicators of traffic accident rate?
An attempt to answer this question at least indirectly is undertaken in [6]. The
Figure 1. Gerald Wilde’s diagram that shows the risk homeostasis theory in transport systems [19; 20]
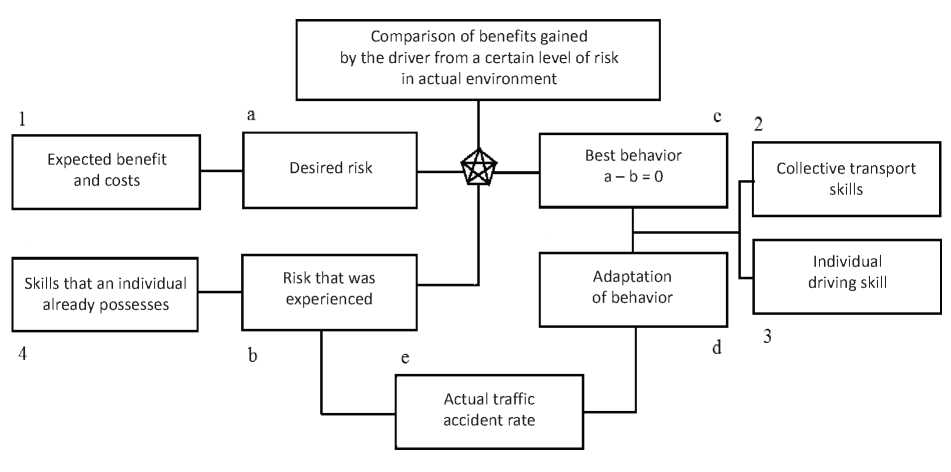
Note. The basis for the theory of formation of the actual accident rate [19; 20] is G. Wilde’s assumption that road users continuously adapt their behavior to the external situation based on the comparison of the experienced and desired risk (blocks a and b). This adaptation can be illustrated by the fact that most drivers take into account weather conditions when they choose their speed mode of movement. This is indicated, for example, by a statistical reduction in the number of accidents in the winter period (in all countries where winter conditions make driving vehicles more difficult). Situational adaptation of driver behavior forms the actual traffic accident rate (block e). The level of risk that most of road users want to have (mass transport behavior) is determined by how they evaluate the benefits and costs (advantages and disadvantages) in choosing various behavioral strategies (block 1). Here we can see significant individual differences. Some do not tolerate risk, others are more willing to put themselves at risk. The magnitude of risk experienced by road users depends on the number of accidents actually existing in the society, public attitudes and the ability of road users to perceive traffic danger (existing skills, block 4). The adaptation of behavior is influenced by the established skills of road users (collective transport skills, block 2) and individual driving skills (block 3).
Traffic culture model developed by G. Wilde [19; 20], shows that the desired transport behavior (block c), adaptation of behavior (block d), actual accident rate (block e) and tested risk (box b) are interconnected in a cycle. Wilde concludes that the only thing that can cause long-term reduction in traffic accident rate is the change in the model of traffic behavior of people, i.e. the increase in the level of transport culture in society.
concept of “transport culture” (UTC), previously used in different sources [3; 11; 15; 16; 18; 19; 20], was first described as a derivative of the actual level of motorization in each country (region):
UTC = 1 + exp(a · Ua) , (2)
where UTC is the measure of the level of transport culture in a given country (region);
Ua is the actual level of motorization in the country (region).
In order to identify the model, the author analyzed a considerable volume of statistical data that formed the basis of the evidence [6]. It has been established that the dialectical development of motorization in the country gradually forms the transport culture of its population. New generations start to perceive the car completely differently than the previous ones, i.e. more adequately, with an understanding of the degree of risk; gradually, over time, a new type of social behavior is formed – the one in which there exist qualitatively new social relations between drivers and between drivers and pedestrians. Thus, the level of transport culture in the country is growing. So, today, transport culture and motorization in developed countries of Western Europe are generally higher than in Russia, and in Russia they are generally higher than in Africa and Asia. Moreover, most countries, especially large and populous and multi-ethnic, have internal inequality of the level of motorization and transport culture in different regions [7].
If we take as an axiom the thesis that motorization is an objective manifestation of links 2–3 “Economic welfare of the population – Possession and use of vehicles” in the chain of causality (1) of the process of forming actual traffic accident rate, it is possible to go further in the reasoning. In our opinion, Provision with benefits and household friendliness cannot be a primary link in the chain of causality and they are a manifestation of the quality of life. We can try to link total actual accident rate, its fundamental principle – transport culture of the population – to the quality of life and even deeper reasons, for instance, the level of development of non-governmental institutions in the country.
In this connection it is interesting to understand whether there exist strong correlations between the results of rating evaluations of the quality of life in different countries and the level of road safety typical of these countries. If they exist, then we can transform the above (1) chain of causality into the form (3):
“ Level of development of nongovernmental institutions – Quality of life – Provision with benefits and household friendliness – Economic welfare of the population – Possession and use of vehicles with high active, passive (3) and post-accident safety – Transport culture – Preservation of life of the victim in a road traffic accident– Accident rate that assesses the probability of death in a traffic accident of the average citizen – Human Risk”.
It should be noted that the new version (3) of the connection between the factors that systematically influence traffic accident rate, in comparison with the initial version (1) has three new elements – “Level of development of non-governmental institutions”, “Quality of life” – “Transport culture”. The assessment of their role and importance in the formation of accidents is still in prospect, and the present paper is only an initial attempt in this direction.
In order to understand whether the quality of life and traffic accident rate are interrelated, let us use the tools of correlation and regression analysis and statistical assessment of the closeness of correlation between the quality of life in specific countries and characteristics of road accident rate in them. But first let us define the concepts used in this article.
Quality of life is a generalizing socioeconomic category, which represents a generalization of the concept “standard of living”. The quality of life as a concept includes not only the level of consumption of goods and services, but also the satisfaction of spiritual needs, health, life expectancy, environment, moral and psychological climate and emotional comfort [8].
Traffic accident rate is a generalizing socio-economic category that identifies the likelihood of an accident in the road sector and its specific manifestations (e.g., severity of consequences) [7].
It should be noted that the quality of life can be assessed with the use of various approaches. The most famous are the
Quality-of-life index developed by the Economist Intelligence Unit [13], and the Better Life Index proposed and calculated annually by the Organization for Economic Cooperation and Development (OECD) [14]. No matter what methodology is used for processing and interpreting the results, any assessment of the quality of life always takes into account the safety of human life [13; 14]. Safety is one of the basic postulates around which the concept of value of life and its manifestation in the form of quality are formed. In this work, we assess the quality of life with the help of Quality of Life indicator, the methodology of which is discussed below.
Traffic accident rate can be assessed by various indicators as well. The following three are most commonly used for the purpose of comparative studies: Human Risk , Transport Risk , and Severity Rate of Accident . In this study we use the classic indicator Human Risk proposed by R.J. Smeed, a classic in assessing traffic accidents, in order to estimate traffic accident rate specific to any country [15]. Previous studies [3; 7; 15; 16] show that traffic accident rate is formed very unevenly. This observation is typical for consideration in different spatial systems (at the level of district, city, region, state formation, continent, the World-system). The gap in the quality of life in different countries is also very significant [12; 13; 14].
The present paper considers a statistical proof of the hypothesis that the actual traffic accident rate serves as a manifestation of transport culture, largely dependent on the quality of life in a specific country at the primary level of consideration and, more globally, on the level of development of nongovernmental institutions. This hypothesis makes us think about the fact whether this country-specific difference in traffic accident rate is related to the differences in the quality of life in different countries. In order to find an answer this question, we carried out a statistical study for the purpose of creating a correlation and regression model that would show the impact of the quality of life on traffic accident rate and evaluate the closeness of connection between the predictor and the outcome variables. The results of this study are presented in this paper.
The goal of the study is to find out whether there is a statistical correlation between the characteristics of Quality of Life in different countries (according to the methodology of US News & World Report [12]) and Human Risk in these countries; the study also aims to discuss the results taking into account the arguments of specialists in civilizational development.
The tasks set by the author are as follows:
-
• select quantitative characteristics of the quality of life;
-
• collect statistical data about the quality of life in different countries;
-
• collect statistical data about accident rate and calculate Human Risk in different countries;
-
• prepare a database for the subsequent correlation and regression analysis of the
relation between Quality of Life in different countries and Human Risk in these countries;
-
• establish the models of statistical correlation between Quality of Life and Human Risk characteristics;
-
• interpret the obtained results.
Argumentation of the choice of characteristics of the quality of life (1 task of the research). January 20, 2016, a new ranking of top 60 countries “Best countries 2016” was released at the World Economic Forum (WEF) in Davos [12]. The ranking is based on expert assessments of individual aspects of life in different countries. The choice of countries for the rating is not accidental. Those sixty countries included in the ranking generate about 90% of global gross domestic product (GDP), and their population is about three quarters of the world’s population. They cover the entire globe – Africa, Asia, Central America, Eurasia, Europe, Middle East, North America, Oceania and South America. The countries that were not taken into account in the ranking form only “statistical tails”, which allows us to make objective conclusions without considering the statistical data on these states. The place of a specific country in this ranking is based on the ranking of individual components and on the final integrated assessment taking into account the weight of individual groups of constituent characteristics.
In brief, the essence of calculation methodology used by the authors of the ranking can be represented as the following algorithm. An integrated indicator, which was used to estimate the country’s position in the ranking “Best countries 2016” is based on the rating (on a 10-point scale) of the country according to 9 major groups of indicators of living conditions, each of which has a certain weight in the Final integrated assessment (tab. 1).
Each group of indicators contains several qualitative indicators that help assess the position of the country in the ranking according to a specific group of indicators . Figure 2 shows an example of Russia ranking 24th among the 60 “Best countries 2016”. Thus, individual components of the ranking put Russia on different positions: the second
Table 1. Weight of the groups of indicators included in the Final integrated assessment of the country for the “Best countries 2016” ranking [12]
Figure 2. Components of Russia’s ranking (number 24 out of 60 countries) among the “Best countries 2016”
Figure 3. Components and evaluation of the components of the group “Quality of Life”
Russia Rankings
|
OVERALL RANK |
CATEGORY |
SCORE |
RANK |
|
#24 |
Adventure |
1.3 |
#47 |
|
Citizenship |
0.6 |
#33 |
|
|
OVERALL SCORE |
Cultural Influence |
2.5 |
#25 |
|
Entrepreneurship |
3.8 |
#20 |
|
|
3.6 |
Heritage |
4.3 |
#19 |
|
Movers |
7.1 |
#10 |
|
|
Read ou r methodology to see how the rankings were calculated. |
Open for Business |
0 |
#60 |
|
Power |
9.4 |
#2 |
|
|
How we score |
Quality of Life |
1 |
#42 |
Quality of Life Ranking Details
|
OVERALL RANK |
ATTRIBUTES |
SCORE |
|
#42 |
Economically stable |
1.5 |
|
A good job market |
0.9 |
|
|
OVERALL SCORE |
Affordable |
0.1 |
|
Safe |
0.5 |
|
|
1 |
||
|
Politically stable |
1.8 |
|
|
Family friendly |
0.4 |
|
|
Well-developed public education system |
2.7 |
|
|
Well-developed public health system |
1.6 |
|
|
Income equality |
0.7 |
In this article we consider the study of characteristics of statistical relationship between the quality of life and traffic accident rate. In this regard, it is necessary to understand how representatives of the US News & World Report work out a technique for assessing the quality of life in a particular country. Figure 3 shows the details of assessing the quality of life in Russia.
The value of Human Risk indicator in 2013 varies in different countries within a very wide range: from 2.7 to 2.8 traffic fatalities/100 thousand people (Sweden, UK) up to 23...26 traffic fatalities/100 thousand people (Saudi Arabia and Iran). It should be noted that, unfortunately, the level of Human Risk in Russia (18.92 traffic fatalities/100 thousand people) is extremely high, and the country falls into the category of outsiders according to this indicator. The same can be said if we see the results of assessing the Quality of Life (QL = 1.0), and Safety Score (SS = 0.5) in Russia. Note that between the specific composite indicator Safety and a more general Quality of Life indicator there is a high level of correlation (R = 0.95), but no complete identity (fig. 4) .
Table 2. Correlation between the value of Quality of Life and Safety Score (according to US News & World Report) and the relevant values of Human Risk in 2013 in different countries [5; 12]
|
Countries from US News & World Report ranking (2016) |
Values of indicators |
|||||
|
о |
о со S |
СО 00 С\1 сз — аз оо аз ? | S Е 2 |
сс _§ ё § 1 Е 2 ° ^ С с ^ — СС г ” о о g 2 У q аз = с^ аз |
|||
|
1 |
Canada |
10.0 |
10.0 |
35181.7 |
2077 |
5.90 |
|
2 |
Sweden |
9.5 |
10.0 |
9571.1 |
260 |
2.72 |
|
3 |
Denmark |
9.2 |
10.0 |
5619.1 |
191 |
3.40 |
|
4 |
Australia |
9.1 |
9.1 |
23342.6 |
1192 |
5.11 |
|
5 |
Netherlands |
8.5 |
9.2 |
16759.2 |
570 |
3.40 |
|
6 |
New Zealand |
8.2 |
9.8 |
4505.8 |
253 |
5.61 |
|
7 |
Germany |
8.1 |
8.2 |
82726.6 |
3339 |
4.04 |
|
8 |
Austria |
7.3 |
9.2 |
8495.1 |
455 |
5.36 |
|
9 |
UK |
7.3 |
7.0 |
63136.2 |
1770 |
2.80 |
|
10 |
Luxembourg |
6.3 |
8.8 |
530.4 |
45 |
8.48 |
|
11 |
Japan |
6.2 |
7.6 |
127143.6 |
5679 |
4.47 |
|
12 |
Ireland |
5.7 |
7.8 |
4627.2 |
188 |
4.06 |
|
13 |
France |
5.5 |
5.5 |
64291.3 |
3268 |
5.08 |
|
14 |
United States of America |
5.4 |
2.7 |
320050.7 |
32719 |
10.22 |
|
15 |
Singapore |
4.6 |
6.5 |
5411.7 |
159 |
2.94 |
|
16 |
Spain |
4.2 |
6.2 |
46927 |
1680 |
3.58 |
|
17 |
China |
4.2 |
6.2 |
1385567 |
62945 |
4.54 |
|
18 |
Italy |
3.6 |
5.5 |
60990.3 |
3385 |
5.55 |
|
19 |
Portugal |
3.5 |
6.8 |
10608.2 |
637 |
6.00 |
|
20 |
South Korea |
2.6 |
1.8 |
49262.7 |
5092 |
10.34 |
|
21 |
Czech Republic |
2.4 |
3.8 |
10702.2 |
654 |
6.11 |
|
22 |
Malaysia |
2.3 |
1.3 |
29717 |
6915 |
23.27 |
|
23 |
Thailand |
2.2 |
1.0 |
67010.5 |
13650 |
20.37 |
|
24 |
Vietnam |
1.9 |
0.7 |
91679.7 |
9845 |
10.74 |
|
25 |
Saudi Arabia |
1.9 |
0.9 |
28828.9 |
7661 |
26.57 |
|
26 |
India |
1.9 |
0.3 |
1252140 |
137572 |
10.99 |
|
27 |
Philippines |
1.8 |
0.6 |
98393.6 |
1469 |
1.49 |
|
28 |
Hungary |
1.8 |
3.2 |
9954.9 |
591 |
5.94 |
|
29 |
Turkey |
1.6 |
0.6 |
74932.6 |
4786 |
6.39 |
|
30 |
Indonesia |
1.5 |
0.7 |
249865.6 |
26416 |
10.57 |
End of Table 2
|
Countries from US News & World Report ranking (2016) |
Values of indicators |
|||||
|
О |
о со S |
СО 00 С\1 CD ОО CD ь 1 ° Е 2 |
сс -о ё т Е 2 ° — с 2 § cd со о_ Е О 03 с = с^ "° CD |
|||
|
31 |
Mexico |
1.5 |
0.2 |
122322.4 |
17139 |
14.01 |
|
32 |
Bulgaria |
1.5 |
2.0 |
7222.9 |
601 |
8.32 |
|
33 |
Chile |
1.5 |
1.1 |
17619.7 |
2108 |
11.96 |
|
34 |
Israel |
1.5 |
0.2 |
7733.1 |
277 |
3.58 |
|
35 |
Costa Rica |
1.4 |
1.1 |
4872.2 |
625 |
12.83 |
|
36 |
Greece |
1.4 |
2.1 |
11128 |
865 |
7.77 |
|
37 |
Peru |
1.3 |
0.8 |
30375.6 |
4039 |
13.30 |
|
38 |
Sri Lanka |
1.3 |
0.5 |
21273.2 |
2362 |
11.10 |
|
39 |
Argentina |
1.2 |
0.9 |
41446.2 |
5209 |
12.57 |
|
40 |
Uruguay |
1.1 |
0.9 |
3407.1 |
567 |
16.64 |
|
41 |
Romania |
1.0 |
1.1 |
21698.6 |
1866 |
8.60 |
|
42 |
Russian Federation |
1.0 |
0.5 |
142833.7 |
27025 |
18.92 |
|
43 |
Brazil |
0.9 |
0.3 |
200361.9 |
41059 |
20.49 |
|
44 |
Morocco |
0.9 |
0.7 |
33008.1 |
3832 |
11.61 |
|
45 |
Dominican Republic |
0.9 |
0.6 |
10403.8 |
2810 |
27.01 |
|
46 |
Panama |
0.8 |
1.0 |
3864.2 |
386 |
9.99 |
|
47 |
Tunisia |
0.8 |
0.2 |
10996.5 |
1505 |
13.69 |
|
48 |
Bolivia |
0.8 |
0.3 |
10671.2 |
2400 |
22.49 |
|
49 |
South Africa |
0.5 |
0.2 |
52576.1 |
13802 |
26.25 |
|
50 |
Colombia |
0.5 |
0.2 |
48321.4 |
6038 |
12.50 |
|
51 |
Guatemala |
0.5 |
0.3 |
15468.2 |
1977 |
12.78 |
|
52 |
Jordan |
0.5 |
0.6 |
7273.8 |
768 |
10.56 |
|
53 |
Nigeria |
0.3 |
0.2 |
173615.3 |
6450 |
3.72 |
|
54 |
Kazakhstan |
0.4 |
0.3 |
16440.6 |
3233 |
19.66 |
|
55 |
Pakistan |
0.3 |
0.2 |
182142.6 |
9917 |
5.44 |
|
56 |
Azerbaijan |
0.5 |
0.2 |
9413.4 |
1256 |
13.34 |
|
57 |
Egypt |
0.3 |
0.3 |
82056.4 |
8701 |
10.60 |
|
58 |
Ukraine |
0.2 |
0.2 |
45372.7 |
4833 |
10.65 |
|
59 |
Algeria |
0.1 |
0.4 |
39208.2 |
4540 |
11.58 |
|
60 |
Iran |
0.1 |
0.2 |
77447.2 |
17994 |
23.23 |
Compiled using the data of: [14] and the WHO global status report on road safety 2015 [5].
Table 3. Statistical characteristics of the model Quality of Life = f(Safety Score).
|
Statistical characteristics |
Pair correlation coefficient |
Determination coefficient |
F-test |
Standard error of approximation |
|
Values |
0.953 |
0.909 |
577.972 |
0.880 |
Figure 4. Regression model of the relationship between the specific Safety Score indicator and a more generalized Quality of Life indicator (2016)
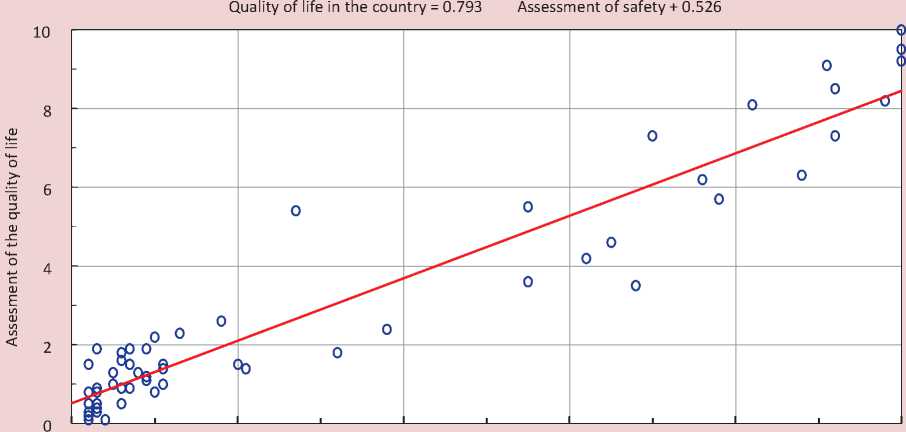
Table 3 shows statistical characteristics of the model Quality of Life = f(Safety Score) .
Possessing the entire source data necessary for analysis, we can build regression models to show the influence on traffic accident rate of Human Risk– Quality of Life and its special case – Safety Score, and to evaluate the closeness of the connection between the predictors and the resulting.
Research findings (task 5 of the research) . Spatial scattering of experimental points for the dependences under consideration is represented in Figure 5. An inverse function Y = a is suitable for a relatively adequate desc X ription of the functional relationship between variables in this kind of scattering of experimental points.
It should be noted that a power function Y = a can be used as an alternative to this Xb function when describing a set of expe-
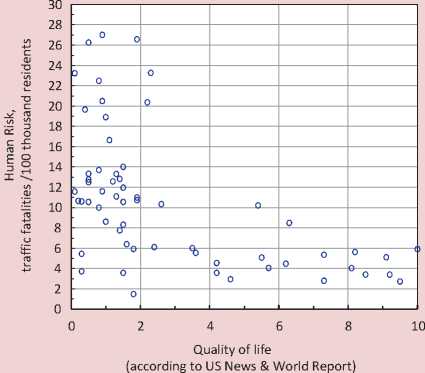
Figure 5. Spatial scattering of experimental points on the coordinate plane for the dependencies under consideration
а) HR = f(Quality of Life) б) HR = f(Safety Score)
rimental data. However, several considerations, the most important of which is the understanding of the mechanism of formation of causal relationships in the “Driver – Vehicle – Road – Environment” system or a system of even higher rank: “State – Territory – Economic system – System of social relations – Transport culture” show us that it would be more advisable to choose a relatively simpler model Y = a for solving
the tasks in hand.
X
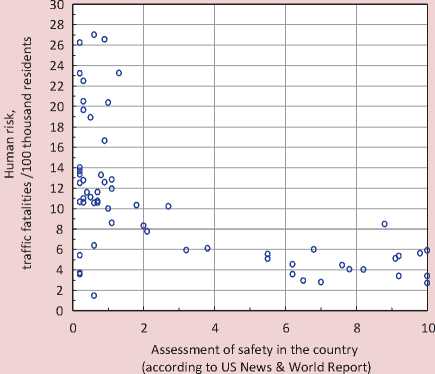
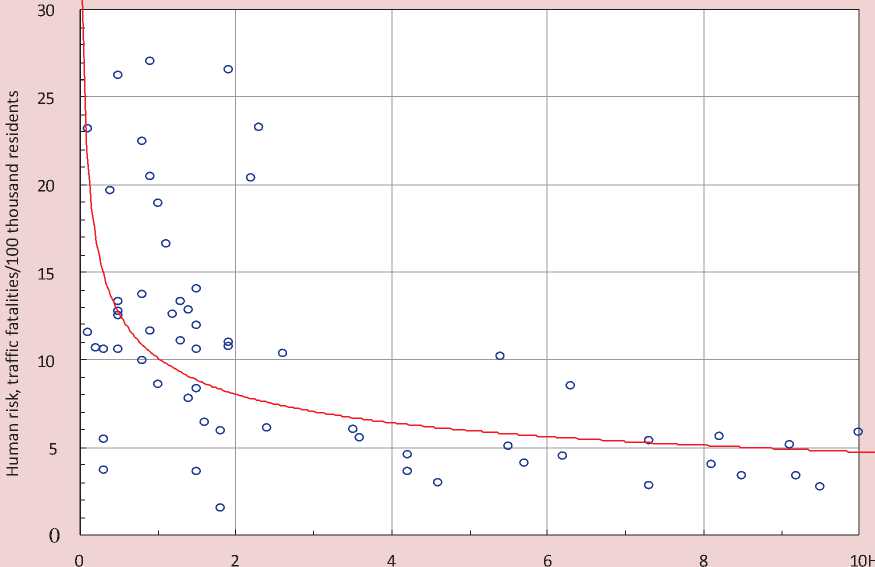
The results of simulation of the model of dependence HR = f(Quality of Life) and its particular case –the dependence HR = f(Safety Score) are presented respectively in Figures 6 and 7 .
The analysis shows that an inverse function Y = X a can be an adequate choice as an approximating model.
Statistical characteristics of these models are presented in Tables 4 and 5.
According to the results of modeling the dependencies HR = f(Quality of Life) represented in Figure 6, and the dependence HR = f(Safety Score) shown in Figure 7, it is possible to make four intermediate conclusions that lead out to further arguments.
1. In order to make an accurate description of statistical relationships between Quality of Life, its component Safety Score and Human Risk it is possible to use the inverse functions of the form
Quality of life (accordingto US News & World Report)
Human risk, traffic fatalities/100 thousand residents
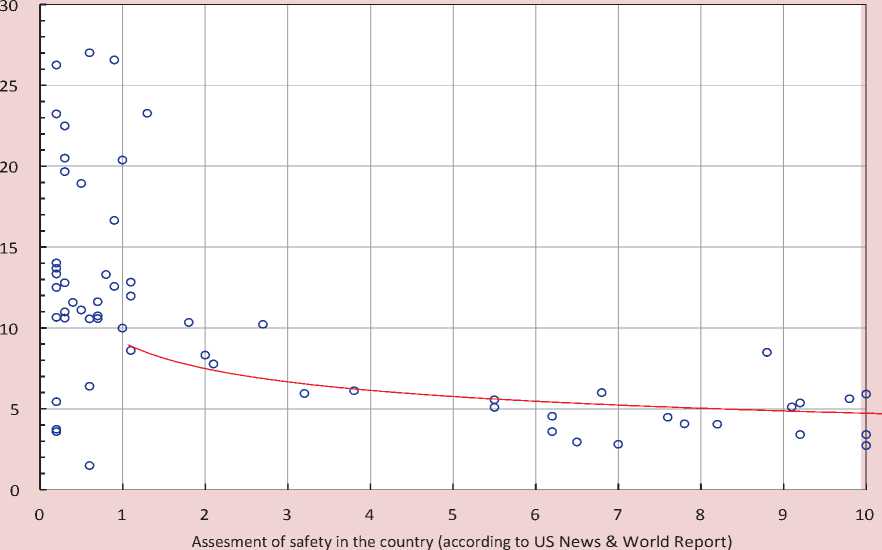
Table 4. Statistical characteristics of the model HR = f(Quality of Life)
|
Statistical characteristics |
Pair correlation coefficient |
Determination coefficient |
F-test |
Standard error of approximation |
|
Values |
0.546 |
0.298 |
24.630 |
5.645 |
Table 5. Statistical characteristics of the model HR = f(Safety Score)
|
Statistical characteristics |
Pair correlation coefficient |
Determination coefficient |
F-test |
Standard error of approximation |
|
Values |
0.594 |
0.353 |
31.602 |
5.421 |
HR = 16/QL and HR = 16/SS . Note that the level of closeness of statistical relationship between the variables is at the salient level on the Chaddock scale (R = -0.55… -0.59), but it is not high.
-
2. Visual analysis of graphical representation of dependencies in Figures 6 and 7 shows that, in fact, the links between Human Risk and Quality of Life and Safety Score can be divided into three spatial regions (in the ranges of values of Quality of Life equal to [0...1.5[; ]1.5; 2.5[ and ]2.5...10]). And if the extreme (left and right) branches of dependencies HR = f(Quality of Life) and HR = f(Safety Score) are characterized by lines X = 1 and Y = 5, then for the middle part of the dependence, in which there is a reversal trend, it is extremely difficult to choose an adequate model.
-
3. Judging by the features of the models HR = f(Quality of Life) and HR = f(Safety Score) , all countries in terms of possibilities to ensure a high level of road traffic safety today can be divided into the following three fundamentally different groups [11]:
-
• countries leading in the quality of life and countries with a catching-up development, which are characterized by a high level of road traffic safety even given the fact that the leadership position has yet to be achieved in the field of Quality of Life (Quality of Life =3...9) ;
-
• countries-outsiders in the quality of life (Quality of Life =0...2) ;
-
• countries in transition from outsiders to leaders (Quality of Life =2...3) .
-
4. A possible explanation to this fact lies in the features of development of social institutions in a particular country and in the history of the very motorization process and the development of agencies regulating and controlling all aspects of life related to road traffic safety. For example, it is known that Russia today (2000–2016) goes through all the development trends in motorization that the United States passed in the 1950s–1960s, and many European countries – in the 1970s–1980s [6].
Discussion of research results (task 6 of the study). Taking into consideration all of the above, we face a need to explain the features of correlation and regression models of the following types: HR = f(Quality of Life) and HR = f(Safety Score). And in this case, logical chain of thought cannot be constructed without considering the Level of development of social institutions – the very fundamental element of the chain of causality in the formation of road traffic accident rate.
The Stanford Encyclopedia of Philosophy has the following definition: social institutions are “forms of organization of the joint activity of people, which are developed historically or created through specific effort; the existence of these institutions is dictated by the need to meet the social, economic, political, cultural or other needs of society as a whole or its part. Institutions are characterized by their potential to influence people’s behavior through established rules” [17].
According to D. Adzhemoglu and J.A. Robinson [1], “in order to understand global inequality, it is necessary to understand why some societies are organized so inefficiently. These authors convincingly criticize theoretical explanations for differences between countries, which can be roughly classified as a “Geographical theory”, “Cultural influence theory” and “Theory of ignorance”. Their reasoning results in the conclusion about the dominant principle that effectively stimulates the development of society and is formulated as a thesis: “The path to prosperity lies through the solution of basic political problems” [1]. Numerous historical examples provided by D. Adzhemoglu and J.A. Robinson confirm this thesis in general. The most important conclusion that one can think of after reviewing their work is formulated by the authors themselves: “Huge differences between the path of socio-economic development taken by different countries were the result of a complex relationship between institutional drift and breaking points”.
The classic work of S. Huntington “The clash of civilizations and the remaking of world order” [10] discusses in detail the history, causes and drivers of development of civilization, the circumstances that promote the differentiation of paths for different civilizations, common features and differences between them on the whole range of signs. A conclusion made by S. Huntington concerning the fact that the West achieved the so-called mature phase of development implies the thesis of the Western society entering “the period of prosperity resulting from the cessation of internal aggressive destruction” [10]. Obviously, this thesis complies well with the data in Table 3 and Figures 6 and 7, in which the minimum values of Human Risk are typical of the group of countries in which the level of the quality of life is as high as possible. And it is interesting to note that this group consists of Western countries plus Japan and Singapore, the economic policy of which can be characterized as inclusive. The term “inclusive economic and social development institutions” implies the rules by which an economy works and which are based on private ownership of the means of production and on entrepreneurial initiative of broad masses of citizens. Societies where inclusive economic institutions function successfully, over time, turn into societies with a high level of the quality of life, according to the chain (3), with a low level of road traffic accidents.
On the contrary, countries characterized by a high rate of road traffic accidents are mainly the countries with low levels of the quality of life and the so-called extractive economic institutions “designed to obtain maximum income from the exploitation of one part of society and direct it to the enrichment of the other part” [1].
According to the results of these studies performed by researchers at Tyumen Industrial University [6; 7], a conclusion can be made concerning the relationship between transport culture in a particular country or region and the level of economic well-being of local residents. For instance, Russia has the lowest level of transport culture in the republics of Dagestan, Ingushetia, Kalmykia and Tyva [4]. The Federal State Statistics Service data [9] show that these regions have a very low level of produced gross regional product (GRP) and per capita income. In contrast, in those subjects of the Russian Federation, where the economic situation is more favorable, road traffic accident rate is much lower [7]. The same can be said about other countries of the world [3; 7; 15; 16].
The monumental work by D. Adzhe-moglu and J.A. Robinson “Economic origins of dictatorship and democracy” [2] explains in detail the relationship between different forms of social organization and features of functioning of the economy; the work shows what the primacy of different forms of organization of public institutions leads to at the level of manifestations of various aspects of life. The conclusion made by the authors [2] is quite clear and categorical: improvement of the quality of life is dialectically justifiable and natural only in democratic societies with developed social institutions.
Returning to the models HR = f(Quality of Life) and HR = f(Safety Score) , shown in Figures 6 and 7, we should note that the left branch of the graph, characterizing the countries with a low level of the quality of life, reduces the level of adequacy of the model.
Let us try to find out why countries with a low level of the quality of life have very different values of Human Risk, including low values, at the level of developed countries of the Western civilization (S. Huntington). Examples of such countries are Philippines (HR = 1.49
traffic fatalities/100 thousand people), Nigeria (HR = 3.72 traffic fatalities/100 thousand people), and Pakistan (HR = 5.44 traffic fatalities/100 thousand people). This can be explained by the specifics of demography and economic development in these countries. Very young, poor and numerous population along with low motorization rate Ua forms the environment in which the automotive complex is at the initial stage of its development, i.e. in the chronology of the process of motorization, these countries today are at the stages that the U.S. and Western Europe passed in the 1910s–1920s. Conventionally, these countries can be included in the first group of countries united on the basis of initial motorization. On the contrary, in countries with a low quality of life and high level of Human Risk: Iran (HR = 23.23 traffic fatalities/100 thousand people), Kazakhstan (HR = of 19.66 traffic fatalities/100 thousand people), South Africa (HR = 26.25 traffic fatalities/100 thousand people), South and Central America (HR = 15...25 traffic fatalities/100 thousand people) and the Russian Federation (HR = 18.92 traffic fatalities/100 thousand persons), the level of motorization is quite high, the automotive complex as a whole has been formed; however, transport culture of the population in UTC is still lagging behind the best global practices. These are countries of the second group – the level of accidents in them will decrease along with an increase in the quality of life. Thus, the diversity of the values of Human Risk in the group of countries with a low level of the quality of life is explained by the difference in the degree of development of automotive complexes, i.e. the history of motorization, and by the place in the hierarchy of countries with different level of development of social institutions. Countries of the third group, which are characterized by low values of Human Risk, are united by a common feature of a high level of development of social institutions.
Conclusion. Summarizing all of the above, I note that the main conclusion of the study consists in establishing a noticeable statistical link between the quality of life in different countries (according to the methodology of US News & World Report [12]) and Human Risk in these countries; these indicators are estimated using the ratio of the number of road traffic fatalities per 100 thousand population, according to the inverse model type.
Analysis of databases on Human Risk and the corresponding indicators of the quality of life (in 60 countries) in different countries, subsequent correlation and regression analysis, establishment of statistical relationship between predictors and the resulting according to the reverse model type allows us to classify the countries into three groups by the quality of life.
These are: countries-leaders and countries with catching-up development (group 1, for which QL = 3...9 ); countries-outsiders (group 3, for which QL = 0...2 ); countries in transition from outsiders to leaders (group 2, for which QL =2...3 ).
The explanation of such a differentiation of countries into groups was conducted taking into account opinions of world-class experts in matters of civilizational development and, although the explanation is debatable, it has a right to exist.
Today road safety in our country is dominated by the principle of punishment for a misdemeanor. Results of the research presented in the paper suggest that road traffic accident rate as a derivative from the violation of established rules of social life can and should be dealt with through a gradual, systematic development of social institutions. This will help improve the quality of life, contribute to the subsequent growth of transport culture of society and reduce traffic accident rate.
References Road traffic accident rate as an indicator of the quality of life
- Adzhemoglu D., Robinson D.A. Pochemu odni strany bogatye, a drugie bednye. Proiskhozhdenie vlasti, protsvetaniya i nishchety . Moscow: Izdatel'stvo AST, 2015. 694 p. .
- Acemoglu D., Robinson D.A. Ekonomicheskie istoki diktatury i demokratii . Moscow: Izd. Dom Vysshei shkoly ekonomiki, 2015. 512 p. .
- Blinkin M.Ya., Reshetova E.M. Bezopasnost' dorozhnogo dvizheniya: istoriya voprosa, mezhdunarodnyi opyt, bazovye institutsii . Moscow: Izd. Dom Vysshei shkoly ekonomiki, 2013. 240 p. .
- Baza dannykh o pokazatelyakh sostoyaniya bezopasnosti dorozhnogo dvizheniya GIBDD MVD RF (2004-2015). Arkhiv . Available at: http://www.gibdd.ru/stat/archive/. .
- Doklad VOZ o bezopasnosti dorozhnogo dvizheniya v mire (2015) . Available at: http://www.who.int/violence_injury_prevention/road_safety_status/2015/ru/
- Kolesov V.I., Petrov A.I. Analiz transportnoi kul'tury naseleniya . Transport. Nauka, tekhnika, upravlenie , 2015, no. 6, pp. 20-22. .
- Petrov A.I. Osobennosti formirovaniya avtotransportnoi avariinosti v prostranstve i vremeni . Tyumen: Izd. TyumGNGU, 2015. 254 p. .
- Raizberg B.A., Lozovskii L.Sh., Starodubtseva E.B. Sovremennyi ekonomicheskii slovar' . Moscow: INFRA-M, 1999. 479 p. .
- Federal'naya sluzhba gosudarstvennoi statistiki RF (2015) . Available at: http://www.gks.ru/. .
- Huntington S. Stolknovenie tsivilizatsii . Moscos: Izd. AST, 2015. 571 p. .
- Adams J.G.U. Risk and Freedom: the record of road safety regulation. Cardiff: Transportation Publishing Projects, 1985. 202 p.
- Best Countries (2016). Ranking Global Performance. Available at: http://www.usnews.com/news/best-countries/articles/us-news-unveils-best-countries-rankings
- Economist Intelligence Unit (2016) Quality-of-life index. Available at: http://www.eiu.com/home.aspx
- OECD (2016) OECD Better Life Index. Available at: http://www.oecdbetterlifeindex.org/
- Smeed R.J. Some statistical aspects of road safety research. Journal Royal Statistics, 1949, A (I), pp. 1-34.
- Smeed R.J. Variations in the pattern of accident rates in different countries and their causes. Traffic Engineering and Control, 1968, no. 10, pp. 364-371.
- Stanford Encyclopedia of Philosophy. Available at: http://plato.stanford.edu/
- Vanderbilt T. Why we drive the way we do (and what it says about us). New York: First vintage books, 2008. 416 p.
- Wilde G.J.S. Risk homeostasis theory and traffic accidents: Propositions, deductions and discussion of dissension in recent reactions. Ergonomics, 1988, no. 31, pp. 441-468.
- Wilde G.J.S. Target Risk 3: Risk homeostasis in everyday life. New York: PDE Publications, 2014. 234 p.
