Road traffic accident rate in Russia: main socio-economic factors of its formation and spatio-temporal features

Author: Petrov Artur I., Kolesov Viktor I.
Journal: Economic and Social Changes: Facts, Trends, Forecast @volnc-esc-en
Section: Social development
Article in issue: 1 т.14, 2021.
Free access
For more than a decade, the Russian state has been actively engaged in issues of preservation of people, but the positive effects of this work quickly disappeared (2014-2016), and the trend again changed to a negative one. The First (2006-2012) and the Second (2013-2020) Federal Target Programs on Road Safety were aimed at reducing the number of deaths in road traffic accidents, and made a positive contribution to the field of preservation of people. For instance, in 2006-2019, the annual number of deaths in road traffic accidents decreased from 32,724 to 16,981 people per year, or almost twice. Nevertheless, there are still many problems in ensuring road safety. One of them is the complexity of the system processes of road safety management in such a large country as the Russian Federation. Russia consists of 85 heterogeneously developed economically and socially entities on the territory of which representatives of 190 peoples live. The article analyses a wide range of issues related to the assessment of the impact of the sociocenosis features on one of the most important characteristics of road traffic accident rate - the severity. The purpose of the research is to study the influence of the characteristics of representative socio-economic factors on road traffic accident severity in Russian regions, and to develop the most effective differentiated approach to the financing of regional road safety programs on this basis. The scientific novelty of the research consists in the model confirmation of the previously put forward ideas about the positive impact of the basic socio-economic institutions that shape road users’ transport behavior on its safety. The authors consider these ideas in relation to Russia as a whole and to the relationship of regional road traffic accident rate with the economic and demographic characteristics of Russians’ life. The paper presents the rank patterns of influence on road traffic accident severity of such characteristics of regional sociocenosis as the population’s median age, the share of population with income below the minimum wage, and the average monthly income. We show the conceptual considerations for improving road safety in the Russian Federation in the spatiotemporal continuum.
Road safety, road traffic accident, russian federation, road safety management, road traffic accident severity, regional sociocenosis, impact factor, spatio-temporal features
Short address: https://sciup.org/147225519
IDR: 147225519 | UDC: 316.42 | DOI: 10.15838/esc.2021.1.73.14
Text of the scientific article Road traffic accident rate in Russia: main socio-economic factors of its formation and spatio-temporal features
Introduction and problem urgency
Vital security is one of the most important modern global values1. The value of an individual’s life is recognized almost everywhere [1], and its economic equivalent can reach values of 5–10 million dollars [2; 3]. Road traffic accident has been and continues to be one of the leading causes of death worldwide. “If an appropriate action is not taken, traffic injuries may become the third leading component of the global burden of disease and injury by 2025” [3, p. 16]. The paper notes that the socioeconomic damage from road traffic accident rate in the world reaches hundreds of billions of dollars [3] (for example, in the United States in 2016 – 256 billion dollars, or about 1.5% of GDP [4]).
The problem of improving road safety and road traffic accident rate issues are also relevant for the
Russian Federation2. Over the previous three years (2017–2019), a steady trend of natural population decline has been formed in Russia3. In 2019, the number of deaths exceeded the number of births by 316.16 thousand people ( Tab. 1 ). Road traffic accident rate plays a very significant role in this negative process. The number of Russians, dead in road traffic accidents in 2019, amounted to 16.98 thousand people, or about 13.3% of the number of deaths from external causes (see tab. 1).
Despite the generally positive trends, expressed in a decrease in overall mortality ( ≈ -6% in 2014– 2019) and very impressive results in reducing the number of deaths from external causes ( ≈ -26% over 6 years), the structural share of road traffic accident injuries in Russia remained stable all these years,
Table 1. Russian population dynamics in 2014–2019 and road traffic accident rate contribution to the death rate of the country’s population, people per year
Year Population dynamics Natural increase (+), decrease (-) Number of deaths from external causes Number of deaths in road traffic accidents Number of births Number of deaths Absolute value Share of the number of deaths from external causes, % 2014 1947301 1913613 33688 173523 26963 15.5 2015 1944136 1911413 32723 164276 23114 14.1 2016 1893256 1887913 5343 153517 20308 13.2 2017 1689884 1824340 -134456 138784 19088 13.8 2018 1604589 1827827 -223238 134916 18214 13.5 2019 1484517 1800677 -316160 128142 16981 13.3 According to: Natural population movement in the context of the entities of the Russian Federation. Available at: ru/free_doc/2019/demo/; Road traffic accident rate in the Russian Federation for 12 months of 2019. Informational and Analytical Review. Moscow: Research Center of Road Security of the Ministry of Interior of the Russian Federation, 2020, 21 p. Available at: amounting to 13–14%. In fact, the socio-economic damage of the Russian Federation from road traffic accidents reaches 1.5–2.0% of GDP4, i.e. at least 1.5–2.0 trillion rubles per year5.
Real statistics indicate a very serious role of the road safety in the life of Russian society. The study of the cause-and-effect links of ensuring road safety process and establishment of patterns of priority factors’ influence on road traffic accident rate formation are the mechanism’s spring for implementing the target function to improve the quality of Russians’ life declared in the Road Safety Strategy in the Russian Federation6.
The generally accepted approach to the features’ analysis of the functioning of any road transport system [5] involves its differentiation into the subsystems “Driver – Car – Road – Environment”. Over the past 50–80 years, scientists around the world paid maximum attention [6] primarily to the features of the subsystems’ functioning “Car” and “Road” (separately and in conjunction)
which contributed to a qualitative change in the design of vehicles and improved approaches to the construction and reconstruction of roads, and as a result there was a change in the road safety paradigms. At the same time, the influence of factors related to the “Driver” (“Person” will be more correctly) and “Environment” subsystems on road safety has not yet been fully studied [6].
E. van Beeck and the co-authors have shown that many factors, external to the car, can be conditionally differentiated into the enlarged groups “Economic conditions”, “Social conditions”, “Demographic features” [7]. These factors are more or less interrelated and have an indirect but very significant impact on the current level of road safety.
The authors repeatedly use such terms as “road safety”, “road traffic accident”, “sociocenosis”. In this regard, it is necessary to give their definitions.
According to the Federal Law no. 196-FZ “On Road Traffic Safety”, dated December 10, 19957, road safety is the state of the process of moving people and goods with or without vehicles within roads reflecting the degree of its participants’ protection from road traffic accidents and their consequences .
Unfortunately, in the article 2 of the “Key terms” of the act there is no definition of “road traffic accident”. However, experts of Moscow Automobile and Road Construction State Technical University (MADI), the authors of reverence book of road terms8, think that “... the term “Accident” identifies the indicator of road safety in the absolute number of car accidents, number of deaths and injuries or as a ratio of the number of road traffic accidents to the number of vehicles, population or mileage vehicles for a certain period of time” .
In fact, in the world practice, there are some other criteria to assess road traffic accident. For example, in 1949, the English statistician R. Smeed [8] proposed using such indicators as transport ( TR ) and social ( HR ) risks. Their essence is to estimate the specific indicators “Number of deaths in road traffic accidents per 10 thousand vehicles” and “Number of deaths in road traffic accidents per 100 thousand inhabitants”. Later, the indicator of “Road traffic accident severity” was introduced into the practice of assessing in road traffic accident [9]. This indicator reflected the proportion of deaths in the total number of injuries of road traffic accident.
It is the road traffic accident severity that is the most expressive indicator for assessing the road traffic accident state today [10–13]. J.G.U. Adams has given the most complete explanation of the priority importance of this assessment of road safety state among others: “The road accident severity is the embodiment of a comprehensive approach to assessing the actual situation in the field of road safety. The percentage of deaths among the injuries of road traffic accidents indirectly indicates both the design level of the vehicle’s quality (active and post-accident safety), used by road users, and the actual state of the system of injury’s rescue in an accident by the medical aid forces” [10, p. 83]. That is why the researchers join the authors’ opinion and choose the criterion “Road traffic accident severity” as the most important evaluation characteristic of road traffic accident.
Cenosis is a time-and space-limited community with weak ties and common goals [14]. The term “cenosis” originally came from biology, but at present there are already 42 essentially similar concepts with the ending “cenosis” including “technocenosis” which is a set of technical products generalized by any attribute, and “sociocenosis” is a set of any living entities united by a separate attribute [14; 15; 16].
Sociocenosis is a set of social individuals limited on any grounds. The peculiarity of cenosis is fuzzy boundaries between these individuals (both in technology and in society), their constant mixing in space [15; 16]. The experience proves that in sociocenosis, some of them are rarely not exactly the same, but even simply comparable in specific characteristics. However, sociocenosis significantly differ in some characteristics. For example, the median age is one of the characteristics of the sociocenosis of the region’s population, and it is very different for the Chechen Republic (24.1 years in 2010 and 26.0 years in 2018) and the Tambov Oblast (42.3 years in 2010 and 43.7 years in 2018)9.
Selection of impact factors, scientific novelty, purpose, and tasks of the research
One of the important issues of the research is the choice of characteristics of regional sociocenosis that have a significant impact on road traffic accident rate, in particular on road traffic accident severity. There are many indicators of territories’ socio-economic development. For example, the collection “Russian Regions. 2019”10 presents hundreds of indicators, differentiated by 23
sections. The analysis of the long-term work of foreign specialists11 and the experts of the World Health Organization12 allows distinguishing three most important characteristics from the group of socio-economic impact factors:
– Population’s median age;
– Share of the population with income below the minimum wage;
– Average monthly income of the population.
Different sources often mention them [7; 17–22] in the context of their influence on the formation of potentially dangerous situations on the road as very significant. Let us try to argue their choice.
L. Evans writes: “The greatest risk is typical for the youngest drivers” [17]. This finding has appeared so frequently in studies of driver risk that it should be considered a “law of nature”.
A.V. Korotaev and his colleagues conducted an in-depth analysis of changes in values under the influence of age in the context of psychosocial theories of ageing [18]. Analyzing 75 reputable sources (A.V. Pisarev, A.B. Kogan, R. Fischer, P.B. Baltes, J. Baltes, Brandtstadter, L.L. Carstensen, W.M. Evan, G.L. Zellman, J.C. Campbell, and others), devoted to the study of psychosocial theories of development in the process of growing up and ageing, they have proved that with age, the value of issues of safety, order, and health increases for almost any person. This statement has a significant impact on the correction of drivers’ behavior.
The choice of the characteristics “Share of the population with income below the minimum wage” and “Average monthly income of the population” as representative of road safety is less obvious. These indicators belong to the group of economic indicators of which there are a lot. Nevertheless, their choice was determined by the recommendations of authors specializing in this research topic.
In the section “Impact of economic development on road safety: a literature review” of the report, prepared by specialists of the International Traffic Safety Data and Analysis Group (IRTAD)13, the authors have considered the results of 50 works in details (among them such authoritative experts in the field of road safety as E. van Beeck, R. Elvik, W. Evans, J.G. Graham, S.C. Partyka, S. Peltzman, A.C. Wagenaar, G.J.S. Wilde, and others). With no details, the paper presents only a general conceptual scheme of the impact of economic conditions in the country on the final results in the field of road safety (Fig. 1) . The impact of the country’s economic wellbeing on road safety is very clearly represented in the work of M.J. Koornstra (Fig. 2) .
A deep analysis of the foreign experts’ works [7; 19–22] let arguing the choice as representative indicators of the society from the economic perspective, the criteria is “Share of the population below the minimum wage” and the “Average monthly income of the population”.
The scientific novelty of the research lies in the pattern confirmation of the ideas of J.G.U. Adams [10] and M.Ya. Blinkin [6] about the positive impact of the basic institutions that shape the road users’ transport behavior on road safety. In the course of this work, the authors of the article have tried to consider these ideas in relation to Russia taking into account its regional diversity and the connection of regional car accident with the economic and demographic characteristics of Russians’ life.
Figure 1. Conceptual foundations of the link between economy and road safety
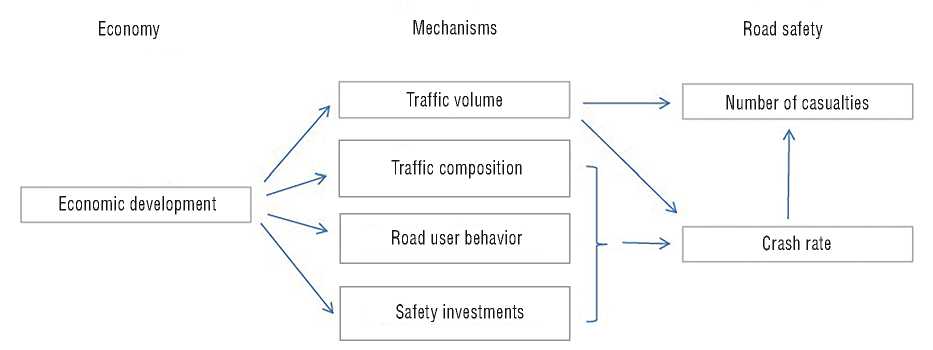
Source: Evans L. Traffic Safety. Bloomfield, Mich.: Science Serving Society, 2004. 457 p.
Figure 2. Impact of the specific gross national income on the citizens’ death rate in road traffic accidents
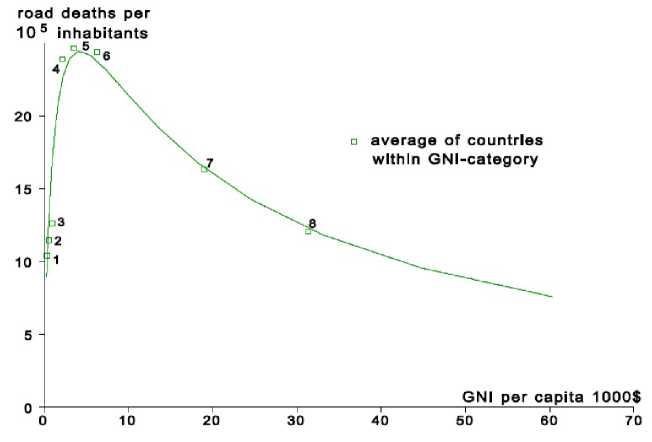
Source: Koornstra M.J. Prediction of traffic fatalities and prospects for mobility becoming sustainable safe. Sadhana , 2007, vol. 32, pp. 365–395.
The hypothesis of the research is formulated as follows: “The road traffic accident severity in Russian regions is statistically related to the characteristic features of the regional society”.
The purpose of the research is to study the impact on road traffic accident severity in Russian regions of the selected characteristics of represen- tative socio-economic factors (the median age of the region’s population; share of the population with income below the minimum wage; the average monthly income of the population) and on this basis to develop the most effective differentiated approach to financing regional programs for road safety.
The tasks of the research are structured as follows.
-
1. To conduct a primary analysis of the trends of changes in road safety in the Russian Federation in 1991–2019; compare the Russian trend of changes in road safety with analogues in other countries.
-
2. To justify the choice of a rank pattern in order to study the influence of regional sociocenosis on the car accident features.
-
3. To prepare data for analysis, process them and set the type of rank patterns road traffic accident severity rank = f (Regional sociocenosis rank characteristics of the Russian Federation) .
-
4. To analyze the results in the context of the “space of the territory of the Russian Federation – time (2010/2018)”.
-
5. To present conceptual considerations for improving the road safety in the Russian Federation in the spatiotemporal continuum.
To solve these tasks, the researchers of the article propose a methodology based on the consistent use of such tools as the method of ranking features [23]; the method of conducting rank analysis [24]; the method of constructing regression rank patterns [25]; the method of pair comparison of patterns [26].
The results of the study can be used in the development of the Federal Target Program of the Russian Federation on Road Safety for the period 2021–2030, especially due to the necessity to achieve the targets set out in the Road Safety Strategy in the Russian Federation.
Primary analysis of trends in road safety changes in 1991–2019 in the Russian Federation. Comparison of the Russian trend of road safety changes with analogues in other countries
In 2019, in Russia, the level of social risk was HR 2019 = 11.57 deaths in road traffic accidents per 100 thousand people, and road traffic accident severity in 2019 was 7.45%. Table 2 shows statistical data describing the road safety state in Russia in 1970–2019.
The data in Table 2 clearly illustrate the positive dynamics of road safety indicators in Russia over the previous 15 years. At the same time, the Russian road transport system was changing qualitatively. In 1991 – 2019, Russian vehicle fleet grew from 12.1 to 61.8 million units, i.e. more than fivefold. However, the length of highways in the country did not grow so intensively. In particular, in the postSoviet period, the network of public roads in the country increased from 455.4 thousand kilometers 14
Table 2. Dynamics of road safety ind icators in Russia n in 1970–2019
Year Population, thousand people Vehicle fleet, thousand units Number of road traffic accidents, cases per year Number of injuries in road traffic accidents, people per year Number of deaths in road traffic accident, people per year Road traffic accident severity, % 1970 (RSFSR) 130079.2 2881.0 ≈ 120000 ≈ 140000 ≈ 20000 14.29 1980 (RSFSR) 138126.6 7180.0 ≈ 150000 167615 27615 16.48 1990 (RSFSR) 147665.1 11861.0 ≈ 170000 250366 35366 14.13 1991 (RF) 148273.7 12098.0 ≈ 171200 262754 37875 14.41 2000 (RF) 146890.1 24476.0 157596 208995 29594 14.16 2005 (RF) 143474.2 33355.3 222475 307667 33858 11.00 2010 (RF) 142856.3 41649.0 199083 276762 26544 9.59 2015 (RF) 146267.3 56470.0 184000 254311 23114 9.09 2019 (RF) 146780.7 61739.2 164358 227858 16981 7.45 According to: Indicator of road safety state. Official website of the State Road Traffic Safety Authority of the Russian Federation. Available at: (accessed: July 31, 2020).
14 Andrienko L. Period of change. What did the Soviet five-year plans bring to Russian roads? Available at: to 565.5 thousand kilometers15, or 24%. According to R. Smeed’s law [6; 8; 9] the road traffic accident risks are reduced with motorization growth, especially in conditions of a shortage of capacity of cities’ street and road network. But this is not the only and, more important, not the main factor influencing the road safety characteristics. As table 2 shows, the annual number of people dead in road traffic accidents decreased from 23,114 to 16,981 people (or 26%) in four years (2015–2019) while during the same period the total length of roads in the country increased from 528.2 to 565.4 thousand kilometers (or 7%). To a much greater extent, other factors than the characteristics of the road transport system contributed to this process. In particular, the experts of the International Traffic Safety Data and Analysis Group (IRTAD) believe that socioeconomic characteristics or the living standards have a prerogative in terms of importance over other impact factors. They also include demographic indicators that characterize the living standards indirectly. As an argument, the authors can give an example of changes in the post-Soviet period of the macropsychological index of the state of modern Russian society. According to A.V. Yurevich [27], in 2005–2016 the index value increased from 5.47 to 7.04 (Fig. 3). At the same time, road traffic accident rate decreased.
Assessing the global trends of road safety and comparing with them the similar Russian dynamics, it is necessary to note the following main points:
-
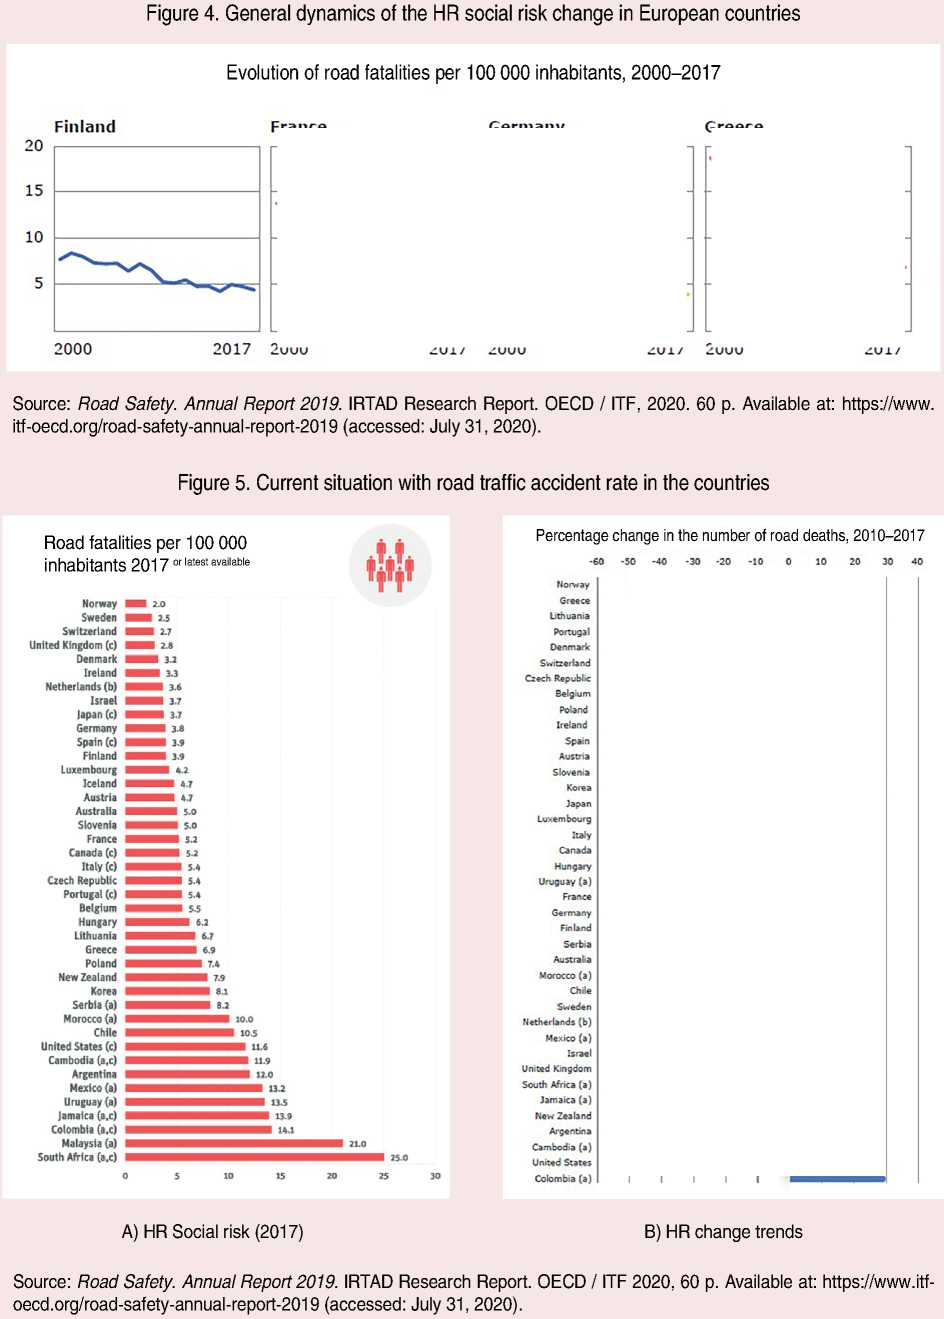
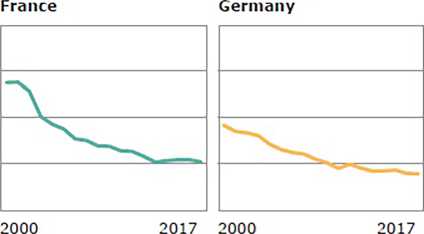
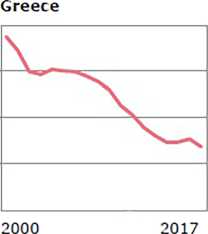
• In all economically developed countries of the world (especially with a specific per capita GDP of more than 30 thousand dollars), indicators characterizing road traffic accidents rates have been steadily decreasing over the previous 15–20 years (Fig. 4) .
-
• The rate of the downward trend (Fig. 5B) varies and depends mainly on the road safety level, actually achieved in the country (the higher road safety level, the lower rate of reduction of car accident). The leaders in the field of road safety
Figure 3. Dynamics of changes in the macropsychological index of the state of modern Russian society
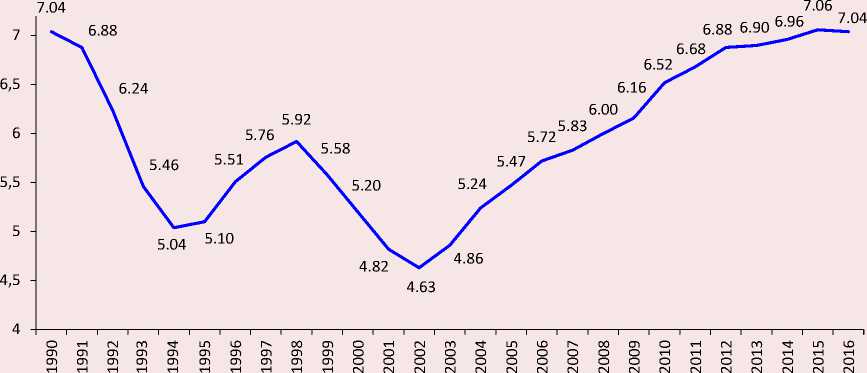
Source: Yurevich A.V. Methodology of quantitative assessment of psychological state of modern Russian society. Methodology and History of Psychology , 2018, vol. 1, pp. 155–173.
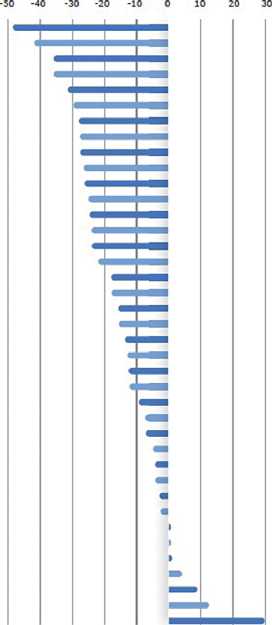
Death rate changes of road accidents (number of deaths per 10 thousand people), 1975–1998
Country or region
Change (%)
Canada
–63.4
China
Hong Kong Special Administrative Region
–61.7
Taiwan Province
–32.0
Sweden
–58.3
Israel
–49.7
France
–42.6
New Zealand
–33.2
USA
–27.2
Japan
–24.5
Malaysia
44.3
India
79.3a
Shri-Lanka
84.5
Lesotho
192.8
Columbia
237.1
China
243.0
Botswana
383.8б
А) In separate countries of the world
Figure 6. Comparative dynamics of changes in HR social risk
Global and regional trends in road traffic accident deaths, 1987–1995
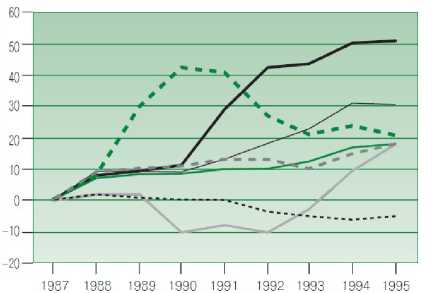
Year
Central and Eastern Europa
Countries with a high level of motorization
Global level
Africa
Asia
Latin America and countries of the Caribbean
B) In the continental context
Source: Peden M. et al. World Report on Traffic Injury Prevention. Moscow. Moscow: Ves Mir, 2004. 280 p.
are the Scandinavian countries (Sweden, Norway, Denmark), Switzerland and the United Kingdom, where the social risk is HR 2016–2018 = 2,0–3,2 deaths in road traffic accident per 100 thousand people; the car accident severity2018 = 2,0–3,5% (Fig. 5A) .
In most countries of Africa and Asia (with a few exceptions), on the contrary, in the previous 20–50 years, the road traffic accident indicators have been gradually increasing (Fig. 6) , and to a greater extent in those states, where the specific per capita GDP does not exceed 1–3 thousand $, and the median age does not exceed 20–22 years16.
In the sphere of ensuring road safety, Russia belongs to the group of countries with catching-up development (HR2019 = 11.57 deaths per 100 thousand people, and the road traffic accident severity2019 = 7.45%), gradually approaching the leading countries (HR2019 = 2.0–2.5 deaths per 100 thousand people, and the road traffic accident severity2019 = 2–3%). An important role in this process is played by a gradual increase in living standards, improving macroeconomic state of modern Russian society [27] and related effects (e.g., the gradual improvement of the vehicle fleet quality with a corresponding increase in the level of active and passive safety; reducing the number of “drunken accident”; the overall growth of the driving culture).
Data and methods of their processing. Rank patterns advantages in the research of sociocenosis features
The problem of qualitative analytics is always related to the quality of quantitative estimates. Any measurement is carried out using the appropriate scales, i.e. an ordered series of marks corresponding to the ratio of successive values of the measured values. There are five types of scales: names, order, intervals, ratios, and absolute values.
Considering the relationship between the sociocenosis features and regional road traffic accident rate, it is worth noting that the most acceptable tool for its assessment is rank patterns, based on the use of an ordinal scale (or rank, or non–metric). The seats of the estimated values in the timeline of the order, referred to as ranks. In such a scale, its constituent numbers are ordered by rank (i.e., occupied places), but the intervals between them cannot be accurately measured. Scale of order or ranking scale allows determining the nature of inequality in the form of judgments of “more – less”, “better – worse”, etc. Given the fact that sociocenosis has no exact boundaries, and, for example, the drivers from a particular region may cause an accident in another region, it is irrational to use the scale relations or absolute values for building pattern link the Road traffic accident severity = f (Socio-economic development characteristics of the Russia’s population). S.D. Haitun says the following about it: “Rank patterns show a fundamental tendency of impact factor on the resulting one, discarding everything small and unimportant for the purposes of analysis” [28, p. 106].
The specifics of parametric identification of the distribution function based on rank analysis are considered in [29], and examples of identification of rank distribution patterns in problems of car accident analysis are considered in [30].
The standard methodology for conducting rank analysis and subsequent construction of rank patterns includes the following stages-procedures [31]:
-
• The definition of the boundaries of the regional sociocenosis . In this case, the authors use the division of Russian territory and its population by the entities of the Federation.
-
• The definition of species forming signs of sociocenosis. The population’s median age, the share of the regional population with income below the minimum wage and the average monthly income of the regional population were selected as such indicators.
-
• A parametric description of the regional sociocenosis . It is worth creating a database on
regional sociocenosis and adding all of the numerical values of the selected representative characteristics of car accident, car accident severity Y and species forming signs of sociocenosis Xi (listed above).
-
• Plotting the rank distribution in the form of a table . The tabulated rank distribution is a table of several (in this case, four) columns: the parameters of the regional characteristic Y , arranged by rank, and the rank number r of the signs of sociocenosis X1-3 . At the same time, the researchers keep the rule of assigning the first rank to Russian region that is characterized by the maximum rating (parameter value), and then in descending order. The most important circumstance to pay attention to is a clear justification of the fundamental relationship between the predictor and the resulting one (an increase or decrease in Y with an increase in the values of X ).
-
• Plotting a graphical rank distribution . This step is desirable, but not mandatory.
-
• Carrying out the procedure for approximating the desired pattern, the Road traffic accident severity rank = f (Rank of the species-forming sociocenosis feature) . The method’s essence is to find such parameters of the analytical dependences that minimize the sum of squares of deviations observed in the course of the ranking analysis of sociocenosis of empirical values of Y from the values calculated by the approximation dependences.
Tables 3 (2010 data) and 4 (2018 data) present sample data (the first and last ten regions of the Russian Federation in the accounting order) used in the construction of the declared dependencies.
The authors have processed the regions’ data in order to construct the corresponding rank distributions. For example, for the 2018 data, the researchers have obtained pairs of values “Median age” – “Road traffic accident severity” (the first and last dozen values), arranged in rank order (Tab. 5) .
Table 3. Road traffic accident severity in the entities of the Russian Federation and the values of representative characteristics of regional sociocenosis, 2010
No. Entity of the Russian Federation Road traffic accident severity, dead per injuries, % Values of the characteristics of regional sociocenosis Median age of the regional population, age Share of the population with income below the minimum wage, % Average monthly income of the population, rubles per month 1 Belgorod Oblast 12.17 39.8 8.4 16,993 2 Bryansk Oblast 10.85 39.9 13.6 13,358 3 Vladimir Oblast 9.16 41.0 18.3 12,956 4 Voronezh Oblast 10.02 41.4 19.1 13,883 5 Ivanovo Oblast 6.28 40.8 20.5 11,124 6 Kaluga Oblast 10.24 40.7 11.4 15,477 7 Kostroma Oblast 6.45 40.5 17.3 13,315 8 Kursk Oblast 8.69 41.7 10.8 14,685 9 Lipetsk Oblast 8.81 40.7 10.0 15,936 10 Moscow Oblast 12.09 39.4 10.3 22,641 76 Republic of Sakha (Yakutia) 9.82 31.2 19.1 23,088 77 Zabaykalsky Krai 13.41 32.9 19.3 14,205 78 Kamchatka Krai 8.04 36.1 19.8 27,010 79 Primorsky Krai 8.25 37.5 16.3 17,298 80 Khabarovsk Krai 9.39 36.3 15.8 22,479 81 Amur Oblast 9.46 35.7 24.3 14,323 82 Magadan Oblast 7.36 37.1 13.8 27,801 83 Sakhalin Oblast 10.02 37.1 10.9 30,727 84 Jewish Autonomous Okrug 10.23 34.8 19.7 15,348 85 Chukotka Autonomous Okrug 20.83 33.6 10.5 38,147 According to: Indicator of road safety state. Official website of the State Road Traffic Safety Authority of the Russian Federation. Available at: ; Russian Regions. Socio-Economic Indicators. 2019. Available at: p/
Table 4. Road accident severity in the entities of the Russian Federation and the values of representative characteristics of regional sociocenosis, 2018
|
No. |
Entity of the Russian Federation |
Road traffic accident severity, dead per injuries, % |
Values of the characteristics of regional sociocenosis |
||
|
Median age of the regional population, age |
Share of the population with income below the minimum wage, % |
Average monthly income of the population, rubles per month |
|||
|
1 |
Belgorod Oblast |
8.83 |
41.1 |
7.5 |
30,778 |
|
2 |
Bryansk Oblast |
10.56 |
41.6 |
13.6 |
26,585 |
|
3 |
Vladimir Oblast |
7.69 |
42.1 |
13.1 |
23,539 |
|
4 |
Voronezh Oblast |
10.31 |
41.7 |
8.9 |
30,289 |
|
5 |
Ivanovo Oblast |
4.45 |
41.9 |
14.7 |
24,503 |
|
6 |
Kaluga Oblast |
8.66 |
41.4 |
10.4 |
29,129 |
|
7 |
Kostroma Oblast |
6.24 |
41.4 |
12.7 |
23,716 |
|
8 |
Kursk Oblast |
8.98 |
42.2 |
9.9 |
27,275 |
|
9 |
Lipetsk Oblast |
9.52 |
42.0 |
8.7 |
30,010 |
|
10 |
Moscow Oblast |
11.44 |
39.3 |
7.3 |
44,707 |
|
76 |
Republic of Sakha (Yakutia) |
8.52 |
33.1 |
18.6 |
42,669 |
|
77 |
Zabaykalsky Krai |
12.52 |
34.8 |
21.4 |
23,992 |
|
78 |
Kamchatka Krai |
6.64 |
37.9 |
15.8 |
48,758 |
|
79 |
Primorsky Krai |
7.91 |
39.2 |
13.9 |
34,619 |
End of Table 4
|
80 |
Khabarovsk Krai |
6.31 |
37.3 |
12.2 |
39,084 |
|
81 |
Amur Oblast |
8.1 |
37.4 |
15.6 |
30,937 |
|
82 |
Magadan Oblast |
8.7 |
39.0 |
9.5 |
59,774 |
|
83 |
Sakhalin Oblast |
9.53 |
38.7 |
8.5 |
51,783 |
|
84 |
Jewish Autonomous Okrug |
9.61 |
37.2 |
23.7 |
24,696 |
|
85 |
Chukotka Autonomous Okrug |
5.71 |
36.1 |
8.8 |
78,812 |
According to: Indicator of road safety state. Official website of the State Road Traffic Safety Authority of the Russian Federation. Available at: ; Russian Regions. Socio-Economic Indicators. 2019. Available at: p/
Table 5. Sample data used in the construction of rank dependencies, 2018
|
No. |
Median age of the regional population, age |
Road traffic accident severity, dead per injuries, % |
No. |
Median age of the regional population, age |
Road traffic accident severity |
|
|
1 |
26.0 |
21.76 |
76 |
42.1 |
5.86 |
|
|
2 |
28.4 |
18.41 |
77 |
42.2 |
5.71 |
|
|
3 |
28.8 |
14.39 |
78 |
42.2 |
5.67 |
|
|
4 |
30.4 |
13.55 |
79 |
42.2 |
5.52 |
|
|
5 |
33.1 |
12.52 |
80 |
42.3 |
5.22 |
|
|
6 |
33.6 |
12.27 |
81 |
42.3 |
5.21 |
|
|
7 |
34.4 |
11.44 |
82 |
42.7 |
4.65 |
|
|
8 |
34.8 |
10.82 |
83 |
42.8 |
4.45 |
|
|
9 |
34.8 |
10.56 |
84 |
43.2 |
4.25 |
|
|
10 |
34.9 |
10.56 |
85 |
43.7 |
2.93 |
According to: Indicator of road safety state. Official website of the State Road Traffic Safety Authority of the Russian Federation. Available at: ; Russian Regions. Socio-Economic Indicators. 2019. Available at: p/
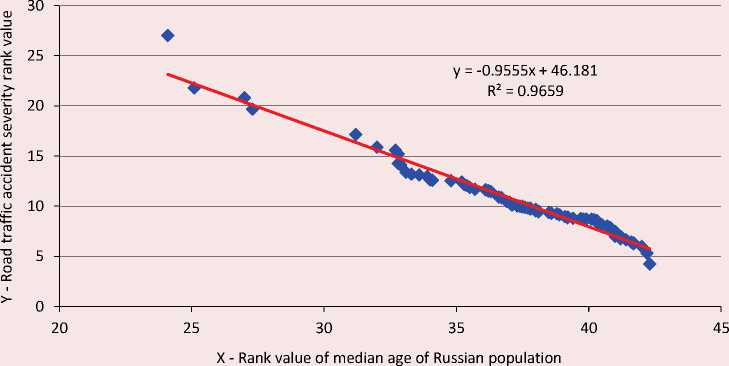
It is important to focus on the fact that, when constructing a rank distribution, it is necessary to understand in advance the fundamental physical meaning of the relationship between the variables X and Y . For example, for the dependence of the Road traffic accident severity = f (Median age of the regional population) , the leftmost points identify the Chechen Republic ( Y1 – Road traffic accident severity = 21.76 deaths per 100 injuries; X1 – Median age = 26.0 years) and the Republic of Tyva ( Y2 – Road traffic accident severity = 18.41 deaths per 100 injuries; X2 – Median age = 28.4 years). The rightmost point rank based on identify most regions of the Central Federal District of the Russian Federation, for which Yi is the minimum value, Xi is the highest in the data set values. It means that according to the Road traffic accident severity rank = f (Rank of the median age of Russian population) characteristic is inversely proportional to a linear connection.
The subsequent analysis has showed that for the dependence of the Road traffic accident severity = f ( Rank of the share of Russian population with income below the minimum wage) characteristic is directly proportional linear connection, and according to the Road traffic accident severity = f (Rank of the average monthly income of the population) – a power connection.
Research results and their analysis
This section presents rank patterns of the impact on the road traffic accident severity of such characteristics of regional sociocenosis as the median age; the share of the population with income below the minimum wage; the average monthly income of the population.
Figures 7–12 graphically show the rank patterns. For the convenience of identifying temporary changes in the situation in the field of road safety, the patterns are constructed for a set of data from 2010 and 2018.
Comparing the patterns of the Road traffic accident severity rank = f (Sociocenosis characteristic rank) in 2010 and 2018 (Tab. 6, 7, 8) the authors note the main fact for all three patterns. In general, the severity of the road traffic accident outcome in 2018 decreased slightly compared to 2010.
The parameter value a of the patterns (1)–(3) proves this statement. At the same time, each of the patterns is characterized by certain specifics.
Road traffic accident severity rank pattern = f (Rank of the median age of Russian population) . Figures 7–8 show graphic images of the pattern (1).
Figure 7. Rank pattern (according to 2010 data)
Road traffic accident severity rank = f (Rank of the median age of Russian population)
Source: own calculations.
Figure 8. Rank pattern (according to 2018 data)
Road traffic accident severity rank = f (Rank of the median age of Russian population)
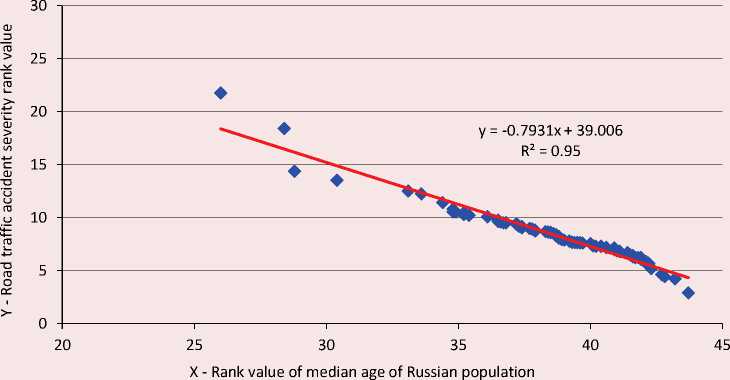
Source: own calculations.
Table 6. Parameters and coefficient of determination R2 of the pattern (1)
Road traffic accident severity rank = f (Rank of the median age of Russian population)
|
Year |
Numerical values of the pattern parameters (1) Y = a - b · X |
R2 |
|
|
a |
b |
||
|
2010 |
46.18 |
0.955 |
0.965 |
|
2018 |
39.00 |
0.793 |
0.950 |
|
Source: own calculations. |
|||
Table 6 shows the numerical values of the pattern parameters (1) that are typical for the compared databases taking into account the median age of the regional sociocenosis.
Comparing the patterns of the Road traffic accident severity rank = f (Rank of the median age of Russian population) in 2010 and 2018, it is worth noting the following:
-
• In 2018, the median age played a much smaller role in determining the road traffic accident outcome in terms of severity than in 2010. The value of the pattern parameter b proves it (1).
-
• Both in 2010 and in 2018 in a number of Russian regions (about 10% of the total number) the car accident severity was significantly different from the typical national level. These are mainly national republics with a fairly young population.
Road traffic accident severity rank pattern = f (Rank of the share of Russian population with income below the minimum wage) . Figures 9–10 show the graphic images of the pattern (2).
Table 7 shows the numeral values of the required pattern parameters (2).
Comparing the patterns of the Road traffic accident severity rank = f (Rank of the share of Russian population below the minimum wage) in 2010 and 2018, it is worth noting the following:
-
• In 2018, the share of Russian population with income below the minimum wage played a significantly smaller role in shaping the road traffic accident outcome in terms of severity than in 2010. The value of the pattern parameter b indicates it (2).
-
• In the pattern of 2018, the number of Russia’s regions, where the road traffic accident
Figure 9. Rank pattern (according to 2010 data)
Road traffic accident severity rank = f (Rank of the share of Russian population below the minimum wage)
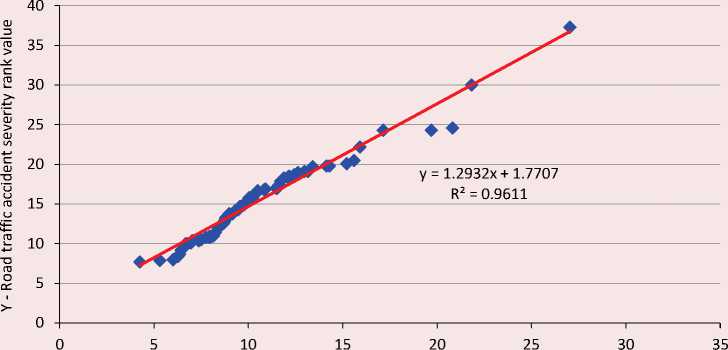
X - Rank value of share of the population with income below minimum wage
Source: own calculations.
Figure 10. Rank pattern (according to 2018 data)
Road traffic accident severity rank = f (Rank of the share of Russian population below the minimum wage)
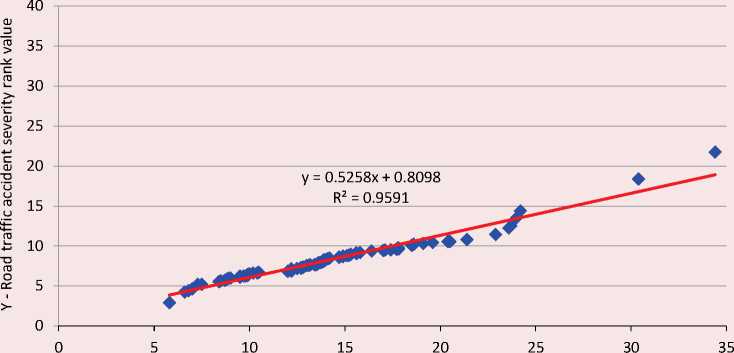
X - Rank value of share of the population with income below minimum wage
Source: own calculations.
Table 7. Parameters and coefficient of determination R2 of the pattern (2)
Road traffic accident severity rank = f (Rank of the share of Russian population below the minimum wage)
Road traffic accident severity rank pattern = f (Population’s average monthly income rank). Figures 11–12 show graphical representations of the pattern (3). Table 8 shows the numerical values of the pattern parameters (3) of the Road traffic accident severity rank = f (Population’s average monthly income rank) .
It is necessary to note that the numerical values of the exponent of the patterns (indicator b) for 2010 and 2018 are the same (b = -0.82). This suggests that the spatial heterogeneity of the regional road traffic accident severity in relation to the average income has not changed. The “right tail” of dependence has lengthened which characterizes both an increase in the living standards and inflationary processes in Russian regions.
Conceptual considerations for improving road safety in the Russian Federation in the spatiotemporal continuum
The purposes of the Road Safety Strategy are highly specific and incredibly ambitious. Russia should achieve 4.0 deaths per 100 thousand people (or about 6 thousand deaths in road traffic accidents per year) for 2024 in the field of road safety target levels of social risk, and 0 deaths per 100 thousand people – by 2030. It took Russia a decade and a half to double the annual death toll (2005–2019),
Figure 11. Rank pattern (according to 2010 data)
Road traffic accident severity rank = f (Population’s average monthly income rank)
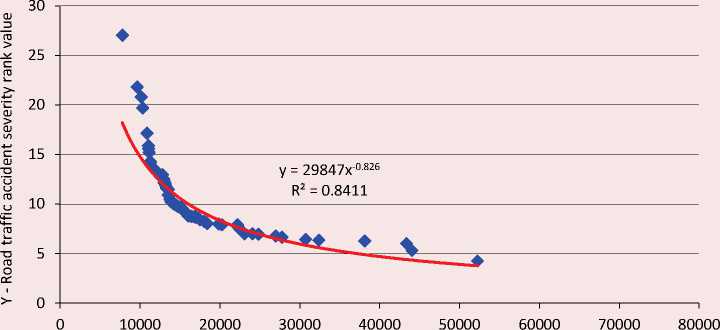
X - Rank value of the average monthly income, rubles per month
Source: own calculations.
Figure 12. Rank pattern (according to 2018 data)
Road traffic accident severity rank = f (Population’s average monthly income rank)
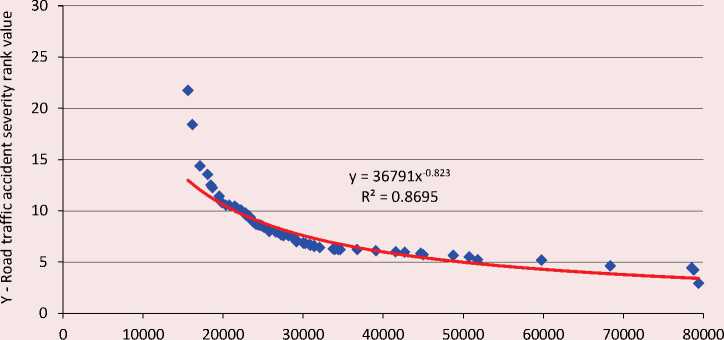
X - Rank value of the average monthly income, rubles per month
Source: own calculations.
Table 8. Parameters and coefficient of determination of R2 pattern (3) Road traffic accident severity rank = f (Average monthly income rank)
Using the methods of synectics [34] and analogies [35], and the results of the author’s research [36; 37], the article states that, in Russia’s spatiotemporal continuum, the problems of improving road safety are largely determined by the demographic and socio-economic specifics of Russian living conditions. It is practically impossible to imagine that relatively young and poor society of the republics of the North Caucasus will daily manifest the safe behavior principles on the roads in the same way as relatively more mature and economically successful citizens that form the sociocenosis basis of the regions of Central and Northwestern Federal Districts of the Russian Federation. In this regard, the researchers note the need to differentiate the state policy in the field of ensuring road safety taking into account the regional characteristics of the population’s behavior of federal districts and even particular Russian regions.
Currently, the federalization principles imply the Russian Federation as a single state political and legal legislative space, within the boundaries of which all aspects of public administration are uniform. However, despite some slight convergence of the country’s regions in terms of road traffic accident characteristics, the gap between the relatively safe regions and their antipodes-regions with a high risk of death in a road traffic accident is still very high. The statistics of the State Road Traffic Safety Authority of the Ministry of the Interior of the Russian Federation and the pattern (2) show a four-fold difference in the car accident severity between the most and least safe regions.
In fact, currently, all measures to improve the road safety in the regions have three sources of funding: from the federal, regional and municipal budgets. Relatively rarely, funds for measures to improve road safety are allocated from extrabudgetary sources. How should the share of budget expenditures for items related to road safety provision correctly be determined? Nowadays, in most Russia’s regions, the share of budget expenditures for ensuring the regional programs’ implementation does not exceed 0.1–0.3% of the budget resources. For example, according to the Federal Target Program for Road Safety (2013– 2020)17, in 2017, the maximum amount of actual expenditures under the Road Safety Program among the regions was recorded in the Republic of Tatarstan – 1,722 million rubles with annual budget expenditures in the amount of 231,088 million rubles18. In 2017 in the Republic of Tatarstan the unit costs of measures to road safety improvement were 0.745% of the total amount of annual budget expenditures. Perhaps, it is this factor that has allowed the territory to be in the group of leading regions for road safety for a decade. Of course, it is necessary take into account the regional budgeting opportunities which are very different for the
Table 9. Differentiated approach to financing of regional road safety programs
|
Group of entities of the Russian Federation |
Example of a representative entity of the Russian Federation |
Actually achieved level (2018) of road traffic accident severity |
The share size of regional budget expenditures under the item “Road safety ensuring”, % |
|
I |
Moscow |
4.25 |
0.20 |
|
II |
Republic of Tatarstan |
6.24 |
0.35 |
|
III |
Republic of Bashkortostan |
9.06 |
0.50 |
|
IV |
Zabaykalsky Krai |
12.52 |
0.65 |
|
V |
Chechen Republic |
21.76 |
0.80 |
|
Source: own calculations. |
|||
Russian entities. Nevertheless, it is the entities of the Federation that ought to bear the main burden of responsibility for solving regional problems, and it is the regional budget that should be rationally structured.
Table 9 shows the authors’ proposals for the specific amount of budget expenditures under the item “Road safety ensuring” taking into account the current car accident state in the regions.
Conclusion
Summarizing the results, presented above in the form of final conclusions, the authors note the following.
Road traffic accident, as an objective manifestation of the achieved road safety level, is changing in time and space. The specific of this change depends on the dynamics of sociocenosis characteristics. In turn, the sociocenosis is changing in time and space, primarily essentially, at the level of universal values. Not only the results of this article, but also data of R. Fisher and D. Beer [38], confirm the conclusion.
In recent years (2010–2019), Russia has achieved quite serious success in the field of ensuring road safety, but it is still among the countries of catching up development.
Road traffic accident severity, as a very representative indicator of car accident, varies in a very wide range of values in Russian regions (even without considering the federal cities of Moscow and St. Petersburg in 2018, this range was [4,5-21,5]). This fact once again characterizes Russia as the largest country in the world, and it is extremely heterogeneous in the manifestations of life conflicts.
Road traffic accident severity rank patterns = f (Socio-cenosis characteristics rank) identify the statistical relationship between demographic and socio-economic living conditions in Russian regions and car accident as a generalized abstract resultant of living standards.
Analysis of the road traffic accidents severity rank patterns = f ( Sociocenosis characteristics rank ) showed that in 2018, compared to 2010, has changed the degree of influence of the Russian sociocenosis on the road traffic accident formation. In particular, the numerical values of the pattern parameter b, which identifies the connection degree between the predictor and the outcome, decreased for the influence cases of the median age and the share of the population with income below the minimum wage. At the same time, in 2010–2018, the impact on the road traffic accident severity of the regional average monthly income of the population did not change. This fact once again suggests that the criterion “The average monthly income of the population” can not fully be an economic indicator.
Road traffic accident severity rank patterns = f (Socio-cenosis characteristics rank ) also illustrate the spatial features of road traffic accident in Russia. In particular, the road traffic accident severity varies very widely in the spatial context reaching maximum values in the national border regions (republics of the North Caucasus, Kalmykia, Tyva, and Buryatia).
The proposed differentiation of the regional approaches to the required financing of road safety programs is based on the research results of the statistical relationship between the results achieved by 2018–2020 in the field of road safety provision and actual sociocenosis characteristics. The authors believe that, if Russia’s regions focus management attention on the need to improve the road safety (their importance awareness, the formation of targeted approaches, increased funding), the country will form objective conditions for achieving the ambitious goals of the Road Safety Strategy of the Russian Federation.
In conclusion, it is necessary to note that the methods and practices of road safety management in the constituent entities of the Russian Federation should take into account regional specifics not only in terms of financing regional road safety programs, but also at the level of organizing traffic and pedestrian flows, means of influencing violators of traffic regulations, and other specific aspects of road safety.
References Road traffic accident rate in Russia: main socio-economic factors of its formation and spatio-temporal features
- Prokhorov B.B., Shmakov D.I. Estimating the cost of statistical life and economic damage from health losses. Problemy prognozirovaniya= Studies on Russian Economic Development, 2002, no. 3, pp. 125–135 (in Russian).
- Prokhorov B.B., Shmakov D.I. Causes of people’s death in peacetime and economic assessment of the value of losses. Problemy prognozirovaniya= Studies on Russian Economic Development, 2013, no. 4 (139), pp. 139–147 (in Russian).
- Bykov A.A. On the methodology of economic assessment of the life of the average person (explanatory note). Problemy analiza riska=Issues of Risk Analysis, 2007, vol. 4, no. 2, pp. 178–191 (in Russian).
- Blincoe L.J., Miller T.R., Zaloshnja E., Lawrence B.A. The Economic and Societal Impact Of Motor Vehicle Crashes. Washington DC: National Highway Traffic Safety Administration. 2010. 304 p.
- Rotenberg R.V. Osnovy nadezhnosti sistemy Voditel’ – Avtomobil’ – Doroga – Sreda [Reliability Fundamentals of the System Driver – Vehicle – Road – Environment]. Moscow: Mashinostroenie, 1986. 216 p.
- Blinkin M.Ya. Bezopasnost’ dorozhnogo dvizheniya: istoriya voprosa, mezhdunarodnyi opyt, bazovye institutsii [Road Safety: Background, International Experience, Basic Institutions]. Moscow: HSE Publishing, 2013. 240 p.
- Beeck E. van, Borsboom G.J.J., Mackenbach J.P. Economic development and traffic accident mortality in the industrialized world, 1962–1990. International Journal of Epidemiology, 2000, vol. 29, рp. 503–509. DOI: 10.1093/intjepid/29.3.503
- Smeed R.J. Some statistical aspects of road safety research. Journal Royal Statistics, 1949, A (I), рp. 1–34.
- Smeed R.J. Variations in the pattern of accident rates in different countries and their causes. Traffic Engineering and Control, 1968, no. 10, рp. 364–371.
- Adams J.G.U. Risk and Freedom: the Record of Road Safety Regulation. Cardiff: Transportation Publishing Projects, 1985. 202 p.
- Chang L.-Y., Chen W.-C. Data mining of tree-based models to analyze freeway accident frequency. Journal of Safety Research, 2005, vol. 36, no. 4, pp. 365–375.
- Chong M.M., Abraham A., Paprzycki M. Traffic accident analysis using machine learning paradigms. Informatica, 2005, vol. 29, no. 5, pp. 89–98.
- Abellan J., Lopez G., de Ona J. Analysis of traffic accident severity using decision rules via decision trees. Expert Systems with Applications, 2013, vol. 40, no. 15, pp. 6047–6054.
- Gnatyuk V.I. Filosofskie osnovaniya tekhnotsenologicheskogo podkhoda [Philosophical Foundations of the Technocenological Approach]. Kaliningrad: Izd-vo KITs «Tekhnotsenoz», 2014. 284 p.
- Kudrin B.I. Research of technical systems as communities of products – technocenoses. In: Sistemnye issledovaniya: metodologicheskie problemy. Ezhegodnik 1980 [Systems research: Methodological problems. Yearbook 1980]. Moscow: Nauka, 1981. Pp. 236–254 (in Russian).
- Kudrin B.I. Problems of creation and management of cenoses of artificial origin. In: Kiberneticheskie sistemytsenozov: Sintez i upravlenie [Cybernetic cenoses systems: Synthesis and control]. Moscow: Nauka, 1991. Pp. 5–17 (in Russian).
- Evans L. Traffic Safety. Bloomfield, Mich.: Science Serving Society, 2004. 457 p.
- Korotaev A.V. et al. Vliyanie stareniya naseleniya na global’nuyu sistemu tsennostei i politicheskuyu dinamiku [Impact of Population Aging on the Global Value System and Political Dynamics]. Moscow: RANKh i GS pri Prezidente RF, 2018. 47 p.
- Koornstra M. J. Prediction of traffic fatalities and prospects for mobility becoming sustainable safe. Sadhana, 2007, vol. 32, pp. 365–395.
- Elvik R. A review of game-theoretic models of road user behavior. Accident Analysis & Prevention, 2014, vol. 62, pp. 388–396.
- Reinfurt D.W., Stewart J.R., Weaver N.L. The economy as a factor in motor vehicle fatalities, suicides and homicides. Accident Analysis and Prevention, 1991, vol. 23, pp. 453–462.
- Wagenaar A. C. Effects of macroeconomic conditions on the incidence of motor vehicle accidents. Accident Analysis and Prevention, 1984, vol. 16, pp. 191–205.
- Shashua A., Levin A. Ranking with large margin principle: Two approaches. In: Proceedings of Advances in Neural Information Processing Systems, 2003, no. 6, pp. 961–968.
- Hettmansperger T. Statisticheskie vyvody, osnovannye na rangakh [Statistical Inference Based on Ranks]. Moscow: Finansy i statistika, 1987. 332 p.
- Kuz’minov A.N. Conceptual model of cenological management in socio-economic systems. Terra Economicus, 2009, vol. 7, no. 2, part 2, pp. 28–32 (in Russian).
- Beshelev S.D., Gurvich F.G. Matematiko-statisticheskie metody ekspertnykh otsenok [Mathematics-Statistical Methods of Expert Estimates]. Moscow: Statistika, 1974. 264 p.
- Yurevich A.V. The quantitative estimation methodology of modern Russian society’s psychological state. Metodologiya i istoriya psikhologii=Methodology and History of Psychology, 2018, no. 1, pp. 155–173 (in Russian).
- Haitun S.D. Problemy kolichestvennogo analiza nauki [Problems of Quantitative Analysis of Scientific Activities]. Moscow: Nauka, 1989. 280 p.
- Kolesov V.I., Danilov O.F. Rank analytics in technological problems. In: Sostoyanie, tendentsii i problemy razvitiya neftegazovogo potentsiala Zapadnoi Sibiri: mat-ly mezhdunar. konf. [State, trends and problems of development of oil and gas potential of Western Siberia: Materials of the international conference]. Tyumen: TIU, 2018. Pp. 274–279 (in Russian).
- Kolesov V.I. Identification of rank distribution models in the analysis of road accidents in the country. In: Energosberezhenie i innovatsionnye tekhnologii v toplivno-energeticheskom komplekse: mat-ly mezhdunar. nauch.- praktich. Konferentsii [Energy saving and innovative technologies in the fuel and energy complex: Materials of the international research-to-practice conference]. Tyumen: TIU, 2016. Pp. 275–280 (in Russian).
- Petrov A.I. Tekhnotsenozy, sotsiotsenozy, rangovye i Pareto-raspredeleniya v otsenke regional’nykh osobennostei bezopasnosti dorozhnogo dvizheniya [Technocenoses, Sociocenoses, Rank and Pareto Distributions in the Assessment of Regional Features of Road Safety]. Tyumen: TIU, 2019. 179 p.
- Christie N., Ward H., Kimberlee R., Lyons R., Towner E., Hayes M., Robertson S., Rana S., Brussoni M. Road
- Traffic Injury Risk in Disadvantaged Communities: Evaluation of the Neighbourhood Road Safety Initiative. Department for Transport: London, 2010.
- Lyons R., Jones S., Deacon T., Heaven M. Socioeconomic variation in injury in children and older people: a population based study. Injury Prevention, 2003, no. 9, pp. 33–37.
- Gordon W.J.J. Sinectics: The Development of Creative Capacity. New York. 1961. 180 p.
- Uemov A.I. Analogiya v praktike nauchnogo issledovaniya [Analogy in the Practice of Scientific Research].Moscow: Nauka, 1970. 264 p.
- Petrov A.I. Osobennosti formirovaniya avtotransportnoi avariinosti v prostranstve i vremeni [Specifics of Formation of Road Traffic Accident Rate in Space and Time]. Tyumen: Izd. TyumGNGU, 2015. 254 p.
- Kolesov V.I., Petrov A.I. Analysis of the transport culture of the population. Transport. Nauka, tekhnika, upravlenie=Transport: Science, Equipment, Management. Scientific Information Collection, 2015, no. 6, pp. 20–22 (in Russian).
- Fisher R., Boer D. Values: the dynamic nexus between biology, ecology and culture. Current Opinion in Psychology, 2016, no. 8, pp. 155–160. DOI: 10.1016/j.copsyc.2015.12.009
