Robustness Evaluation for Military Communi-cation Effectiveness based on Multiple Data Sources and Monte Carlo Simulation

Author: Fuli Shi, Chao Li, Yifan Zhu
Journal: International Journal of Modern Education and Computer Science (IJMECS) @ijmecs
Article in issue: 5 vol.3, 2011.
Free access
In the choice process of optimal military commu-nication (MC) alternative, evaluation data mainly come from expert judgments, simulation results and test bed data, and they cannot be directly used in evaluation because of differences in form and attribute; and the MC environment changes rapidly as the operation tempo increasing. It is an important effort to judge the effectiveness robustness of MC alternative, since both the evaluation data and the MC envi-ronment are full of uncertainty. A robustness evaluation method based on multiple data sources and Monte Carlo simluation is proposed with respect to the characteristics of them. Mainly include Belief map as data expression form; Regression relational model built with Support Vector Re-gression (SVR) to acquire simulation data’s confidence with test bed data as training example; Extensive Bayesian Algo-rithm (EBA) to fuse data from multiple sources; Beta distri-bution fitting method for each criterion of each alternative by using the fused results; and calculation of the Probability of Best (PoB) of each alternative through Monte Carlo simu-lation. Take MCE evaluation of a Naval Vessels Fleet as an example, the proposed method is compared with some gen-eral methods. The results indicate that the proposed method helps to obtain relatively conservative alternative and is effective in guaranteeing the robustness.
Military communication effectiveness, ro-bustness evaluation, data fusion, Monte Carlo simulation, Probability of Best
Short address: https://sciup.org/15010258
IDR: 15010258
Text of the scientific article Robustness Evaluation for Military Communi-cation Effectiveness based on Multiple Data Sources and Monte Carlo Simulation
Published Online August 2011 in MECS
Military communication (MC) is an important material foundation for achieving information superiority in informationization and networked operations. So analyzing and evaluating military communication effectiveness (MCE) and its contribution to operations is a significant research task. In order to satisfy future uncertainty demands for communication within military applications, we need to choose the robustest MC alternative, i.e. it must have robust effectiveness. Therefore, how to judge the robustness of MCE is an important effort. It’s also a difficult effort since both the evaluation data and the MC environment are full of uncertainty.
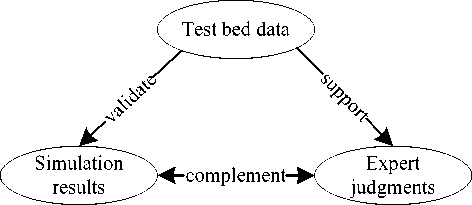
Evaluation data is a foundational component in the evaluation process of MCE. It has important influence to the evaluation result. It mainly comes from expert judgments, simulation results and test bed data, and these data cannot be directly used to evaluate MCE because they are very different in form and in attribute. The differences of these three kinds of data can be summed up as follows:
-
• Expert – The Evaluation information provided by experts is qualitative and subjective, and cannot reflect the dynamic property of MC.
-
• Simulation – At present, the simulation results of MC are all numerical, and cannot express some qualitative information of evaluation criteria. Furthermore, it is difficult to validate the validity of simulation model while it has influences on the credibility of simulation results.
-
• Test bed – The data from Test bed have high credibility. But due to the limitations of economy, technology and communication bandwidth, it is difficult to implement large-scale network experimentation on test bed, and only partial experimentation such as test network protocols or routes can be implemented on test bed.
Note that it is a right way to improve the credibility and robustness of evaluation results of MCE by means of collecting and fusing the data from many viewpoints. But there are two problems in the fusion process of multiple data sources. First, the forms of these data are heterogeneous. Second, not every criterion can get its value from these sources simultaneously. Therefore, it is necessary to unify these data in a common form, and fuse them to get more credible criterion values.
Manuscript received March 16, 2011; revised April 15, 2011; accepted June 1, 2011.
Additionally, the conventional choice method of optimization MC alternatives is to rank directly based on evaluation results. The common methods of MCE evaluation are such multi-attribute decision making ones as TOPSIS( the technique for order preference by similarity to ideal solution), AHP(analytic hierarchy process), utility function method and weighted sum method[1][2], in which case a kind of ordering can be merely gotten about the evaluated values. In fact, the same system and crite-rions may have different values under different conditions. However, with the development and applications of network centric warfare (NCW), the MC environment is always changed rapidly and full of uncertainty. So how to reflect the uncertainty of communication environment in the process of effectiveness evaluation is another problem.
Huang [3] proposed a two data sources (expert judgments and simulation results) fusion method in the evaluation process of weapon equipment operational effectiveness. He has not considered data from test beds or combat exercises. But these data can be used to validate the degree of simulation model’s validity. This paper consults Huang’s work and Monte Carlo simulation to minimize the uncertainty in the evaluation process of MCE, and proposes a robustness evaluation framework of MCE which synthesizes the expert judgments, simulation results, test bed data and the uncertainty of communication environment in the evaluation process.
The rest of this paper is organized as follows. Section II describes some foundational theories which are used in this paper. Section III presents the applications of five key technologies and the framework of robustness evaluation based on multiple data sources fusion and Monte Carlo simulation. Section IV gives an application to demonstrate the proposed method. Section V summarizes this paper.
-
II. Foundational theories
This section describes some foundational theories which are used in the proposed method.
-
A. Belief Map
0.9
0.8
0.7
0.6
A belief map [4] is a tool help designer to picture and understand evaluation of concepts using beliefs. Belief is the confidence placed on an alternative’s ability to meet a target by a criterion or requirement, based on current knowledge. And Belief can be expressed on a belief map. A belief map organizes 2-dimensions of belief: knowledge and confidence. Knowledge is a measure of the information held by an expert about a criterion value of an alternative. If the required information was not known to the expert, then the probability is 0.5, if fully known, then it would be 1. Confidence can be associated with probabilities. If there is confidence that the criterion value of an alternative fully meet the target, then the probability is 1 (100%). Probability is 0 if the criterion value fails to meet the target at all.
In a belief map (see Fig.1), the knowledge Kc , a , p and confidence C of point S are 0.8 and 0.55 respec- c 1, a 1, p 1 c 1, a 1, p 1
tively, point Sc , a , p denotes the expert has a belief of 53%
S c
S
0.4 и
0.3
0.2
0.1

0 0.1 0.2 0.3 0.4 0.5 0.6 0.7 0.8 0.9 1.0
Knowledge Kc , a , p
Figure 1. Belief Map
(0.8*0.55+0.2*0.45=0.53) that the criterion value of an alternative will meet the mission requirements.
-
B. Support Vector Regression
Support vector regression (SVR) is a particular implementation of Support Vector Machines [1]. It’s known that SVR is to learn an unknown function f based only on a training set of l input-output pairs { x,, y , } i = 1, l , l in a black box modeling approach. For the linear case, f is given by:
f ( x ) = (w • x) + b . (1)
Where (w • x) is the dot product between w and x .
The non-linear case is referred to as the kernel function [1] and represented by k ( x , x ' ) , where x and x ' are input vectors. Tab.1 lists some common kernel functions.
Applying the kernel function to the dot product of input vectors, we obtain:
max <
- 1 i (a* - a )( a * - “ / ) k ( x , x j 2 , , j = 1
-£ £ ( a , + a У£У1 ( a-a * )
)
Subject to <
i (
* a , - a ,
) = 0
a , , a , * g[ 0, C ]
Replacing the dot product in (1). The SVR approximation becomes:
TABLE I.
Common kernel functions[1]
|
Linear |
k ( x , x ' ) = x T x ' |
|
Polynomial |
k ( x , x ' ) = (x • x ’) d |
|
Gaussian |
k ( x , x ' ) = exp ( -| |x - x '| 2 J ^c2 2 ) |
|
Sigmoid |
k ( x , x ' ) = tanh ( ^ x • x '^ + 5 ) |
|
Inhomogeneous Polynomial |
k ( x , x ' ) = (( x • x '^ + c ) |
l
f(x) V(a a)k(x-,x)+ b.
i = 1
Using Karush-Kuhn-Tucker conditions [6] calculate:
b = averagek U + yk-f (а,- а*) k (x„ x k)}.(4)
L ,=i
Where, a , and a , * are Lagrange multipliers, k ( x , , x ) = Ф T ( x i ) -Ф ( x ) is a kernel function satisfies Mercer condition.
-
C. Extens ve Bayes an Algor thm
Bayesian theory [7] described in statistics is: E is an experiment, S is the sample space of E , A is an event of E , B 1 , B 2, l , B n are partitions of S , and P ( A ) > 0 , then
P ( B -| A ) = P ( AB ) P ( B )/ Z P ( AB ) P ( B j ) . (5)
i = 1,2, l , n .
m
P (6 = Y ) = а П( ck +(1 — c )(1 — k)) p f ‘=1 ' a. (6)
mm а = 1/1 П(ck + (1 -c)(1 -k))p,+П(c(1 -k) + (1 -c)k)p, I
Formula (6) is similar to the Bayesian pattern, so it is called Extensive Bayesian algorithm (EBA). Where, P ( 6 = Y ) represents the integrated probabilities of all team members what consider the decision alternative satisfying the requirements of objectives, [ k , c ] p represents the knowledge and confidence of a team member p on the judgment, a is a normalization factor, P = { p 1 , p 2 , L , p m } is the set of team members.
-
D. Beta D str but on
The general formula for the probability density function of the beta distribution [9] is f (x )=(?x aLa b a+в-i, a - x - b; p, q > °. (7)
B ( а , в )( b — a )
Where a and в are the shape parameters, a and b are the lower and upper bounds, respectively, of the distribution, and B ( а , в ) is the beta function. The beta function has formula
B ( а , в ) = [1 t a - 1 (1 - 1 ) в - 1 dt . (8)
The case where a = ° and b = 1 is called the standard beta distribution. The standard beta distribution equation is f (x ) = -—(X)— ,° - x -1, а, в > °. (9)
v ’ B ( а , в )
A common approach to determine a distribution in the absence of data is to assume a beta distribution. Because the Beta distribution has finite limits and it can be approached many distributions when the parameters are adjusted. Such as it is the standard uniform distribution when a = в = 1 , the standard normal distribution when a = в = 4 , etc, which are all special cases of the beta distribution. So the Beta distribution is an attractive candidate for the value distribution of criterion.
-
E. Monte Carlo S mulat on
Monte Carlo Analysis is a computer-based analysis method developed in the 1940's [10]. It uses statistical sampling techniques in obtaining a probabilistic approximation to the solution of a mathematical equation or model. In the context of Monte Carlo analysis, simulation is the process of approximating the output of a model through repetitive random application of a model’s algorithm. Its merits are: vulnerable to geometry within limits; convergence rate irrelevant to dimensionality; capable of calculating multiplied alternatives and unknown quantities; easy to identify error; and easy to accomplish because of uncomplicated program process.
-
III. Framwork of robustness evaluation
In order to deal with the problem occurred in the evaluation process, on the one hand, the relationships among evaluation data sources are presented and showed on Fig.2. The focus of evaluation data fusion in this research is how to validate the validity of simulation data using test bed data. It is impossible to use test bed data validate the simulation data directly. Because implementing test bed experiments on evaluation object may be large-scale network and too difficult, it is necessary to build a prediction model with test bed data. There are many methods to build prediction models, such as least squares, neural networks, SVR and so on [11]. Among all these methods, only SVR can avoid curse of dimensionality and overfitting problems. Therefore, SVR was adopted to build the prediction model in the fusion process of evaluation data. On the other hand, the Monte Carlo simulation was used
to describe the uncertainty of communication environment in the process of effectiveness evaluation. And the simulation model is based on criteria’ Beta distribution models which are fitted from the fusion result of multiple data sources.
c = t
£ - £
£
£ > £
£ < £ .
£ = 0
-
A. Unify the Multiple Data in a Common Form
Data in the evaluation process of MCE is either quantitative or qualitative. In order to unify the form of evaluation data, belief map is used as a tool to express heterogeneous data commensurably.
Experts can provide qualitative information for criteria, both the knowledge and confidence of criteria can be provided by experts directly. Simulations can provide quantitative information for criteria, and criteria’s utility value can be taken as their knowledge, the confidence of them can be provided by prediction models which are built using test bed data and SVR.
Using the abscissa of belief map (see Fig.1) represents the knowledge of an expert, is denoted as Kc,a,p (Kcap G[0,1]). That is to say, Kc a p represents the amount of knowledge the expert p has about the alternative a satisfy the criterion c . Similarly, using y-axis represents the confidence of an expert, is denoted as Cc,a, p ( Ccap G[0,1] ), and Ccap represents the confidence the expert p has about the alternative a satisfy the criterion c . And in the proposed method a simulation was taken as a virtual expert. Therefore any point Sr„ JKr„„,Cr„ „) in a belief map denotes an expert’s c,a, p c,a, p c,a, p preference about a value of an evaluation criterion.
-
B. Compute Confidence of Simulation Data
In this research, we take test bed data as training sets to build regression relational models between network parameters (NP, such as wireless bandwidth, wired bandwidth, exchange capacity, process capacity, service access capacity, relay types ans so on) and measures of performance (MOP, i.e. the lowest criteria, such as call completing rate) using SVR. And then compute the confidence of simulation data. The steps are:
-
1) Definite the criteria which are need to acquire confidence. Unify the dimension of test bed data and simulation data about these criteria .
-
2) Take training sets T = { ( x i , y i ) | i = 1,2, l , N } from test bed data, where x i e X c R " , y i e Y c R .
-
3) Select appropriate parameters £ > 0 , C > 0 and Kernel Function K ( x , x ') , solving quadratic programming problem (2) to get the optimal solution
( * ) * *
a ( ) = ( a i , « , « 2 , « 2 ,
* T
, a n , a ) •
-
4) Use (3) and (4) to build non-linear support vector regression machine model.
-
5) Select corresponding simulation data ( x s , y s ) e Rn x R , compute ys = f ( x s ) , £ = | ys - ys ,Then, the confidence of simulation data can be computed by (10).
Where, (10) can be modified according to specific conditions.
-
C. Fit Criterion’ Beta Distribution Model
After all needful evaluation data are expressed on belief map. It is time to compute the integrate value of the criterion. Using (6) integrate all information of a criterion of an alternative into a probability value. I.e. the value of each evaluation criterion of an alternative can be expressed in probability.
But with the development and applications of network centric warfare (NCW), the MC environment is always uncertainty. And a single probability value can not reflect the characters of the criterion exactly. As mentioned above, the value of an evaluation criterion of an alternative is integrated by multiple experts’ (including virtual experts) judgement. If the distribution model of the criterion value can be fitted, it is important to get robustness evaluation result. Though the current data processing appeals to the normal distribution, the reality goes the other way. According to the characters of Beta distribution, we can compute density function parameters of every criterion’s Beta distribution model based on the assumption that every criterion’ values of all the alternatives obey Beta distribution. The detailed fitting processes are:
-
1) Define and research the evaluation problem to forming alternatives and effectiveness evaluation criteria system.
-
2) Using (6) integrate every two expert’s (including virtual experts) values of a criterion of an alternative into a probability value. In this case, if there are x experts in the evaluation process, we can get C x2 = x ( x - 1 )/2 probability values of each criterion of each alternative.
-
3) Estimate the probability density function parameters using the least square method, and the constructor is
f ( c i , a , в ) = m'/nnh i i = 1,2, L , N .
Where hi is the half-breadth of the part i ;
-
4) Calculate the shape parameters
5 , (« , в In |/ i ^2 nhf ( c i , « , p ) ^ .
N
R = Z 5^
i = 1

i = 1,2, l , N .
The shape parameters a , в can be calculated, and so is the fitted Beta distribution of the criterion value.
-
D. Calculate Probability of Best
The Probability of Best (PoB) of alternative Ai is the probability that alternative Ai is better than all other alternatives in the alternative space. It is denoted by PoBi :
PoB i = P ( J ( A i ) > max { J ( A j ) } ) A, A j G 5 , i * j . (14)
Where, J ( • ) is the integrated evaluation function of alternative’s effectiveness, such as utility function [12].
Undoubtedly, the probability can be derived by various fashions, of which the most direct is that experts balance them according to their confidence. However, it is too subjective [13]. According to the principle of Monte Carlo simulation, we take the choice process of optimal MC alternative as a simulating process; take the value of each criterion as a random variable. Then we compute the PoB of each alternative through Monte Carlo simulation with criteria’ Beta distribution models. The detailed calculation process of PoBs is shown in Fig.3.
In Fig.3, T is the total times of Monte Carlo simulation, t denotes the t -th simulation, m is the number of alternatives, n is the number of criteria, Besti is the count of alternative Ai as the best alternative, Bij is the Beta distribution model of criterion Cj of alternative Ai , bij is the random value generated by Bij , uij is the utility value of b j , E i = J ( A i ) is the integrated effectiveness of alternative Ai .
-
E. Robustness Evaluation Flowchart of MCE
Combine the multiple data sources fusion method with the alternative’s PoB calculation method, the robustness evaluation flowchart of MCE is shown in Fig.4. It begins with mission requirements analysis to form alternatives, and ends with the optimum rank of alternatives. All the steps are given detailedly as follows:
-
1) Generate communication alternatives through mission requirements analysis based on the scenario. The
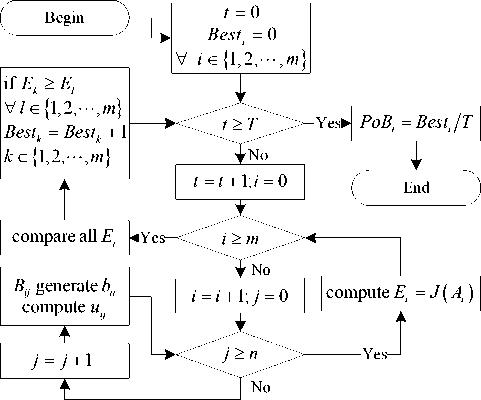
Figure 4. Calculation Process of PoB
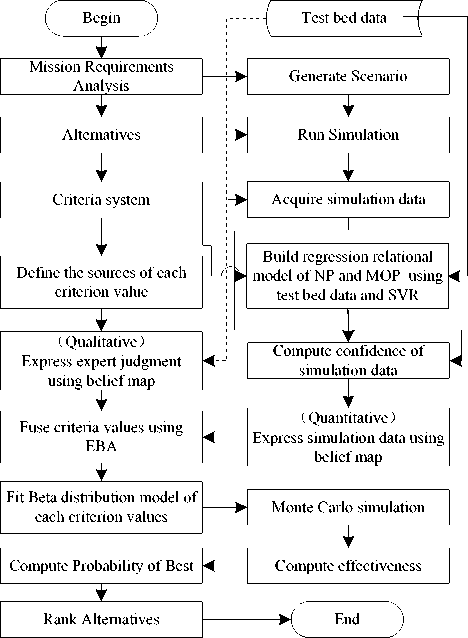
Figure 3. Evaluation flowchart of MCE alternatives should be feasible, and satisfy the requirements of the MCE evaluation;
-
2) Build hierarchy criteria system of communication effectiveness based on what the operation environment requirements and the focus of decision makers;
-
3) Define the sources of each criterion, and the evaluation data mainly from experts’ judgment, test bed data or simulation results;
-
4) Using Belief map as data expression form. Experts’ judgments which are qualitative data can be directly used in belief map, the test bed data can be taken as training example, and simulation data can be acquired to compute their confidence using test bed data and Support Vector Regression (SVR) which build regression relational model between network parameters and measures of performance;
-
5) Using EBA to fuse data from the three sources, the method can compute the integrated information of the decision alternative, and can represent the probabilities of all team members consider the decision alternative satisfy the requirements of objectives;
-
6) Fitting Beta distribution model based on fused results for each criterion of each alternative;
-
7) Computing the PoB of each alternative through Monte Carlo simulation, then rank the values to obtain optimal alternative. The Monte Carlo simulation can be implemented with set times, and compute each alternative’s effectiveness each simulation time.
Availability |
MCE |
| Dependability | [ Capability |
(Z) s 3 3'
21 ^'
I 11
s, s' CD
I 12
u s
I 13
I 21
Ей
5'
3 s'
"Я О
и
о
I 22
I 23
I 31
I 32
I 33
i s'
№ S a I 34
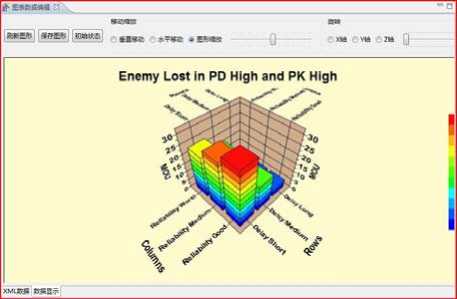
Figure 6. Comparisons among alternatives
Figure 5. Evaluation criteria system of MCE[1][14]
-
IV. Applications
This section presents an example of a Naval Vessels Fleet’s MCE evaluation, to illustrate the credibility and effectiveness of proposed framework. The analytical factors of alternatives (Alts) are wireless bandwidth, wired bandwidth, exchange capacity, process capacity, and service access capacity and relay types. Five alternatives (details are concealed) with different analytical factors values are evaluated in this example.
-
A. Evaluation Criteria System
MCE can be measured from mission effectiveness and potential effectiveness. Mission effectiveness is that MC satisfies the degree of mission requirements; Potential effectiveness is that MC satisfies the degree of the ideal system requirements. This paper mainly focuses on the mission effectiveness of MC, and the top evaluation criteria of it are availability, dependability and capability. The evaluation criteria system is given in Fig.5.
-
B. Attributes of Criteria
It is important to define the attributes of every criterion in the evaluation process of MCE. These attributes include criteria types benefit (B) and punish (P), data types quantitative (QT) and qualitative (QL), data sources types test bed (T), simulation (S) and expert (E), and vital parameters of criteria. Tab.II shows the attributes of criteria.
C. Evaluation Data
TABLE II.
Attributes of criteria
Criteria
Criteria types
Data types
Data sources types
Vital Parameters
I 11
B
QT
S,E
network size, structure
I 12
B
QT
S,E
network size, structure, service access capacity
I 13
B
QT
S,T,E
network size, structure, service access capacity
I 21
B
QT
S,T,E
reliabilities of nodes and links, MTTR
I 22
B
QL
E
reliabilities of communication equipments
I 23
B
QL
E
levels of encrpytion tachniques
I 31
B
QT
S,T,E
network size, capacity
I 32
P
QT
S,T,E
network size, structure, service access capacity, time delay
I 33
B
QL
E
disturb levels of electromagnetism
I 34
B
QT
S,T,E
the number of recived calls, the number of all calls
In this example, the values of qualitative criteria are provided by experts and the values of quantitative criteria are provided by test bed and simulation which are built to evaluate MCE.The experts give the values of qualitative criteria via belief map directly. In order to evaluate the alternatives’effectivenesses, we must build a simulation system according to the scenario of evaluation environment. Fig.6 is a snapshot of a simulation result.
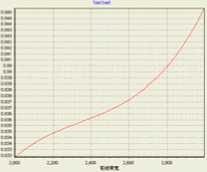
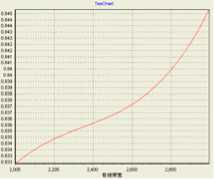
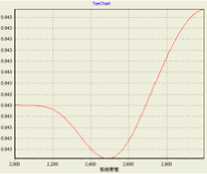
Take the criterion ‘call completing ratio’ as an example to illustrate the proposed method. Firstly, the knowledge of ‘call completing ratio’ from an simulation can be taken from it’s utility value. Secondly, choose polynomial kernel (PK) and Gaussian functions (GF) as kernel functions to build SVR prediction model between network parameters and ‘call completing ratio’ respectively. Fig.7 and Fig.8 show the influence of wireless bandwidth and Wired bandwidth on ‘call completing ratio’ with parameters e = 0.01 , C = 0.1 or C = 0.5 , respectively.
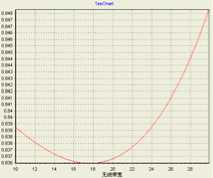
a. C = 0.1 , PK

c. C = 0.1 , GF
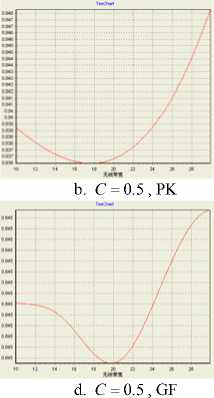
Figure 7. Wireless bandwidth vs. Call completing ratio
a. C = 0.1 , PK
b. C = 0.5 , PK
c. C = 0.1 , GF

d. C = 0.5 , GF
Figure 8. Wired bandwidth vs. Call completing ratio
The build process of SVR prediction model was performed using the learn model of SVR operator in OASIS [15]. Then, the confidence of ‘call completing ratio’ from simulation data can be computed using SVR ‘ prediction mode loperator ’ and ‘ load model operator’ in OASIS. Finally, use (10) to compute the confidence of ‘call completing ratio’ from the simulation data.
-
-
D. Example of Data Fusion
Take the computation of survivability [16] in alterna-tive1 as an example. There are 3 experts and 3 virtual experts within evaluation process. The values of survivability in the alternative provided by these experts using belief map are (0.73, 0.77), (0.81, 0.79), (0.85, 0.80), (0.83, 0.88), (0.93, 0.83) and (0.88, 0.85) respectively. Use (6) to compute the final value of survivability in the alternative is 0.7191. Tab.III shows the fused results of alternative1’s criteria values.
-
E. Beta Distribution Model
Take the fitting process of the Beta distrbution model of ‘call completing ratio’ in alternative1 as example. The original data of ‘call completing ratio’ are shown on Tab.III. Using (6) integrate every two expert’s (including virtual experts) values of it into a probability value. There are 6 experts in the evaluation process, and we can get 15
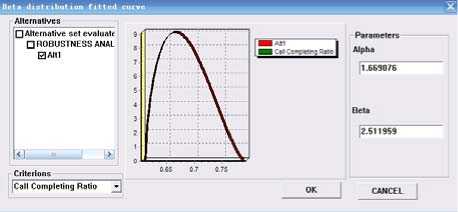
Figure 9. Beta distribution model of ‘call completing ratio’ probability values of ‘call completing ratio’ in alterna-tive1. Then, we can use (11) ,(12) and (13) to calculate the shape parameters of the beta distribution model of ‘call completing ratio’. These calculate process was performed using the ‘ robustness analysis operator ’ in OASIS. Fig.9 shows the data fitted interface of criterion “call completing ratio” in “alternative 2”, from which we can see clearly that the parameter a is 1.669076, and в is 2.511959.
-
F. Monte Carlo Simulation
In order to compute the PoBs of alternatives, we perform Monte Carlo simulation with the Beta distribution model of each criterion of each alternative. The steps are:
-
1) Determine simulation times n ;
-
2) Perform Monte Carlo simulation with the Beta distribution model of each criterion of each alternative, and take the simulation result as the value of the criterion;
-
3) Compute the criterion’s utility value using utility function method, then integrate the communication alternative’s effectiveness value ;
-
4) Compare the integrated effectiveness values of alternatives, and choose the best one’s optimal number plus one;
-
5) Repeat step 1) to step 4) for n times.
-
6) According to the optimal number of the five alternatives to calculate the PoBs of them.
Fig.10 is a comparison of integrated effectiveness of the alternatives with one simulation. This paper has inspected and verified many times by running Monte Carlo simulation, and found that the result of PoBs sort order is similar as the simulation is more than 60 times. Fig.11
TABLE III.
Criteria values of alternative1
|
Criteria |
Virtual Expert 1 |
Virtual Expert 2 |
Virtual Expert 3 |
Expert 1 |
Expert 2 |
Expert 3 |
Fuse result |
|
I 11 |
( 0.73 , 0.77 ) |
( 0.81 , 0.79 ) |
( 0.85 , 0.80 ) |
( 0.83 , 0.88 ) |
( 0.93 , 0.83 ) |
( 0.88 , 0.85 ) |
0.7191 |
|
I 12 |
( 0.84 , 0.75 ) |
( 0.76 , 0.78 ) |
( 0.75 , 0.81 ) |
( 0.91 , 0.79 ) |
( 0.88 , 0.80 ) |
( 0.83 , 0.89 ) |
0.6990 |
|
I 13 |
( 0.79 , 0.74 ) |
( 0.84 , 0.79 ) |
( 0.82 , 0.75 ) |
( 0.87 , 0.84 ) |
( 0.76 , 0.82 ) |
( 0.89 , 0.88 ) |
0.7018 |
|
I 21 |
( 0.85 , 0.76 ) |
( 0.69 , 0.75 ) |
( 0.87 , 0.76 ) |
( 0.92 , 0.76 ) |
( 0.91 , 0.87 ) |
( 0.84 , 0.81 ) |
0.7003 |
|
I 22 |
( 0.78 , 0.73 ) |
( 0.73 , 0.72 ) |
( 0.84 , 0.80 ) |
0.6447 |
|||
|
I 23 I 31 |
( 0.85 , 0.75 ) ( 0.88 , 0.80 ) |
( 0.75 , 0.73 ) ( 0.85 , 0.77 ) |
( 0.69 , 0.74 ) |
( 0.91 , 0.81 ) |
( 0.87 , 0.86 ) |
( 0.84 , 0.82 ) |
0.7077 |
|
I 32 |
( 0.76 , 0.74 ) |
( 0.80 , 0.76 ) |
( 0.85 , 0.69 ) |
( 0.87 , 0.82 ) |
( 0.94 , 0.79 ) |
( 0.88 , 0.81 ) |
0.6902 |
|
I 33 |
( 0.77 , 0.73 ) |
( 0.85 , 0.69 ) |
( 0.79 , 0.81 ) |
0.6457 |
|||
|
I 34 |
( 0.78 , 0.68 ) |
( 0.81 , 0.72 ) |
( 0.83 , 0.79 ) |
( 0.88 , 0.81 ) |
( 0.90 , 0.84 ) |
( 0.91 , 0.85 ) |
0.7039 |
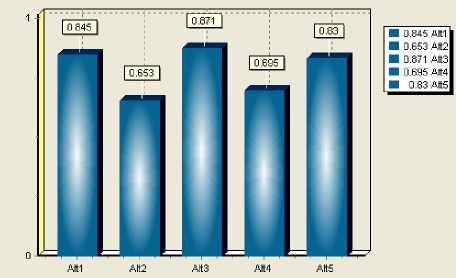
Figure 11. Integrated effectiveness comparison with one simulation shows the simulation result of 300.
It can be figured out that all five alternatives have the probability to become the best one, which is reasonable after analyzing some groups of effectiveness evaluation values with original data. In Fig.10, alternative 3 (0.871) is better than alternative 1 (0.845), but it is uncertain that alternative 3 is absolutely or always better than others. In Fig.11, robustness analysis based on integrated effectiveness gives the PoB of each alternative. Form the figure we can see that alternative 3(0.18) is far smaller than alternative 1(0.54), and it can be gained that if just judge which alternative is the best to implement without robustness analysis, it would cause risk to military operation decision.
-
G. Evaluation Results Analysis
In this example, we have fused the data into three kinds of fusion samples for robustness analysis. They are the fusion of multiple experts’ judgments (E), the fusion of experts’ judgments and simulation data (E and S), the fusion of experts’ judgments and simulation data with test bed data as training example (E, S and T). Then, the steady PoBs of the five alternatives’ through different fused data are shown on Tab.IV. Combine Tab.IV with the whole evaluation process, we can see that:
-
1) The increase of wireless bandwidth or wired bandwidth can improve MCE, but when service access capacity increase rapidity than them, the influence of them on MCE is faint.
-
2) Exchange capacity and process capacity need increase with a constant ratio the same as wireless bandwidth as well as wired bandwidth, may provide better services to combat fighters.
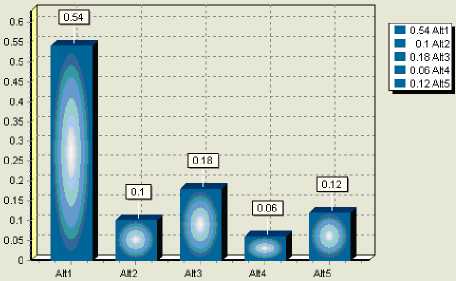
Figure 10. Alternatives PoB Sort Order with 300 Simulations
-
3) The integration of test bed data into evaluation process of MCE, can improve the credibility of evaluation results.
-
4) There is “uncertainty”existed in data sources, and it may cause failed judgement in alternative optimazition. Data fusion can provide more information for evaluation with robustness discussion.
-
5) Monte Carlo simulation can reflect the possible “uncertainty” of the fused data into Beta distribution based on their fitted model, and may minimize the risk of the data for evaluation through simulation.
-
6) While comparing the alternatives, robustness analysis provides the judgment credible in terms of PoB instead of order of one integrated effectiveness value.
TABLE IV.
Comparisons among Evaluation results
|
Alt1 |
Alt2 |
Alt3 |
Alt4 |
Alt5 |
||
|
Data sources |
E |
3 |
5 |
2 |
4 |
1 |
|
E and S |
1 |
4 |
3 |
5 |
2 |
|
|
E, S and T |
1 |
4 |
2 |
5 |
3 |
|
-
V. Conclusion
The multiple sources of evaluation data and the rapidly changes of environment bring to the uncertainty of effectiveness evaluation results. The main purpose of this paper is to improve the robustness of MCE evaluation result based on multiple data sources and Monte Carlo simulation. Through integrating test bed data into evaluation process of MCE, the evaluation results are become more credibility; and use the Monte Carlo simulation during evalution process, the uncertainty of evaluation result is minimized. Therefore, the proposed multiple data sources fusion method, the computation of alternatives’ PoB using Monte Carlo simluation, and the robustness evaluation framework provide well-foundations for designers and builders of MC network.
Acknowledgment
The authors would like to gratefully acknowledge the financial support of the National Natural Science Foundation of China (No. 91024015 and No. 61074107).
References Robustness Evaluation for Military Communi-cation Effectiveness based on Multiple Data Sources and Monte Carlo Simulation
- K.Su, J.Zhang, and Q.Yu, “Research on Military Intelli-gence Decision Support System based on Object-oriented Simulation,” Proceedings of 2007 IEEE International Con-ference on Grey Systems and Intelligent Services, Nanjing, China, November 18-20, 2007, pp.1246-1249.
- F.L. Shi, F. Yang, Q. Li, and Y.F. Zhu, “Simulation Based Effectiveness Evaluation of Military Communication Net-work with SEA Evaluation Operator”. Fire control and command control, Beijing, China, 2011, in press.
- Y.Y. Huang, “Research on the Robustness Evaluation Me-thod of Operational Effectiveness of Weapon Equipments and Its Supporting Techniques,” PhD Dissertation, National University of Defense Technology, Changsha, Hunan, China, 2006.
- Robust Decisions Inc, “ACCORD ™ Users Manual Ver-sion 2.5,” Corvallis OR. 2008.
- N.Y. Deng and Y.J. Tian, “Support Vector Machines——Theory、Arithmetic and Prolongationl”, Beijing: Science Press, China, 2009, pp.101-111.
- F. Markowetz, “Support Vector Machines in Bioinformatics. Diploma Thesis in Mathematics,” University of Heidelberg, Germany.2001.
- O.J. Berger, “Statistical Decision Theory and Bayesian Analysis Springer Verlag”, New York: Inc, 1985.
- D.A. Bruce, “Bayesian Methods for Collaborative Decision-making,” Robust Decisions Inc, 2003, pp.1-6.
- W.Wang, H.Y.Zhou, and G.J.Yin. “Bayes Method with Mixed Beta Distribution”. System Engineering Theory & Practice, Beijing, China, 2005, vol.9, pp.142-144.
- M.Creutz, “Micro Ccanonical Monte Carlo Simulation”. Physical Review Letters, 1983, pp. 1411-1414.
- J.P. Li, “Study on Fitting Methods of Simulation Metamo-delling and Its Application,” PhD Dissertation, National University of Defense Technology, Changsha, Hunan, China, 2007.
- S.Gao and S.C. Lou, “Progress in Assessing the Effective-ness of Weapon System”. System engineering theory & practice, 1998, vol.7, pp.57-62.
- Communications Research Centre. “Improving Scalability of Heterogeneous Wireless Networks with Hierarchical OLSR”. Defence R&D Canada. August 2004.
- H.Tang and J.Zhang, “A Framework of Intelligent Decision Support System of Military Communication Network Effectiveness Evaluation,” Proceedings 5th International Conference on Fuzzy Systems and Knowledge Discovery, vol4, 2008, pp. 518-521.
- L. Wang, W.P. Wang, and F. Yang, “OASIS: A Universal Environment for Weapon Equipment System of Systems Evaluation,” Forum of Advanced Defense Science and Technology, Changsha, Hunan, China, 2007.
- H.Z. Kang, C. Butler, and Q.P. Yang, “A New Survivabili-ty Measure for Military Communication Networks,” Pro-ceedings of IEEE Milcom, 1998, pp. 71-75.
