Role of GLCM Features in Identifying Abnormalities in the Retinal Images

Author: Shantala Giraddi, Jagadeesh Pujari, Shivanand Seeri
Journal: International Journal of Image, Graphics and Signal Processing(IJIGSP) @ijigsp
Article in issue: 6 vol.7, 2015.
Free access
Accurate detection of exudates in the diabetic retinal images is a challenging task. The images can have varying contrast and color characteristics. In this paper authors present the performance comparison of two feature extraction methods namely color intensity features and second order texture features based on GLCM. Authors have proposed and implemented new approach for GLCM feature calculation in which the input image is divided into number smaller blocks and GLCM features are computed on these blocks. The performance of each feature extraction method is evaluated using Back Propagation Neural Network (BPNN) classifier that is classifying the blocks as either abnormal block or normal block. With GLCM features, an accuracy of 76.6% was obtained and with color features an accuracy of 100% was obtained. It was found that color features are better in identifying true positives than GLCM based texture features. However use of GLCM features reduces the occurrence of false positives.
Texture features, Hard exudates, GLCM features, Back propagation neural network
Short address: https://sciup.org/15013881
IDR: 15013881
Text of the scientific article Role of GLCM Features in Identifying Abnormalities in the Retinal Images
Published Online May 2015 in MECS DOI: 10.5815/ijigsp.2015.06.06
According to WHO estimation, more than 75% of patients, who have had diabetes for more than 20 years are likely to develop some form of Diabetic Retinopathy (DR). Different kinds of abnormal lesions are caused by diabetic retinopathy. Alterations in blood vessel diameter, micro aneurysms, lipid, protein deposits also known as hard exudates, cotton wool spots, hemorrhages and new vessel growth are various characteristics of Diabetic Retinopathy.
Diabetic Retinopathy can lead to blindness. To prevent this, periodic screening and automated early detection is needed. The screening programs produce an enormous number of retinal images since diabetic patients typically have both their eyes examined at least once in a year. The manual screening methods have both high financial cost and human resource requirements. Nowadays, several approaches have been considered to build automatic computer-based screening programmes. Automated detection can reduce the workload and increase the effective follow-up management of diabetic patients.
In several patients, the only visible symptoms of DR are Exudates. Hard exudates occurring in the macula can cause significant visual impairment. The main obstacle in exudates detection is extreme variability of color and contrast in retinal images that depends on the degree of pigmentation, size of the pupil and illumination. These factors affect the appearance of exudates in the retinal images. Many techniques such as clustering, morphological operations, pixel wise classification using BPNN, SVM have been employed for the exudates detection. All these techniques have high computational requirement.
Akara Sopharak et.al [1] proposed an automatic method to detect exudates from low-contrast digital images of Retinopathy patients with non-dilated pupils using a fuzzy c-means (FCM) clustering technique. The number of clusters was optimally selected based on a quantitative experiment. The number of clusters was varied from two to eight based on sensitivity and specificity. Hussain F.Jaafar et.al [2] proposed a method based on top-down image segmentation and local thresholding by a combination of edge detection and region growing. Grading of hard exudates is performed. Ivo soares et.al [3] used combination of morphological operators and adaptive thresholding. The authors claim that the method is unaffected by contrast changes, nonuniform illumination and variable background resulting in correct detection of exudates. Ram K et.al [4] proposed method for the automated detection of Microaneurysms. They formulated MA detection as a problem of target detection from clutter. A successive rejection-based strategy is proposed to progressively lower the number of clutter responses. The processing stages are designed to reject specific classes of clutter while passing most of true MAs, using a set of features. Shahin et.al [5] proposed a system for automated classification of normal and abnormal images. The authors detected the blood vessels, hard exudates micro aneurysms and from the retinal images, measurements such as blood vessels area, exudates area, micro aneurysms area, entropy and homogeneity are computed. These objective measurements are finally fed to the artificial neural network (ANN) classifier for the automatic classification of retinal images. Selvathi D et.al [6] detected anatomical structures like blood vessels, exudates and micro aneurysms and classified the image as Retinopathic or Normal.
In this paper, authors have presented the comparison of two feature extraction methods namely first order texture features like color intensity features and second order texture features based on Grey Level Co-occurrence Matrix (GLCM). Authors have proposed a new approach for feature extraction. The input image is divided into several smaller blocks of size 36*37 pixels. Various histograms based first order texture features like mean; variance, skewness and kurtosis authorsre extracted on red and green channels of the image. In addition to first order features, second order texture features like homogeneity, contrast, correlation and variance are computed on a these smaller blocks. Both feature sets are fed to the BPNN classifier that classifies the blocks as normal and abnormal.
The rest of the paper is structured as follows. In section 2 deals with the proposed methodology. In Section 3 experimental results are explained in detail. Paper is concluded in section 4.
-
II. Materials And Methods
The proposed methodology is shown in Fig 1. Two feature extraction methods have been used. Feature set I consisted various first order texture features like mean, variance, skewness and kurtosis from red and green channel of the image. Feature set II consisted of second order features based on GLCM like homogeneity, contrast, correlation and variance. Both the feature sets are fed to BPNN classifier which classifies the input test image block as normal or abnormal.
Haralick features [7] which are computed on the Gray level Co-occurrence Matrix have been used in many classification problems. Santhi et.al [8] proposed a mechanism for age classier for using facial images. They implemented a mechanism for classifying the image as child or old using facial images. They have used GLCM and SVM classifier for classifying images. Abdolvahab Ehsanirad et.al [9] implemented a system for leaf recognition using GLCM features and PCA. The system could classify 13 different kinds of plants and deformed leaves. Alaa Eleyani1 [10] introduced a face recognition technique based on GLCM features. The authors proposed two approaches. In the first approach, haralick features are used whereas in the second approach GLCM is converted into vector and used in the classification process which the authors found it superior than the first approach, principal component analysis and linear discriminant analysis. Daljit Singh et.al [11] proposed method based on GLCM features and SVM classifier for the abnormalities detection in the abnormalities in the Brain images. Feroui et.al [12] used a combination of k-means clustering algorithm and mathematical morphology to detect hard exudates. Handayani et.al[13] used k-means clustering for the segmentation of exudates. Later various geometric properties like areas, the perimeters, the number of centroids and its standard deviation are extracted from the segmented regions. Authors have used various classifiers like Vector Machine, Multilayer Perceptron, and Radial Basis Function and obtained highest accuracy with multilayer perceptrons. Morium et.al [14] used histogram equalization to overcome unequal illumination, a combination of K-means clustering and mathematical morphology has been for the detection of hard exudates.
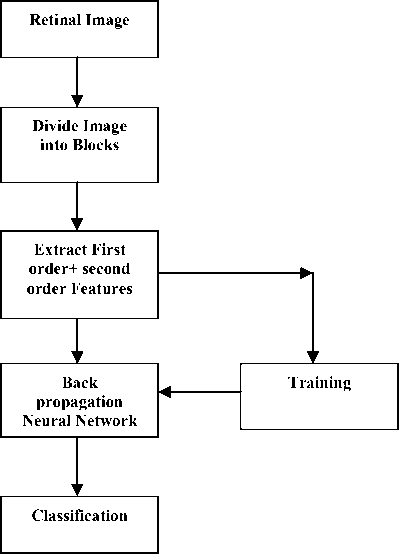
Fig. 1. Methodology for Exudates detection
-
A. Image Dataset
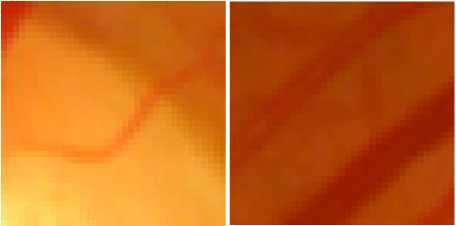
One of the publicly available databases, DIARETDB0 is used for the study. The DIARETDB0 database consists of 81 color retinal images; each image is of size 1152X1500 in the png format. The database consists of images of varying color and contrast. Fig 2 shows typical retinal image having Diabetic Retinopathy.
-
B. Preprocessing
The input images are color images of size 1150*1500. First input image is scaled to 575X 750. Images are contrast enhanced using adaptive histogram equalization which operates on small data regions rather than the entire image. For extracting first order features, green channel and red channel of the image are extracted. For
extracting second order features, the scaled images are converted into grey scale images.
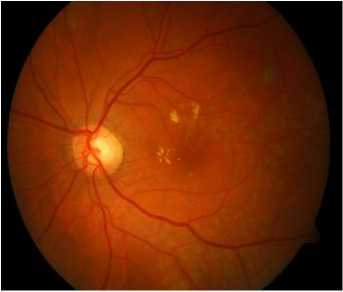
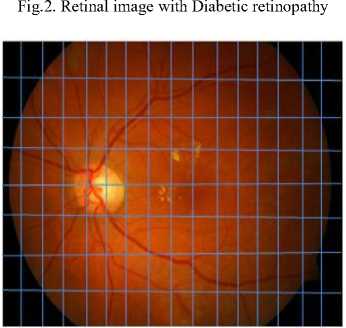
Fig.3. Retinal Image divided into blocks
-
C. Partitioning of ROI
The common approach to extract features using Gray Level Co-occurrence Matrix (GLCM) is to construct the GLCM over the entire image. Retinal image has many clinical structures such as optic disc and vessels which are the major obstacles in the detection of exudates. In this paper authors have proposed a new method in which the input image is divided into several smaller blocks of sizes 36X37 pixels. Based on the content, the block is categorized. The blocks are numbered 1-320. The creation of the blocks is shown in Fig 3.
For the easier training and training process, the blocks are divided into four categories namely ,
-
1. Normal blocks – Blocks containing Normal Retinal background part
-
2. Exudates blocks – Blocks containing exudates
-
3. Vessel blocks – Blocks containing vessels
-
4. Optic disc blocks- Blocks containing part of Optic disc.
All the four categories of blocks are shown in Table 1. From these blocks, authors have extracted haralick features and first order texture features that are explained in detail in the next section.
Table 1. Categorization of Blocks
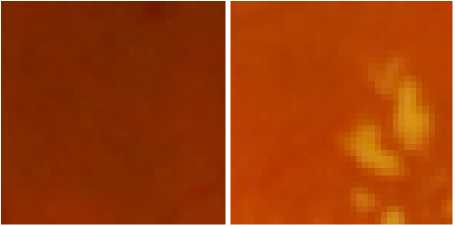
Normal background Exudate
Optic Disc Vessel
-
D. Grey Level Co-occurrence Matrix
Gray-level co-occurrence matrix (GLCM) is the statistical method of examining the textures that considers the spatial relationship between the pixels. The GLCM functions characterize the texture of an image by calculating how often pairs of pixel with specific values and in a specified spatial relationship occur in an image, creating a GLCM, and then extracting statistical measures from this matrix. The graycomatrix function in MATLAB creates a gray-level co-occurrence matrix (GLCM) by calculating how often a pixel with the intensity (graylevel) value i occurs in a specific spatial relationship to a pixel with the value j . By default, the spatial relationship is defined as the pixel of interest and the pixel to its immediate right (horizontally adjacent), but you can specify other spatial relationships between the two pixels. Each element ( i, j ) in the resultant GLCM is simply the sum of the number of times that the pixel with value I occurred in the specified spatial relationship to a pixel with value j in the input image.
A GLCM is a matrix where the number of rows and columns is equal to the number of gray levels, G, in the image. The matrix element P (i, j | Δx, Δy) is the relative frequency with which two pixels, separated by a pixel distance (Δx, Δy), occur within a given neighborhood, one with intensity ‘i’ and the other with intensity ‘j’. The matrix element P (i, j | d, ө) contains the second order statistical probability values for changes between gray levels ‘i’ and ‘j’ at a particular displacement distance d and at a particular angle (ө). The GLCM’s are very sensitive to the size of the texture samples on which they are estimated. Thus, the number of gray levels is often reduced
-
E. GLCM matrix calculation
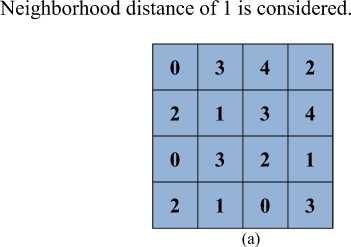
Calculation of GLCM matrix can be illustrated with Fig. 4 in which calculation of P(00) and P(900) is shown [15]. Let us consider the image which is having four different intensity values. GLCM will be a matrix of 4X4.
|
0 |
1 |
0 |
3 |
0 |
|
1 |
0 |
3 |
1 |
0 |
|
0 |
3 |
0 |
1 |
1 |
|
3 |
1 |
1 |
0 |
2 |
|
0 |
0 |
1 |
2 |
0 |
|
0 |
0 |
4 |
0 |
0 |
|
0 |
0 |
0 |
4 |
1 |
|
4 |
0 |
0 |
1 |
1 |
|
0 |
4 |
1 |
0 |
1 |
|
0 |
1 |
1 |
1 |
0 |
-
(b)(c)
Fig.4. a. Intensity matrix b. Matrix P (0 0)c. Matrix P ( 900)
contrast = , nW , p (i, j) 11 i - Д = n[ n =0 ^ i=1 j=1
, ^ ^ {i X j } XP (i, j )-{цхХ Цу } correlation = EE -^—^---v 7 * '(2)
T^ * = 0 Ox X Oy
Energy = EE p (i,j)2
-
i = 0 j = 0
-
"1 V1 p ( i,j )
Homogeneity = „(4)
-
i = 0 j = 0 (1 + I i, J\ )
-
G. First Order Features
Pixel intensities are simplest available features useful for pattern recognition. Intensity features are first order statistics that depend only on individual pixel values. The intensity and it’s variation inside the retinal images can be measured by features like: median, mode, standard deviation and variance. Various intensity features that are extracted from the color retinal images are given in below.
^ M 2 mean ( pi ) = ——
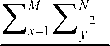
variance а =
MXN
Skewness =
M
Energy ( e^ = -MN , x M d E N = , (9)
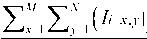
Entropy i = "^E x = 1 E y = 1 Ii ( x ’ y )( ln Ii ( x ’ y ) ) (10)
-
H. Classification Using Back Propagation Neural Network
Back propagation uses a supervised learning algorithm. The network is trained using the data for which both inputs and desired outputs are known. The algorithm modifies the weight so as to minimize the mean square error between desired and actual outputs of the network. Once the training is complete the weights are frozen and used to compute output values for new input samples.
Neural networks have been applied in many applications such as: automotive, aerospace, banking, medical, robotics, electronic, transportation and classification of images. While designing a neural network, one crucial parameter is the number of neurons in the hidden layers. The hidden layer is responsible for internal representation of the data. If there are too few neurons in the hidden layer, the network may not contain sufficient degrees of freedom to form a representation. If too many neurons are defined, the network might become overtrained. Therefore, an optimum design for the number of neurons in the hidden layer is required.
The backpropagation feed forward multilayer network can be depicted as shown in Fig 5.
In order to use neural networks in exudates detection, input layer is consisted of neurons the same number as input parameters and output layer is made up of one neuron that shows the category of the input block. In this research, a back propagation neural network with one hidden layer is implemented since, one hidden layer is enough for most of the applications.
Authors have used two models in their study. In Model 1, authors have used second order texture features based on GLCM. In Model 2, first order texture features are used for training and testing.
-
I. Back Propagation Algorithm
Computational bounds are not exceeded,Do for each input pattern.
-
1. Compute hidden node inputs
-
2. Compute hidden node outputs
-
3. Compute inputs to the outputs nodes
-
4. Compute the network outputs
-
5. Compute the error between and desired output
-
6. Modify the weights between hidden and output
-
7. Modify the weights between input and hidden nodes:
nodes:
A W kj = n (dp, k - Op, k) *'( net pj X pj
( 2,1 ) ( 2 ) '
A W k , - = n ^ k (( d p , k O p , k ) ^ ( net p , -
AWk,-) )^'(net{p,))
J. Training And Testing Set
15 images are considered for training. From these images 100 blocks of each category are selected for training. Thus there are 400 blocks for training. 10 images are considered for testing. Each image has 320 blocks. The number of exudates blocks in each of 10 images that are considered for the study is given below.
Input Hidden Output
Layer Layer Layer
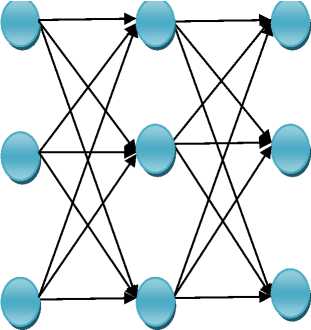
Fig. 5. Back propagation feed forward multilayer network
Table 2. Number of Exudates blocks and non-Exudates blocks
|
Image number |
Number of exudates blocks |
Number of nonexudates blocks |
|
Image 017 |
33 |
287 |
|
Image 021 |
08 |
312 |
|
Image 024 |
20 |
310 |
|
Image 027 |
13 |
307 |
|
Image 030 |
10 |
310 |
|
Image 024 |
35 |
285 |
|
Image035 |
38 |
282 |
|
Image044 |
24 |
296 |
|
Image103 |
12 |
308 |
|
Image104 |
104 |
216 |
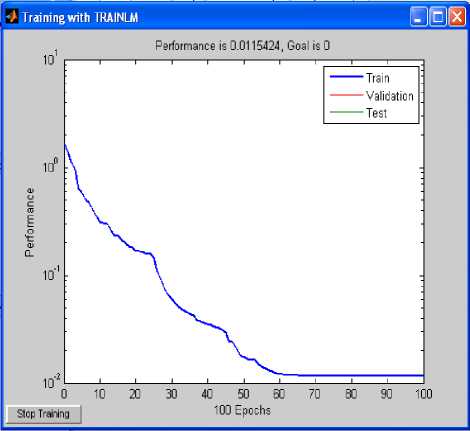
Fig. 6. Training of BPNN with 10 hidden nodes
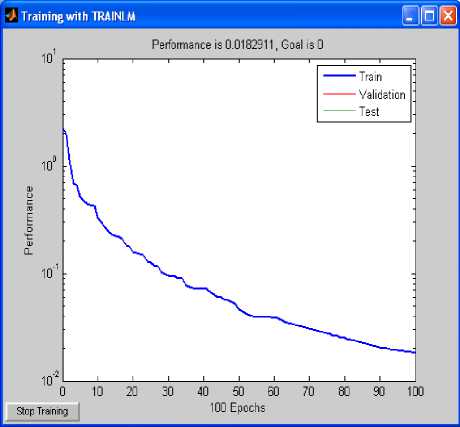
Fig. 7. Training of BPNN with 15 hidden nodes
-
III. Results And Discussions
Experiments are conducted with two models. Model I and Model II. Model II uses GLCM (second order) features whereas Model II uses color features (first order). For both models, experiments are conducted by varying the number of hidden nodes. The confusion matrices for Model I and Model II using BPNN are shown in Table 3 and Table 4. The performance of our technique was evaluated quantitatively by comparing the result with ophthalmologists’ ground-truth images at the block level. It can be seen that color features are good in detecting exudates (100% accuracy with 5 hidden nodes. Among the false positives, highest number of misclassified blocks is normal blocks. With second order texture features, highest accuracy of 76.67% is obtained with 10 hidden nodes. The corresponding % of false positives is 17.67%. The accuracy for the detection of normal, Optic Disc and vessel blocks need not be considered since objective of this study is the detection of exudates blocks.
Table 3. Confusion Matrix for Model I with Second Order texture features
|
Exudate |
Normal background |
OD |
Vessel |
|
|
Exudate |
76.67% |
17.64% |
8.33% |
3.7% |
|
Normal |
0% |
58.11% |
0% |
3.7% |
|
OD |
0% |
8.45% |
75.01 |
3.7% |
|
Vessel |
23.33% |
15.8% |
16.66% |
88.90% |
Table 4.Confusion Matrix for Model 1I with First Order texture features
|
Exudate |
Normal background |
OD |
Vessel |
|
|
Exudate |
100% |
24.63% |
16.66% |
7.4% |
|
Normal |
0% |
37.13% |
0% |
3.7% |
|
OD |
0% |
4.05% |
75% |
0% |
|
Vessel |
0% |
34.19% |
8.34% |
88.9% |
The performance of the BPNN using different number of hidden nodes is shown in Fig 8 and Fig 9. It can be observed that, first order features are good in detecting the true positives. Highest accuracy of 100% was obtained with 5 hidden nodes, % of false positives are just 17.5%. With 11 hidden nodes, authors obtained highest false positive rate of 30%.
Second order features are able to detect 76.67% of exudates blocks with 10 hidden nodes. The number of false positives for this being 17.8%.With 13 hidden nodes the number of true positives being same, % of false positives was also significantly increased to 30%. With 14 hidden nodes, highest false positive rate of 43% was obtained. It can be observed that, there is a high false positive rate with GLCM features.
-
IV. Conclusion And Future Scope
In this paper authors have proposed novel approach for detection of exudates based on first order and second order texture features. First order texture features are able to detect exudates more effectively than second order features. False positives could not be eliminated completely. Among the blocks that are classified as false exudates, majority of them are normal blocks. In order to improve the specificity, other classifiers like SVM can be employed. Our future work will based on SVM classifiers for exudates detection.
Classifier performance using color features
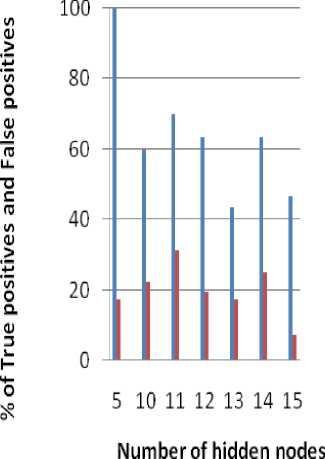
Fig. 8. Classifier performance with different number of hidden nodes
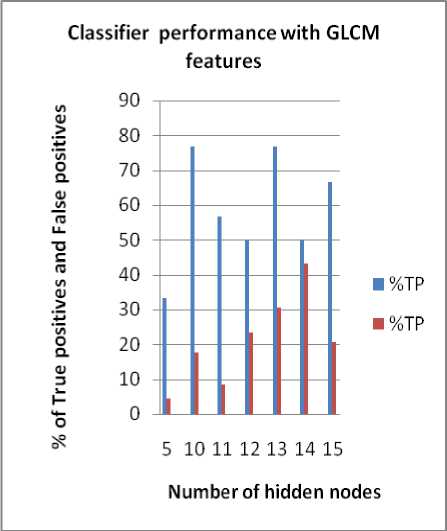
Fig.9. Classifier performance with different number Of hidden nodes
Agrcultural Image processing.
Dr Jagadeesh Pujari completed Ph.D from Gulabarga Univarsity and currently working as Head Of Dept. Information Science , SDMCET, Dharwad. Area of Research are Content Based Image Retrieval.
References Role of GLCM Features in Identifying Abnormalities in the Retinal Images
- Akara Sopharak, "Comparative Analysis of Automatic Exudates Detection betauthorsen Machine Learning and Traditional Approaches", IEJCE Transaction of INF & SYST, VOL.E92-D.NO.11. 2009, pp 2264-2271.
- H.F. Jaafar, A.K. Nandi and W. Al-Nauimy, "Automated detection of exudates in retinal images using a split-and-merge algorithm," EUSIPCO 2010, Alborg, pp. 1622-1626, 2010.
- Ivan Soares, Miguel Castelo-Branco, Antonio M, G. Pinnheiro ," Exudates Dynamic Detection In Retinal Fundus Images Based On The Noise Map Distribution", 19th European Signal processing Conference 2011, pp 46-50.
- Ram, K.; Joshi, G.Sivaswamy, J.A Successive Clutter-Rejection-Based Approach for Early Detection of Diabetic Retinopathy, Biomedical Engineering, IEEE Transactions on, Issue Date: March 2011.
- Shahin E.M, Taha, T.E.; Al-Nuaimy W. " Automated detection of diabetic retinopathy in blurred digital fundus images ", 8th International conference on Computer Engineering Conference (ICENCO), Dec 29-30. 2012, pp 20 – 25.
- Selvathi D, N.B.Prakash, Neethi Balagopal " Automated Detection of Diabetic Retinopathy for early diagnosis using feature extraction and Support vector machines ".
- R.M. Haralick, K. Shanmugam, I. Dinstein, "Textural Features for Image Classification, IEEE Transactions of Systems, Man, and Cybernetics, vol. 3, no. 6, pp. 610–621, 1973.
- B. Santhi and R. Seethalakshmi "Classifier in Age classification", Research Journal of Applied Sciences, Engineering and Technology 4(24): 5372-5374, 2012.
- Abdolvahab Ehsanirad and Sharatkumar Y. H. " Leaf recognition for plant classification using GLCM and PCA methods", Oriental Journal of Computer Science & Technology, Vol. 3(1), 31-36 (2010).
- Alaa Eleyani, Hasan DEM˙IREL2 Co-occurrence matrix and its statistical features as a new approach for face recognition" Turk J Elec Eng & Comp Sci, Vol.19, No.1, 2011, c_ T¨UB˙ITAK doi:10.3906/elk-0906-27.
- Daljit Singh, Kamaljeet Kaur, "Classification of Abnormalities in Brain MRI Images Using GLCM, PCA and SVM", International Journal of Engineering and Advanced Technology (IJEAT) ISSN: 2249 – 8958, Volume-1, Issue-6, August 2012.
- Feroui Amel,Messadi Mohammed,Bessaid Abdelhafid , "Improvement of the Hard Exudates Detection Method Used For Computer- Aided Diagnosis of Diabetic Retinopathy", International Journal of Image, Graphics and Signal Processing (IJIGSP), Vol.4, No.4, May 2012.
- Handayani Tjandrasa, Isye Arieshanti, Radityo Anggoro "Classification of Non-Proliferative Diabetic Retinopathy Based on Segmented Exudates using K-Means Clustering", IJIGSP Vol. 7, No. 1, December 2014.
- Morium Akter, Mohammad Shorif Uddin "Morphology-Based Exudates Detection in Diabetic Retinopathy", ADVANCES IN BIOMEDICAL SCIENCE AND ENGINEERING Volume 1, Number 1, September 2014.
- Alaa ELEYAN , Hasan DEM˙IREL, "Co- Occurrence matrix and its statistical features as a new approach for face recognition ", Turk J Elec Eng & Comp Sci, Vol.19, No.1, 2011, pp 97-107.
