RSUs Deployment Using Parallel Scheduling

Author: Ramneek kaur
Journal: International Journal of Computer Network and Information Security(IJCNIS) @ijcnis
Article in issue: 5 vol.6, 2014.
Free access
Advancement in software, hardware and communication technologies have led to the development of design and implementation of different types of networks that are deployed in various environments. One such network that has gained a lot of interest in the last few decades is the Vehicular Ad-Hoc Network (VANET). VANET has become an active area of research, development and standardization because it has remarkable potential to improve vehicle and road safety, traffic management, and also provide comfort to both drivers and passengers. Roadside units (RSUs) are a vital component of Vehicular ad hoc network (VANET). Mainly, the density and location of RSUs decides the success of a VANET. But, the sky-high deployment costs of the RSUs make it impossible to deploy a large number of RSUs on the specific area or road. Thus, there rises a need to optimally deploy a restricted number of RSUs in a given region in order to achieve maximum performance. This paper presents a new TDB based RSUs deployment algorithm with a goal of attaining high efficiency and cover maximum area. Matlab platform is used to assess the performance of the proposed algorithm using several performance metrics.
VANETs, RSUs Deployment, Parallel processing, TDB Scheduling
Short address: https://sciup.org/15011303
IDR: 15011303
Text of the scientific article RSUs Deployment Using Parallel Scheduling
Published Online April 2014 in MECS
Vehicular Ad-hoc Networks (VANETs) represent a rapidly emerging, particularly challenging class of Mobile Ad Hoc Networks (MANETs) [1, 2, 3, 4]. VANETs are distributed communication networks built up from traveling vehicles, and are thus characterized by very high speed and limited degrees of freedom in nodes movement patterns.
Vehicular ad hoc network (VANET) involves vehicle to vehicle (V2V), vehicle to roadside (V2R) or vehicle to infrastructure (V2I) communication [1, 5, 6]. VANET generally consist of On Board Unit (OBU) and Roadside Units (RSUs).Vehicular Networks System consists of large number of Nodes or vehicles. These vehicles will require an authority to govern it, each vehicle can communicate with other vehicles using short radio signals DSRC (Dedicated Short Range Communication), this communication is an Ad Hoc communication that means each connected node can move freely, no wires required, the routers used called Road Side Unit (RSU), the RSU works as a router between the vehicles on the road and connected to other network devices [2].
Each vehicle has OBU (on board unit), this unit connects the vehicle with RSU via DSRC radios, and another device is TPD (Tamper Proof Device), this device holding the vehicle secrets, all the information about the vehicle like keys, drivers identity, trip details, speed, routing etc. V2V, V2I and V2R type of communication is present in Intelligent Transportation System (ITS) and it is the main component of VANET [3, 5].
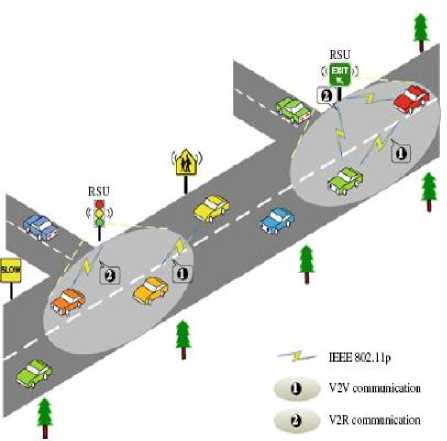
Fig 1. System model (adapted from [5])
VANETs can be utilized for a broad range of safety and non-safety applications [2, 3, 5], allow for value added services such as vehicle safety, automated toll payment, traffic management, enhanced navigation, location-based services such as finding the closest fuel station, restaurant or travel lodge and infotainment applications such as providing access to the Internet.
-
A. System Model
A typical VANET consists of three entities in city scenarios [6]: the top TA, the fixed RSUs along the road side, and the mobile OBUs equipped on the running vehicles.
-
a. TA: TA [6] is in charge of the registration of the RSUs and OBUs. TA can reveal the real OBU identity of a safety message and publishes the CRL periodically to the RSUs. Moreover, TA can be a road authority, such as the government. It has the basic information about streets and traffic statistics,
and proposes the RSUs deployment plan according to the tradeoff between the requirements of most OBUs and the investment budget.
-
b. RSU: RSUs are erected at intersections for the considerations of power and management. RSUs use the same communication technology and the deployment cost is constant at any intersections.
RSUs connect with TA by wired links [6], and act as certificate proxies of TA. An RSU can issue short-time certificates for the OBUs with valid membership.
-
c. OBU: Each OBU has a long-term unique identity. OBUs mainly communicate with each other for sharing local traffic information, and with the RSUs for updating the short time certificates. Digital maps are available for the OBUs. It provides the streetlevel map, the communication coverage of RSUs and the traffic statistics such as vehicle speed on roads, and traffic signal schedule at intersections [6].
The remainder of this paper is organized as follows. In Section 2, I have presented related work on vehicular networks. Section 3 presents the problem formulation for the deployment of RSUs in VANET. In Section 4, design methodology is elaborated. Section 5, present the simulation results that demonstrate the performance of the proposed optimization algorithm. Section 6, concludes the paper.
-
II. Related works
Earlier works in optimal placement in VANET [6, 8] include [4, 6 -14].
Dhamgaye et al. [4] has addressed to the difficulty faced in designing an efficient routing protocol for VANET, because of the vulnerability of wireless medium to attacks. This survey paper gives brief overview of different routing protocols depending on the availability, authentication, confidentiality, privacy, non-repudiation and data trust. Also attempt has been made to identify major security issues and challenges associated with different routing protocols.
Sun et al. [6] optimize the location of RSUs such that vehicle can reach an RSU within some timing constraint, given by sum of driving time and an overhead time (for adjusting the route), to update short term certificates. The optimization scheme may require vehicles to change their route which may have effects on local traffic condition. We do not have any route changing condition; we optimally place the RSUs considering the vehicles current routes only
Lee et al. [7] seek optimal placement of RSUs to improve connectivity. Each intersection is considered as a potential RSU location. These potential locations are then ordered based on number of vehicle-reports received within communication range of each RSU. The placement scheme only considers taxi location reports and does not consider speed or density of all vehicles.
Li et al. [8] consider the optimal placement of gateways, which connect RSUs (access points - AP) to the Internet, while minimizing the average number of hops from APs to gateways. They consider pervasive APs such that every vehicle is connected to an AP. They do not consider vehicle speed, density or movement patterns.
Lochert et al. [9] use genetic algorithm for optimal placement of RSUs for a VANET traffic information system. The optimal placement is to minimize travel for some fixed landmarks and may not be useful for travel between any two points in an area.
Zhao et al. [10] optimize placement of Thowboxes, standalone units that act as relays, to improve contact and data-rate/throughput within context of a delay tolerant network. They aim at improving V2V communication and not the V2I communication.
Fiore et al. [11] optimally place RSUs (Access Points -AP) in an urban environment to improve cooperative download of data among vehicles. They aim at placing the APs at point where maximum vehicles cross each other, this helps in relaying the data from AP to a downloading vehicle via other vehicles.
Trullols et al. [12] optimally deploy RSUs (Dissemination Points – DPs) in an urban area to maximize the number of vehicles that contact the DPs.
Malandrino et al. [13] optimally deploy the RSUs (APs) to maximize the system throughput. They consider both the V2I and V2V communications for optimal placement of APs. Vehicle trajectory information (time and location) forms basis of this optimization which may not be available in many cases.
Zheng et al. [14] optimally deploy APs to improve contact opportunity; defined in terms of time for which a user remains in contact with an AP. These optimizations aims at transfer of data from RSUs to vehicles whereas, our optimization aims at transfer of data from vehicles to RSUs with an area coverage constraint. Also, we do not consider V2V communication in our optimization problem.
-
III. Problem statement
The main motive of this paper is to take advantage of the benefits of parallel processing for optimally deploying roadside units across the roads. Research in Vehicular Ad Hoc Networks (VANETs) has attracted the attention of both the industry and academia. But it has been found during the literature survey that the parallel algorithms have been neglected by most of the researchers in the field of VANETs. So, in this work an effort is made to use parallel processing for efficiently deploying RSUs in VANETs.
This paper deals with utilizing the task duplication based scheduling algorithms in VANETs, for efficiently deploying RSUs in given area or road. As shown in literature survey the cost of the RSUs are too high so it is not possible to deploy more and more RSUs to cover the given road, so need of the hour is to deploy them optimistically, such that the minimum number of RSUs can cover maximum range. But it is found that optimistic deployment of RSUs takes too much time i.e. serial time.
So in order to reduce the amount of time required to do the same, a new ‘TDB based RSUs deployment algorithm’ has been proposed. It will deploy the RSUs in parallel manner on different processors which will result in reduction of execution time.
Throughout the paper emphases is on the parallel algorithm in VANETs, so no other VANET problems are considered in this research work. The proposed algorithm is also scalable. It gives better results till 45 no. of RSUs.
-
IV. Design methodolgy
This section contains detail of the scheduling process, introduction to matlab platform and the proposed algorithm.
-
A. Parallel Scheduling
Scheduling and allocation is a highly important issue since an inappropriate scheduling of tasks can fail to exploit the true potential of the system and can offset the gain from parallelization [15]. The objective of scheduling is to minimize the completion time of parallel application by properly allocating the tasks to the processors.
In this paper task duplication based scheduling is applied for optimizing the placement of roadside units. The task duplication scheduling provides greater efficiency and minimum make span time as compared to other scheduling techniques. The main idea behind the task duplication based scheduling is utilizing processor idle time to duplicate predecessor tasks [16]. This can avoid the transfer of data from a predecessor to a successor thus reducing the communication cost, network overhead and potentially reduce the start times of waiting task. Task duplication scheduling provides better results than the serial placement of roadside units.
The basic process used to achieve parallelization in this work includes [17]: Subtask Decomposition, Dependence Analysis, Scheduling and Programming as the main steps. The detailed process of parallelization is explained below with diagram:
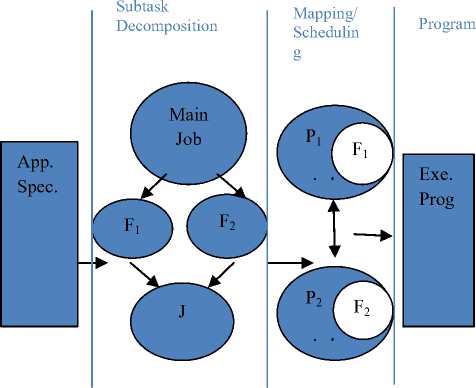
Fig 2. Process of Parallelization
App. Spec.: Application Specification
Fn : Fork Job
J : Join
Pn : Processor
Exe Prog. : Executable Program
-
• Application Specification : The first step in the above diagram is to define the application. As in this dissertation, the application of optimizing roadside units in vehicular Ad hoc Networks (VANETs) has been considered.
-
• Subtask Decomposition : Subtasks are sequential operations that work together to perform a larger operation [17]. To structure a parallel program, it's important to identify tasks at a level of granularity that results in efficient use of hardware resources.
Parallel programming using fork and join provides great flexibility during the execution of an application. New tasks can be created in order to cover the needs of the program.
-
• Task Scheduling : Scheduling is an important aspect of parallel tasks. Unlike threads, new tasks don't necessarily begin executing immediately. Instead, they are placed in a work queue [17, 18]. Tasks run when their associated task scheduler removes them from the queue, usually as processors/clients become available. The task scheduler attempts to optimize overall throughput by controlling the system's degree of concurrency.
-
• Programming : The last step in the process of parallelization is programming. It includes the executable code which instructs how to run the application in parallel. For this, there is need to define some algorithm.
-
B. Matlab
Matlab platform is used to carry out the computation results. The name MATLAB short for MATrix LABoratory [19] is a simple and flexible programming environment for a wide range of problems such as signal processing, optimization, linear programming and so on. MATLAB was developed primarily by Cleve Moler in the 1970's. MATLAB is a high-performance language for technical computing. It integrates computation, visualization, and programming environment. Furthermore, MATLAB is a modern programming language environment: it has sophisticated data structures, contains built-in editing and debugging tools, and supports object-oriented programming. These factors make MATLAB an excellent tool for teaching and research. MATLAB has many advantages compared to conventional computer languages (e.g., C, FORTRAN) for solving technical problems.
Matlab provides an interactive software package. It has inbuilt toolboxes which we have used in calculating results.
-
C. The Proposed Algorithm
The new ‘TDB based RSU deployment’ algorithm is proposed in this work. This algorithm works by using fork and join technique. The fork divides the job into equal parts and on each part the algorithm is applied simultaneously. The flag bit is assigned to each processor the when which will get free first will set its flag bit and the coming process will be allocated to that processor.
Following steps are included in the proposed algorithm:
|
Step I : Define the number of RSUs, |
|
|
the dimensions of the vanet area or |
|
|
road and initially place the first seed. |
|
|
Rest of the seeds will be placed |
|
|
randomly accordingly. |
|
|
StepII: Deploy network considering parameters |
|
|
in step I. |
|
|
StepIII : Apply Task Duplication |
Based |
|
Scheduling Parallel algorithm |
using |
|
fork method. Fork will divide |
the job |
|
into equal parts on the basis |
of the |
|
number of matlab clients in |
|
|
the matlabpool. |
|
|
StepIV : Apply optimistic RSUs |
|
|
deployment algorithm on each |
|
|
set separately. The solutions thus |
|
|
obtained will be joined. |
|
|
StepV : If the result thus obtained is |
|
|
not optimal then repeat from |
stepIII, |
|
until the optimistic deployment |
|
|
is achieved. |
|
|
StepVI : Evaluate parallel parameters and |
|
|
compare the results. |
|
|
StepVII : End. |
|
-
• the remainder is overhead given by:
T o = pT p - T s (1)
The total overhead function (T o ) be an increasing function of p. For a given problem size value of Ts remains constant but for the parallel program the efficiency will go down, if the numbers of processors are increased. The overhead of fork-join time take by processors is also considered in this work
-
• Speedup: Measures performance gain achieved by parallelizing a given application over sequential implementation. It captures relative benefit of solving a problem in parallel. It is defined as ratio of time taken to solve a problem on a single PE to time required to solve the same problem on a parallel computer with p PEs, represented as:
S p = T s /T p
The p PEs used are assumed to be identical to the one used by the sequential algorithm.
-
• Efficiency: Measures fraction of time for which a PE is usefully employed. It is defined as ratio of the speedup to the number of PEs. The efficiency of a parallel program can be written as:
This algorithm is developed and designed in matlab. The experimental results are obtained by running the proposed algorithm on matlab. The variance in the results is achieved by running the algorithm serially and in parallel for deploying the RSUs.
Quantitative evaluation and modeling of hardware and software components of parallel systems are critical for the delivery of high performance. Performance metrics [20] are used to assess the functioning of algorithm. Some of them are:
-
• Sequential Run Time: Time elapsed between the beginning and end of execution on a sequential computer. It is usually denoted by Ts.
-
• Parallel Run Time : Time elapsed from start of the parallel computation to end of execution by the last processing element (PE). It is usually denoted by Tp.
-
• Overheads: It is represented by an overhead function (To). It expresses the extra work carried out by the parallel execution. Total time spent in solving a problem using p PEs is pTp. Time spent for performing useful work is Ts and
E = S P / P
In ideal parallel systems, Speedup is equal to p, and Efficiency is equal to one. In practice Speedup is less than p, and Efficiency is between zero and one.
-
• Scalability: Scalability metric exhibit the property of parallel programs to increase their performance as the number of processing nodes increases. Total overhead function (T o ) is a function of both problem size Ts and the number of processing elements p. One can simultaneously increase the problem size and number of processors to keep efficiency constant.
-
• Function Value : Function value represents the degree of overlapping among the roadside units. The degree of overlapping should be greater than zero but as small as possible. No
overlapping represents there is some area which is left uncovered and high degree of overlapping leads to more wastage.
-
V . Results and discussion
Various parameters have been evaluated by taking different values of road side units, side dimensions and random seed placement. Comparisons on the basis of serial elapsed time, parallel elapsed time, speed up, efficiency, overheads and function value has been done. The results are as:
-
A. Effect of changing number of workers
The results are obtained by changing number of clients/workers of matlab. The change in workers have affect on various parameters. The impact of change in workers on different metrics is as:
Table1. Results for 2 Processors
|
No. of RSU s |
Serial Time |
Para llel Time |
Speed up |
Efficie ncy |
Overh eads |
Functi on value |
|
10 |
2.12 |
.88 |
2.41 |
.60 |
.35 |
.0160 |
|
20 |
2.83 |
1.90 |
1.49 |
.37 |
1.19 |
.0970 |
|
30 |
9.74 |
7.23 |
1.35 |
.34 |
4.80 |
.2074 |
|
40 |
45.13 |
31.83 |
1.42 |
.35 |
20.55 |
.43017 |
|
49 |
258.83 |
173.6 |
1.49 |
.37 |
108.98 |
2.418 |
Table 2: Results for 4 Processors
|
No. of RSUs |
Serial Time |
Para llel Time |
Speed up |
Efficie ncy |
Overh eads |
Functi on value |
|
10 |
2.12 |
1.01 |
2.099 |
.53 |
.52 |
.0160 |
|
20 |
2.83 |
1.90 |
1.49 |
.37 |
1.68 |
.0970 |
|
30 |
9.74 |
6.90 |
1.41 |
.35 |
5.05 |
.2074 |
|
40 |
45.13 |
31.04 |
1.45 |
.36 |
17.16 |
.43017 |
|
49 |
258.83 |
129.0 |
2.00 |
.50 |
75.1 |
2.418 |
The plots below shows the variance of serial elapsed time, parallel elapsed time, speed up, efficiency and overheads with the change in number of road side units, side dimensions and no. of workers/clients of mat lab.
-
B. Serial and Parallel Elapsed Time
In this section, serial and parallel elapsed time is computed for running the algorithm. The results are taken by changing the number of roadside units, the number of side dimensions and the number of workers.
-
• Effect of changing Roadside Units
Fig.3 shows the variance of serial elapsed time and parallel elapsed time with the increase in number of road side units. It shows that the serial elapsed time increases significantly with increase in the number of road side units. Initially for 8 and 12 RSUs the serial elapsed time is more than the parallel elapsed time. After 20 RSUs the serial elapsed time is much more than the parallel elapsed
• Effect of changing side dimensions
Table 3: Results for 6 Processors
|
No. of RSUs |
Serial Time |
Para llel Time |
Speed up |
Efficie ncy |
Overh eads |
Functi on value |
|
10 |
2.12 |
1.40 |
1.54 |
.38 |
.86 |
.0160 |
|
20 |
2.83 |
2.62 |
1.08 |
.27 |
1.92 |
.09704 |
|
30 |
9.74 |
7.58 |
1.26 |
.32 |
5.19 |
.2074 |
|
40 |
45.13 |
30.33 |
1.49 |
.37 |
19.01 |
.4307 |
|
49 |
258.83 |
119.3 |
2.16 |
.36 |
72.74 |
2.508 |
Fig.4 shows the variation of serial time and parallel time against the changing side dimensions. It presents that what will be the effect of changing side dimensions on the serial elapsed time and parallel elapsed time.
Table 4: Results for 8 Processors
|
No. of RSUs |
Serial Time |
Paral lel Time |
Speed up |
Efficie ncy |
Overh eads |
Functi on value |
|
10 |
2.12 |
1.87 |
1.18 |
.29 |
1.32 |
.0160 |
|
20 |
2.83 |
2.52 |
1.02 |
.26 |
1.88 |
.0970 |
|
30 |
9.74 |
8.52 |
1.16 |
.29 |
6.05 |
.2074 |
|
40 |
45.13 |
32.59 |
1.40 |
.35 |
21.17 |
.43017 |
|
49 |
258.83 |
119.5 |
2.16 |
.27 |
71.69 |
2.418 |
Serial Elapsed Time (Secs)
Parallel Elapsed
Time (Secs)
4 6 8 10 12
Side Dimension (metres)
Fig 4. Plot showing effect of side dimensions on serial and parallel elapsed time
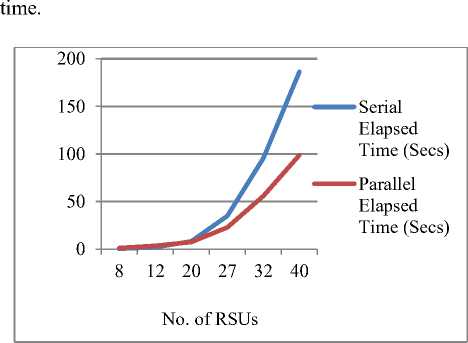
Fig 3. Plot showing no. of RSUs and serial and parallel time
Fig.4 shows that with increase in side dimension serial elapsed time increase to certain limit and then varies irregularly. As in Fig.4 we can see that serial elapsed time increases up to 6metres side and after that at 8meters dimension it falls and at 10 meters it again rises but a little. Similarly parallel time increases but not much as compared to serial time and then falls and become almost constant. It concludes that you can get better parallel results by increasing side dimensions up to a certain limit.
-
• Effect of changing number of workers/processors
Fig.5 shows the variation of parallel time with the change in the number of workers or processors. The matlab workers could be varied from 2 to 8. The results have been taken for the fixed number of RSUs and side dimensions. This plot is obtained from 40 numbers of RSUs and 20 meters side dimension. It shows parallel time is minimum for 6 processors
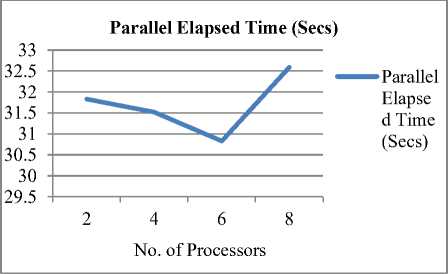
Fig 5. Variation of parallel time with change in processors
-
C. Speedup and Efficiency
In this section results are evaluated by changing the number of RSUs, the side dimensions and the number of processors. The variation is shown below:
-
• Effect of changing number of RSUs.
Fig.6 shows the variation of speedup and efficiency with increase in number of RSUs. The speedup increases significantly with increase in number of RSUs. But increase in efficiency is small.
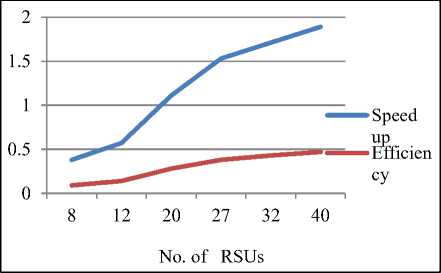
Fig 6. Change in speedup and efficiency with change in Processors
-
• Effect of changing side dimensions
Fig.7 shows the measure of speedup and efficiency against the increasing side dimension. It shows that the speedup up to a certain limit decreases with increase in side dimensions (here the number of RSUs is fixed say 30) after that it rises and again falls to a certain fixed value. The decrease in speedup shows that increase in side dimension up to a certain limit gives less parallel RSU deployment time. The efficiency is almost constant. It shows small fluctuations with increase in side dimensions.
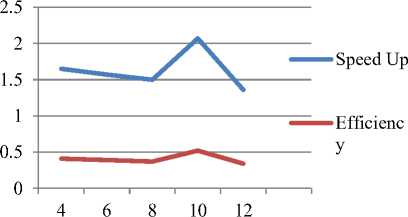
Side Dimensions (metres)
Fig 7. Plot showing speedup and efficiency against changing dimensions
-
• Effect of changing number of processors on speedup Fig.8 shows the variation in speedup due to the change in number of processors. The plot shows different behavior with different number of RSUs. As in figure the speedup for 10 RSUs fall due to more overheads. But for 40 RSUs the speed up increases and then becomes constant.
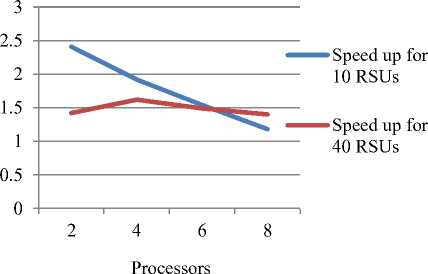
Fig 8. Plot showing processors and speedup
-
• Effect of changing number of processors on efficiency
Fig.9 represents the change in efficiency with the change in number of processors. Efficiency is also decreasing with the increase in number of processors for 10 RSUs. For 40 RSUs, the efficiency firstly increases for 4 processors and further it decreases slowly.
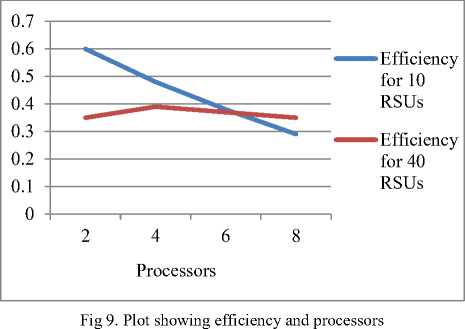
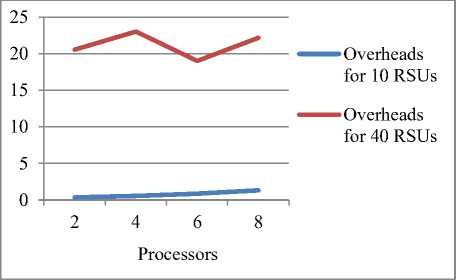
Fig 11. Plot showing processors and overheads
-
D. Overheads
An overhead is the extra amount of work done for running the parallel algorithm. The variation of overheads with number of processors and number of Roadside units is given below:
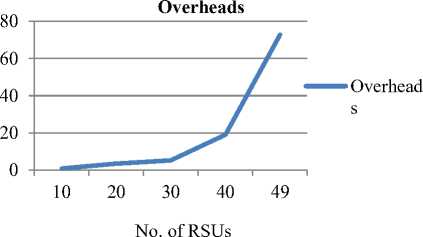
Fig 10. Plot showing RSUs and overheads
-
• Effect of number of roadside units
As shown in the Fig.10 the overheads increases with increase in the number of roadside units. Firstly there is small increase in overheads but when the RSUs are increased above 40, there is significant increase in overheads (for 6 processors and 20 side dimension).
-
• Effect of number of Processors
Fig.11 shows the variation in overheads due to increase in number of processors. The overheads faced here will be mainly due to the time required to deploy the roadside units and time wasted in establishing connection with the specific number of workers. For 10 RSUs the overheads are very low as compared to 40 RSUs, there is slight increase for more number of processors
For 40 RSUs , initially for 2 processors overheads is less but for 4 number of processors both type of overheads increases (for a fixed side dimension) so curve rises here. When number of processors is increased to 6 the overheads fall because here is only the overhead of connecting to workers, the overhead for RSU deployment is reduced to minimum. For 8 processors, the overheads again increase.
-
E. Scalability
It approves the applicability of the algorithm even when the number of roadside units is increased or the number of workers is varied. The results achieved by changing number of RSUs and processors are shown below:
Table 5: Results for 8 Processors
|
No. of RS Us |
1 Proces sor |
2 Proces sors |
4 Process ors |
6 Proces s ors |
8 Process ors |
|
10 |
2.12 |
.88 |
1.01 |
1.40 |
1.87 |
|
20 |
2.82 |
1.90 |
1.90 |
2.62 |
2.72 |
|
30 |
9.57 |
7.23 |
6.90 |
7.58 |
8.52 |
|
40 |
45.13 |
31.83 |
31.04 |
30.33 |
32.59 |
|
49 |
200.12 |
170 |
129.04 |
119.30 |
119.65 |
Table 5 shows that different number of processors provides different results with different number of roadside units. Small number of processors provides optimized deployment for small number of RSUs and larger number of processors provides the same with large number of RSUs.
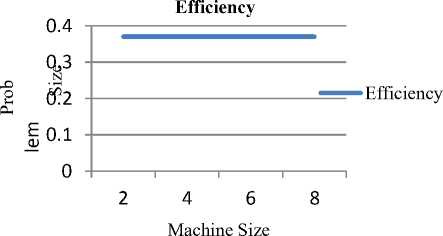
Fig 12. Efficiency variation with increase in problem size and machine size
-
F. Function value
References
References RSUs Deployment Using Parallel Scheduling
- M.Fiore, J.Harri, F. Filali, C.Bonnet. Vehicular Mobility Simulation for VANETs, Proceedings of the 40th Annual Simulation Symposium, IEEE, 2007.
- G.Samara, W. A.H. Al-Salihy, R. Sures. Security Issues and Challenges of Vehicular Ad Hoc Networks (VANET), Universiti Sans, p. 393-398, 2010.
- S. Zeadally, R.Hunt, Y.Shyan, A. Irwin, A. Hassan. Vehicular ad hoc networks (VANETS): status, results, and challenges, Springer Science, p. 217-241, 2012.
- Anup Dhamgaye, Nekita Chavhan. Survey on security challenges in VANETS, IJCSN, Vol2, Issue 1, ISSN (Online): 2277-5420, 2013.
- C. Zhang, P.Han Ho, J.Tapolcai. On batch verification with group testing for vehicular Communications, Springer, p. 1851–1865, 2011.
- Y. Sun, X. Lin, R. Lu, X. Shen, J. Su. Roadside Units Deployment for Efficient Short-time Certificate Updating in VANETs, IEEE ICC 2010 proceedings, 2010.
- J. Lee and C. Kim, “A roadside unit placement scheme for Vehicular Telematics networks”, AST’2010.
- P. Li, X. Huang, Y. Fang and P. Lin. Optimal placement of gateways in Vehicular Networks, IEEE Transactions on Vehicular Technology 2007, Vol. 56/ 6, pt 1, p. 3421-3430, 2007.
- C. Lochert, B. Scheuermann, C. Wewetzer, A. Luebke and M. Mauve. Data aggregation and roadside unit placement for a VANET traffic information system, ACM, VANET, 2008.
- W. Zhao, Y. Chen, M. Ammar, M. Corner, B. Levine and E. Zegura. Capacity Enhancement using Throwboxes in DTNs, MASS 2006.
- M. Fiore, J. Barcelo-Ordinas. Cooperative downloads in urban vehicular networks, MASS 2009.
- O. Trullols, M. Fiore, C. Casetti, C.F. Chiasserini, J.M. Barcelo Ordinas. Planning roadside infrastructure for information dissemination in intelligent transportation systems, Computer Communications, Vol. 33/ 4, p. 432-442, March 2010.
- F. Malandrino, C. Casetti, C. Chiasserini, M. Fiore. Content downloading in vehicular networks: What really matters, INFOCOM, 2011.
- Z. Zheng, Z. Lu, P. Sinha, S. Kumar. Maximizing the Contact Opportunity for Vehicular Internet Access, INFOCOM’2010.
- Y.-K. Kwok and I. Ahmad. Benchmarking the task graph scheduling algorithms. IPPS/SPDP, 1999.
- Ranjit Rajak. A Novel Approach for Task Scheduling in Multiprocessor System, International Journal of Computer Applications (0975 – 8887) Volume 44, No11, April 2012.
- Oliver Sinnen. Task Scheduling for Parallel Systems, John Wiley and Sons, 2009.
- Thomas G.Price. An analysis of central processor scheduling in multiprogrammed computer systems, Stanford Univ, October 1972.
- D.Houcque, Introduction to MATLAB for Engineering Students, northwestern University, version-1.2, Aug 2005.
- S.S.Kadam, Performance Metrics for Parallel Systems, C-DAC, Pune, 2007.
