Satellite microvibration and atmospheric turbulence effect on Satellite-to-Ground optical communication link

Author: Vasilenko Alexander V., Kashkin Valentin B.
Journal: Журнал Сибирского федерального университета. Серия: Техника и технологии @technologies-sfu
Article in issue: 1 т.7, 2014.
Free access
Satellite-to-ground optical communication link bit error rate (BER) depending on atmospheric propagation, pointing errors is considered. The theoretical and numerical estimations of BER for GEO to Earth link under various conditions are proposed.
Satellite communication, lasercom, turbulence, tracking error, bit error rate
Short address: https://sciup.org/146114814
IDR: 146114814 | UDC: 621.396:629.056.8
Воздействие микровибраций платформы космического аппарата и атмосферной турбулентности на канал связи оптического диапазона «Спутник - Земля»
Обсуждаются ошибки наведения на вероятность битовой ошибки оптического канала связи «Спутник - Земля» воздействие атмосферного канала. Представлены результаты численных оценок вероятности битовой ошибки для различных условий.
Text of the scientific article Satellite microvibration and atmospheric turbulence effect on Satellite-to-Ground optical communication link
The most capacious communication links are needed to deliver data from low Earth orbit satellites to ground data-processing centers. To provide near-realtime data transmission geostationary relay satellites are used. Due to point-to-point link architecture it is advantageous to use free space optical data transmission technics which provide more capacious communication links in comparison with radio-frequency systems with same onboard equipment mass and energy consumption.
This paper is devoted to some aspects of developing GEO-Earth optical link, namely simultaneous effect of satellite’s microvibration and atmospheric turbulence.
Theory
Assuming low atmospheric attenuation (i.e. “clear sky” conditions) there are two major factors on link performance – microvibrations of telescope base and effect of atmospheric turbulence on propagating laser beam. Both effects lead to statistical variance of received radiation intensity.
We assume that transmitter pitch and roll angle tracking errors due to microvibrations obey normal distribution. Total tracking error may be described as:
x = V x p + X 2 , (1)
where x p and x r are pitch angle and roll angle tracking errors respectively. Assuming that RMS errors for each angle are equal and that errors are independent, probability density function of the error x , measured from line of sight is described by Rayleigh distribution:
—
x 2 )
.
2a2 J
Since in the beam intensity is distributed by normal distribution, received intensity at distance z is [1]:
I ( z ,α)
p 2 f oa2) —--2exp —2 — I, z n w ( w )
where p is transmitted power, α is tracking error (line of sight misalignment), w is beam divergence.
At the receiver plane, random transmitter’s tracking error leads to additional amplitude modulation of the signal. Assuming that unmodulated signal is transmitted, probability distribution function of received signal power is given by [2]:
g ( I ) = f ( I ( z ,a) —1 ) • "d ( I ( z ,a) —1 ) . d α
As it seen from (3) that beam divergence w decrease leads to higher powers at receiver however beam divergence w decrease to values comparable with tracking error will lead to unwanted signal modulation.–
Besides modulation due to tracking error, atmospheric effects on laser beam must be considered. Major atmospheric effects are:
– atomic and molecular absorption
– Rayleigh scattering
– aerosol absorption and scattering
– the effect of atmospheric turbulence
– astronomical aberration
We assume negligible probability of rescattering then photon which been removed from beam reaches the receiver. Thus atomic and molecular absorption, Rayleigh scattering, aerosol absorption and scattering lead only to signal attenuation. The effect of atmospheric turbulence results in random amplitude modulation and obeys statements (5-9) [3]:
f T ( I ) = exP
2πσ I 2 I
a 2 = A (exp2^ X — 1)
—
2σ
I
to aX = 0.56k76 sec(Z )11/6 J C„2(h)h5/6dh
A =
1 + 1.1
f D rx2
( X h s cos(Z)

—1
f to Л6 / 7
h s =
J C( h ) h 2 dh
TO
J C 2 ( h ) h 5/6 dh
-
1 0 J
Where f τ( I ) is modulation probability distribution function, < I > is received signal power assuming no turbulence, ζ is zenith angle, k is wavenumber, D rx is receiver aperture diameter, Cn 2 is refractivity structure parameter.
To describe Cn 2 numerically we used model:
C „ 2( h ) = 0.00594

(10 5 h ) exp [ —) + v 7 ( 1000 J
+2.7 x10 — 16
, , ( h )
+ A exp--
( 100 J
Accounting atmospheric turbulence and tracking error effects signal probability distribution function at the receiver may be described as conjunction:
fg ( I ) = J g ( I ) f т ( I - x ) dx . (11) 0
To define an optimal divergence angle, we consider bit error rate – an erroneous bit to total bit received quantity ratio. In case of using on-off keying modulation, bit error rate may be estimated as [2]:
BER ( Q ) = 2 erfc
f Q )
IV2 J,
1 ^ i, — i where erfc(x) = —j= fexp(—t2)dt and Q = ——0,=
In Q-factor definition there are:
Vn x ^< 0 0 + ^c.
-
i 0,1 – is electrical current, generated by photodetector when 0 and 1 bits are received respectively. Since signal at the receiver is random we should consider mean BER given as:
TO 3 1 0
-
< BER >= J BER ( Q ) g ( I ) di = J BER ( Q ) g ( I ) di (13)
p 2
where 1 0 = —- is intensity on a beam axis. The replacement of limit of integral in (13) is valid z 2π w 2
because
g(I)
is negligible for
I
> 3
I
0
.
Atmospheric conditions
The link model built allows calculating BER for given link parameters and environmental conditions. Atmospheric parameters used in numerical calculations are shown at Fig 1-3.
Solid line corresponds to measured Cn 2 [4], dotted – model approximation used in this paper.
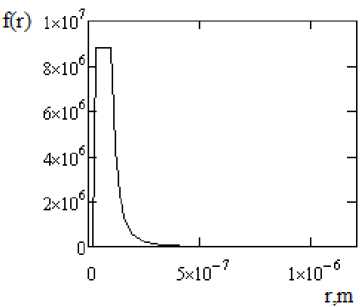
Fig. 1. Model aerosol particle size distribution [6]
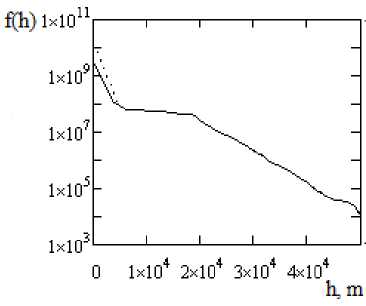
Fig. 2. Model aerosol particle height distribution [6] Solid line corresponds to meteorological range of visibility at the surface of 23 km, dotted line – 5 km
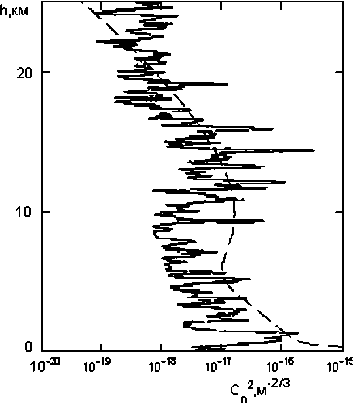
Fig. 3. C n vertical profile
Numerical results
Fig. 4, 5 provides calculated BER versus beam divergence for given parameters and conditions for GEO-Earth downlink scenario (shown at Table 1).
It was assumed what there is continental aerosol mix with average refractive index 1.4+0.016i. Vertical aerosol distribution was calculated using model [3] basing on meteorological range of visibility at the surface.
Solid line corresponds to meteorological range of visibility at the surface of 23 km, dotted line – 5 km
As is seen from Fig. 4, 5 there is BER minimum due to simultaneous effect of satellite microvibration and atmospheric turbulence. The minimum of BER-curve corresponds to “optimal” transmitter’s divergence and strongly depends on meorological conditions. There is also slight relationship between “optimal” transmitter’s and receiver design.
Table 1. Link parameters
|
Parameter |
Value |
|
Receiver’s latitude |
56° N |
|
RMS tracking error due to satellite microvibration (roll) |
1′′ |
|
RMS tracking error due to satellite microvibration (pitch) |
1′′ |
|
Carrier wavelength |
1590 nm |
|
Transmitter power |
5 W |
|
Transmitting and receiving optics transmittance |
0.75 |
|
Receiver optical filter bandpass |
10 nm |
|
Receiver detector type |
APD |
|
Modulation |
On-off keying, 500 Mbps |
|
Receiver effective aperture |
350mm/750 mm |
Thus worse expected meteorological conditions as well as receiver design must be taken into account at early stages of onboard optical communication hardware development to reach the best possible BER.
Воздействие микровибраций платформы космического аппарата и атмосферной турбулентности на канал связи оптического диапазона
