Satellite monitoring of grain crops in the south part of Western Siberia

Author: Sakharova Elena Yu., Sladkikh Lyubov A., Kulik Ekaterina N.
Journal: Журнал Сибирского федерального университета. Серия: Техника и технологии @technologies-sfu
Article in issue: 7 т.9, 2016.
Free access
In agriculture an important issue is to obtain reliable information on the status of agricultural land. The article presents the most recent results of grain crops’ status monitoring based on remote sensing data on the example of the south part of Western Siberia.
Remote sensing, vegetation monitoring, vegetation index
Short address: https://sciup.org/146115131
IDR: 146115131 | UDC: 528.88 | DOI: 10.17516/1999-494X-2016-9-7-1019-1024
Спутниковый мониторинг состояния посевов зерновых культур юга Западной Сибири
В сфере сельского хозяйства актуальным вопросом является получение достоверной информации о состоянии сельскохозяйственных угодий. В статье на примере южных территорий Западной Сибири представлены результаты использования данных дистанционного зондирования Земли для осуществления мониторинга состояния посевов зерновых культур.
Text of the scientific article Satellite monitoring of grain crops in the south part of Western Siberia
Satellite data usage allows to track grain crops’ status: to monitor the crops progress dynamics, the change detection of crops status, to diagnose the plant response to weather factors or pests, to keep watch over growing seasons, etc. For the crops status estimation vegetation indices (NDVI) were calculated on satellite data base. The indices represent the general activity of vegetation. The Siberian center (SC) FGBU “SRC “Planeta” has been using remote sensing data for agricultural tasks since 2005. The pioneer studies have been linked to spring wheat yield prediction. The experiments took place on the test farms of Novosibirsk Region and let accumulate a large amount of vegetation index values [1, 2]. These prognostic values were compared with the actual values of productivity forecast accuracy was figured out to evaluate the experiments. The table shows the results of forecast accuracy estimation within the farms of Novosibirsk Region; moreover, forecast accuracy was also evaluated for each district and within the whole region.
Grain crops status estimation
Within the period from 2001 to 2011 the found stable NDVI – crop yield dependence, accumulated NDVI values database within the test fields and extended statistical database of grain crops’ yield were the basis for the further research. Originally the farms with different farming level were selected for the research in accordance with agro-climatic zoning of Novosibirsk region. Later the algorithm of grain crops’ status estimation was formed based on the data analysis of yields prediction results. This algorithm was compiled as the software modules in IDL and it uses the functionality of ENVI software system and MODIS Conversion Tool Kit. Estimation algorithm based on satellite data use enables to divide the crops into three gradations particularly used in agrometeorology: depression, moderate or wealthy status of crops. [3] The current and retrospective data from Terra and Landsat satellites are used in this research topic. For example, information from Terra, due to its frequent cycles and large coverage area, is used for regular crops status monitoring over vast territory.
According to the available information on placing croppers on test farms, the NDVI values had been evaluated over a long period of time within vegetation periods and then plotted in graphs reflecting the general tendencies of crops progress (Fig. 1). Based on the actual results analysis, with rely on farming levels of the farms’ set, the threshold NDVI values that were necessary for the auto-run crops classification into agrometeorological gradations have been calculated.
Table. The results of forecast accuracy estimation within the farms of Novosibirsk Region
|
Annual Seasons |
Average Forecast Accuracy, % |
|||||||||||
|
8 |
о 8 |
8 |
о 8 |
о 8 |
8 |
8 |
s |
8 |
8 |
|||
|
Number of Farms |
26 |
30 |
36 |
38 |
50 |
36 |
56 |
41 |
39 |
34 |
27 |
|
|
Number of Fields |
161 |
201 |
236 |
229 |
277 |
181 |
528 |
325 |
297 |
399 |
320 |
|
|
Forecast Accuracy within the Farms, % |
88 |
82 |
97 |
84 |
90 |
97 |
87 |
- |
74 |
81 |
81 |
86,1 |
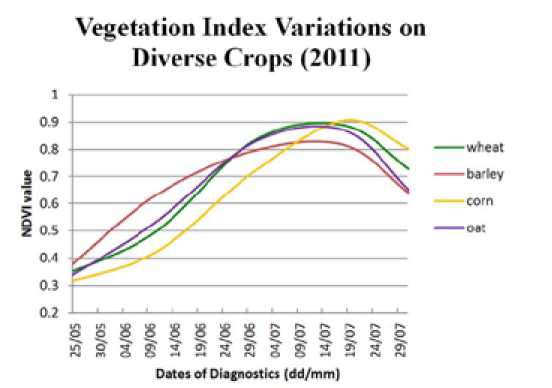
Fig. 1. Crops Progress Dynamics
Under the development of crops status estimation algorithm, the necessity to separate croplands from the rest of region territory appeared as one of the primary problems. The masks of non-cultivated lands were built for each study area based on Landsat processed images. Forestlands, elements of hydrography, habitations, pastures were specified as a category of non-cultivated areas. The use of masks in the software modules lets assess specific territory only where the crops are concentrated.
Since 2012 the estimation of grain crops’ status has been applied in Novosibirsk, Omsk and Kemerovo regions as well as in Altai Krai. The results of satellite data processing are formed as maps of grain crops’ status estimation with the evaluated percentage of each gradation. These maps are created throughout vegetation period for each study area and they enable to estimate the overall dynamics of crops progress. For this purpose, according to Terra’s information vegetation index (NDVI) per every cloudless day is calculated and then the achieved raster is overlaid with the masks of overcast and/or non-cultivated lands. The rest of NDVI values that belong to arable land (non-excluded with masks), is divided into three grades (depression, moderate or wealthy crops status) in accordance with the previously calculated thresholds. Hydrographic elements, settlements, administrative boundaries are plotted on the obtained image. The final product design includes the map legend setting.
Crops status operational monitoring results for Novosibirsk region in 2015
Grain crops’ status estimation maps reflect the influence of weather and external factors on germination and crops vegetative progress. This implemented algorithm has shown its efficiency to estimate crops status for all scale ranges: for the entire region territories, individual farms or single fields. For a single-field estimation procedure we use values taken automatically on control points. Every farm has its own set of such points. Fig. 2 shows the estimation map of grain crops’ progress within cultivated lands of Novosibirsk region at the time of June 22, 2015. Next figures present more detailed estimation maps of crops progress: for Kupinsky District – district-level map (Fig. 3) and estimation map for individual farms (Fig. 4).
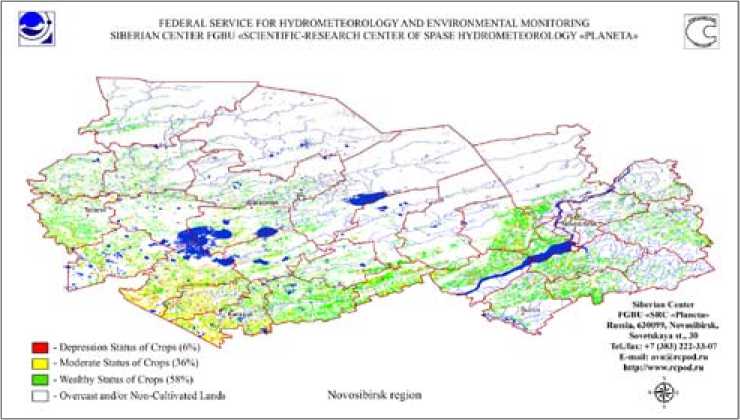
Fig. 2. Estimation Map of Grain Crops' Status: Regional Level of Details, Novosibirsk Region, June 22, 2015
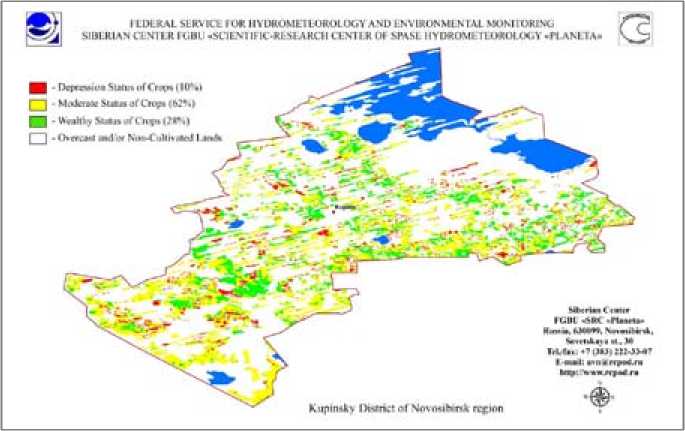
Fig. 3. Estimation Map of Grain Crops' Status: District Level of Details, Kupinsky District of Novosibirsk Region, June 22, 2015
The first decade of May 2015 was quite convenient for tilling, although there had been further degrading of the situation due to precipitation at the end of the month. As maps show the crops status in the southern regions (Karasuk, Bagan, Kupino) is lightly worse in comparison with the whole territory of Novosibirsk region. In this case low soil moistening in these areas had an impact on grain crops’ progress. Due to the lack of precipitation quantity during the next period at the end of vegetative season this difference became more appreciable. By June 22nd, 2015 6% of crops was referred to Depression Status, 36% – to Moderate Status, 58% – to Wealthy Status within Novosibirsk Region. By July 17th, 2015
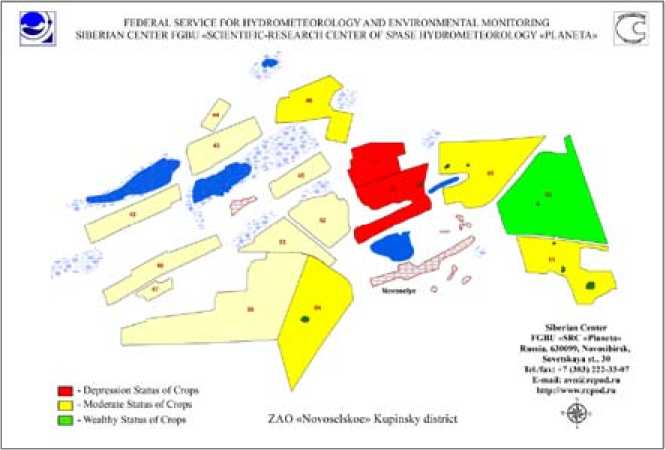
Fig. 4. Estimation Map of Grain Crops' Status: Individual Farm Level of Details, ZAO «Novoselskoe» Kupinsky District, June 22, 2015
the grain crops’ status within Novosibirsk Region had already had the next values: Depression Status of crops – 13%, Moderate Status – 58%, Wealthy Status – 29%. At the same time in the southern regions more than 30% of crops was referred to Depression Status.
Conclusion
The working results of the crops status estimation algorithm based on satellite data use were compared with independent ground agrometeorological surveys conducted by specialists of hydrometeorological service together with local farmers [4]. On average, the difference between the grain crops’ status estimation values from ground and remote methods within four years of monitoring has amounted to 10% in Novosibirsk Region, 11% in Altai Krai, 8% in Kemerovo Region.
This implemented complex of software modules is highly efficient due to: automated collecting of vegetation indices values on control points; automated calculation of thresholds based on the longstanding monitoring analysis; integration of unique masks for non-cultivated lands. Masks reflect the changes in the land-use system, their actualization is ensured by remote sensing data updating and has a positive impact on the algorithm results quality. The algorithm of grain crops’ status estimation based on the satellite data analysis is able to provide operational crops status monitoring on a regional level as well as on single fields level. Accumulated knowledge base of crops status estimation allows analyzing the crops dynamics. The obtained crops status estimation maps are transferred on-line to the agrometeorological forecast departments of FGBU “West Siberian UGMS”.
References Satellite monitoring of grain crops in the south part of Western Siberia
- Сахарова Е.Ю., Сладких Л.А., Захватов М.Г. Спутниковый мониторинг состояния посевов и прогнозирование урожайности зерновых культур на юге Западной Сибири. Интерэкспо ГЕО-Сибирь-2014. X Междунар. науч. конгр., Междунар. науч. конф. «Дистанционные методы зондирования Земли и фотограмметрия, мониторинг окружающей среды, геоэкология», Новосибирск: СГГА, 2014, 1, 67-72
- Сладких Л.А., Кулик Е.Н., Сахарова Е.Ю. Мониторинг посевов зерновых культур юга Западной Сибири по данным спутниковых наблюдений. Региональные проблемы дистанционного зондирования Земли: материалы Междунар. науч. конф, Красноярск: Сиб. федер. ун-т, 2014, 329 333
- Сапрыкин Е.И., Сладких Л.А., Кулик Е.Н. Оценка состояния посевов зерновых культур по данным дистанционного зондирования Земли. Интерэкспо ГЕО-Сибирь-2015. XI Междунар. науч. конгр., Междунар. науч. конф. «Дистанционные методы зондирования Земли и фотограмметрия, мониторинг окружающей среды, геоэкология», Новосибирск: СГУГиТ, 2015, 1, 40-46
- Сахарова Е.Ю., Сладких Л.А., Кулик Е.Н. Спутниковый мониторинг состояния посевов зерновых культур с использованием индекса вегетации. Интерэкспо ГЕО-Сибирь-2015. XI Междунар. науч. конгр., Междунар. науч. конф. «Дистанционные методы зондирования Земли и фотограмметрия, мониторинг окружающей среды, геоэкология», Новосибирск: СГУГиТ, 2015, 1, 47-52
