Scenario-based approach to modeling bankruptcy risks for enterprises in various industries

Author: Naumov I.V., Nikulina N.L., Bychkova A.A.
Journal: Economic and Social Changes: Facts, Trends, Forecast @volnc-esc-en
Section: Theoretical and methodological issues
Article in issue: 2 т.17, 2024.
Free access
The deterioration of the financial situation of enterprises in various industries, which is currently observed in many regions, creates prospects for reducing their financial stability and the emergence of bankruptcy risks. It is necessary to develop existing methodological approaches so as to assess and forecast the risks of bankruptcy for industries as a whole, rather than for individual enterprises, and form effective state support mechanisms for them. The main goal of our research is to develop these approaches. The novelty of the presented approach consists in the following facts: we develop an algorithm for scenario modeling and forecasting the risks of bankruptcy for industries, including an assessment of the financial stability of the industries under consideration and the probability of bankruptcy; we design regression models showing the dependence of change in the probability of bankruptcy on a whole system of internal and external factors; we conduct autoregressive modeling of the dynamics of internal and external factors using a moving average (ARMA). Autoregressive modeling allows us to form the most probable, inertial forecast scenario for the next five years taking into account the preservation of the noted trends and the corridor of maximum possible values. The forecast values of the dynamics of these factors and the constructed regression models serve as a basis for designing forecast scenarios for changes in the probability of bankruptcy of large, medium and small machine-building enterprises in the Sverdlovsk Region. As a result, we reveal that major machine-building holdings of the Sverdlovsk Region that do not have sufficient working capital, have a low level of solvency, and experience a significant debt burden are most susceptible to bankruptcy risks. In order to increase financial stability and effective development of large machine-building enterprises, government support is required.
Bankruptcy risks, financial stability, industries, autoregressive modeling, scenario forecasting
Short address: https://sciup.org/147243852
IDR: 147243852 | UDC: 332.14 | DOI: 10.15838/esc.2024.2.92.9
Text of the scientific article Scenario-based approach to modeling bankruptcy risks for enterprises in various industries
The research was supported by Russian Science Foundation grant 24-28-00704 “Scenario modelling and bankruptcy risks forecasting for industrial sectors in the Sverdlovsk Region” project/24-28-00704/).
The industries make the main contribution to the formation of the gross regional product of the constituent entities of the Russian Federation. Financial insolvency of enterprises of the real economy entails a serious deterioration in the socioeconomic and financial condition of the regions. The 2020 lockdown associated with the coronavirus pandemic and the worsened geopolitical situation, serious sanctions pressure on the Russian economy have aggravated the already difficult situation in the real economy. The growing political tension, the breakdown of international production interrelations, the loss of foreign markets for products manufactured in the Russian regions form threats to the economic and financial development of enterprises in various industries. Today, many Russia’s regions have a steady tendency to reduce the number of enterprises in various spheres of economic activity, which negatively affects the development of the social sphere in the region: the unemployment rate is increasing, incomes, the standard of living and quality of life are decreasing.
In the current circumstances, the study devoted to scenario modeling and forecasting of bankruptcy risks of industrial enterprises in such an industrially developed region as the Sverdlovsk Region becomes particular relevant. In the conditions of growing crisis phenomena in the economy, the most important task of public authorities is to develop anti-crisis measures to support the real economy, which is the basis of socio-economic development of any territorial system. It is necessary to assess the financial stability of industrial enterprises, to carry out multivariate forecasting of the dynamics of their bankruptcy risks, to analyze the factors concerning formation and development of these risks, as well as socio-economic consequences in case of deterioration of the macroeconomic situation in the regions to determine the effective mechanisms of its support and to develop an appropriate industrial policy. The currently used methodological approaches have a number of limitations and do not allow assessing the risks of loss of financial solvency of enterprises of industries as a whole, they are used to forecast the bankruptcy risks of individual enterprises. The data base formed by the Federal State Statistics Service does not allow for a full-fledged analysis of the financial position of enterprises, their financial stability, so a new methodological approach is required.
Our research is devoted to the design of a new theoretical and methodological approach to scenario modeling and forecasting of bankruptcy risks of industrial enterprises in the region, the implementation of which will make it possible to create effective mechanisms of state support of industries, increase their financial sustainability for sustainable socio-economic development of the territory. We defined the following tasks to achieve the aim of the research: to generalize the research results in the field of assessing the bankruptcy risks of industrial enterprises; to develop a methodological approach to the assessment, scenario modeling and forecasting of bankruptcy risks of enterprises, taking into account the factors concerning internal and external environment; to approbate the developed approach for forecasting the bankruptcy risks of machine-building enterprises in the Sverdlovsk Region (assessing the probability of enterprises’ bankruptcy in the industry using the Altman methodology, regression modeling of bankruptcy risks of enterprises,
ARMA -modeling of the dynamics of internal and external environment factors in the region that form these risks, development of forecast scenarios of changes in the probability of enterprises’ bankruptcy).
Enterprise bankruptcy risk forecasting models
The scientific literature distinguishes two main approaches to assessing enterprises’ bankruptcy risks: multivariate discriminant analysis and econometric analysis. The founders of the first approach to assessing the bankruptcy risks of enterprises are W. Beaver (Beaver, 1966), who used the financial statements of companies to determine the signs of bankruptcy, and E. Altman (Altman, 1968), who used statistical methods of analysis to identify enterprises with a high risk of bankruptcy, with uncertain financial condition and with high financial stability. These methods are still used by researchers as a basis for the formation of models for assessing the bankruptcy risks of economic entities ( Tab. 1 ). The methods of econometric analysis are also used in the assessment of bankruptcy risks of enterprises. For example, J.A. Ohlson (Ohlson, 1980) used logistic regression to predict bankruptcy. J. Kaczmarek et al. analyzed bankruptcy threats using forecasts derived from the multivariate logit model (Kaczmarek et al., 2021).
L. Cultrera and X. Bredart used a regression model to predict the bankruptcy of Belgian enterprises. Bredart applied a regression model including control variables: size and age of the company, as well as financial indicators (profit, solvency and liquidity) to test the predictive power of the generated forecasts (Cultrera, Bredart, 2016). Regressions were applied by Z. Qin and Y. Chen to develop an early warning system of enterprise bankruptcy and assess the factors leading to financial crisis (Qin, Chen, 2010).
Econometric methods for assessing the bankruptcy risks of enterprises in certain industries have also been used by Russian researchers . A.N. Mogilat used the maximum likelihood
Table 1. Models for assessing enterprises’ bankruptcy risk using multivariate discriminant analysis
Some researchers have tried to predict the bankruptcy risks of enterprises of industries with the help of regression models, highlighting the characteristic features of their development. In particular, A.M. Bat’kovskii et al. assessed the bankruptcy risks of enterprises of the defense industry complex (Bat’kovskii et al., 2016). N.A. Kazakova, A.F. Leshchinskaya, A.E. Sivkova considered the problems of predicting the bankruptcy risks of companies of the mining and metallurgical complex. Their study proved that discriminant models can serve only for express testing of the probability of bankruptcy of enterprises because they take into account a limited number of factors, while regression modeling allows assessing the impact of various factors on the financial condition of enterprises and more accurately assessing the probability of their bankruptcy (Kazakova et al., 2018). T.K. Bogdanova and Yu.A. Alekseeva developed and tested a set of regression models for assessing the financial condition and forecasting bankruptcy risks of manufacturing enterprises. The authors noted that depending on the observed scenario the bankruptcy risks of enterprises can be forecasted for a period of one to four years with a sufficiently high degree of accuracy (Bogdanova, Alekseeva, 2011). Logistic regressions were used by E.V. Ivanova and T.I. Efremkova to forecast the bankruptcy of small business enterprises. The authors found that regression models provide more effective assessments of insolvency risk and provide extensive opportunities for testing the statistical significance of the model (Ivanova, Efremkova, 2020). Regression models were used by E.A. Fedorova,
L.E. Khrustova and D.V. Chekrizov to forecast the bankruptcy of enterprises in eight industries. The models helped the authors to specify the threshold values of indicators for assessing the probability of bankruptcy of enterprises for each industry (Fedorova et al., 2018).
The theoretical review of works has shown that the methods of bankruptcy risk assessment do not take into account the industry specifics of enterprises, they are more suitable for individual enterprises and are difficult to apply to the study of bankruptcy risks of enterprises in industries. These methods are not aimed at studying the dynamics of bankruptcy risks of enterprises, do not assume the formation of forecast scenarios of their development in the future. In addition, the existing models and methods do not take into account the influence of internal and external environment factors on the formation and development of risks. The foreign methods available in the scientific literature are difficult to adapt to the assessment of bankruptcy risks of Russian enterprises due to the incomparability of companies’ reporting standards.
Methodological approach of the research
To forecast the bankruptcy risks of enterprises in the industrial sectors, we need a new methodological approach that helps us to assess the financial stability not of individual enterprises, but of the industry as a whole, as well as the probability and bankruptcy risks, taking into account the impact of a system of internal and external environmental factors; to model the forecast scenarios of changes in the probability of bankruptcy of enterprises, to choose the optimal measures of their state support in the framework of this or that scenario. For a correct and reliable assessment of bankruptcy risks of industrial enterprises at the initial stage of the developed methodological approach ( Fig. 1 ) we propose to systematize the data of accounting statements of enterprises for mining, production and distribution of electricity, gas and water, as well as manufacturing companies.
Figure 1. Algorithm of scenario modeling and forecasting of bankruptcy risks of industrial enterprises in the region
Industries:
|
Mining |
||
1. Systematization of accounting data of enterprises by industries
Electricity, gas and water production
2. Assessment of financial position and sustainability of enterprises of industries:

Metallurgical production
Financial liquidity risks
Risks of losing solvency
Machine production
9. Assessment of priorities of state financial support to industries
Vehicle production
Risks of lossing financial independence from external creditors

Electrical equipment production
I Risks of deficit of own working capital
Risks of reduced capital turnover and product competitiveness
Chemical production
8. Forecasting of socioeconomic consequences from the implementation of scenarios of changes in the risks of bankruptcy of enterprises
Production of rubber products
Risks of decrease in efficiency of production processes, capital utilization

|
Production of non-metallic products |
||

|
z |
Food production |
|
|
4_ |
3. Assessment of the probability of bankruptcy of enterprises of industries using the Altman methodology
7. Regression modeling of the impact of bankruptcy risks of industrial enterprises on the indicators of socioeconomic development of the region
Source: own compilation.


Textile and garment manufacturing; manufacture of clothing, leather goods and footwear
Wood processing; pulp and paper production; publishing and printing activities
|
4. Regression modeling of bankruptcy risks of industrial enterprises under the influence of internal and external environment factors |
г Л
(inertial, optimistic, pessimistic)
|
|||
|
5. ARIMA / ARMA-modeling of dynamics of internal and external environment factors in the region ("controlled variables") and formation of the most probable forecasts of their changes |
||||
The use of primary reporting will make it possible to obtain a wide range of indicators characterizing the dynamics of financial development of enterprises of industries, which is absent in statistical compilations.
At the next stage of the study , we assess the financial position and financial sustainability of the enterprises of the above industries by liquidity, business activity (turnover of fixed and current assets, inventories, accounts payable and receivable), resource utilization efficiency (profitability of assets, production activities and sales). These indicators were used, for example, to assess the financial stability of enterprises of metallurgical complex by M.A. Pechenskaya-Polischuk and M.K. Malyshev (Pechenskaya-Polischuk, Malyshev, 2021). At this stage, the liquidity of the enterprises of the industries is assumed and assessed ( Tab. 2 ) by comparing the rate of realization of the most liquid (A1), quickly realizable (A2), slowly realizable (A3) and difficult to realize (A4) assets of the enterprises and the maturity of their liabilities – the most urgent (P1), short-term (P2), long-term (P3) and permanent (P4).
Assessment of the provision of enterprises with reserves (F ), functioning capital (F ) and the total s f amount of capital at the expense of all sources (Fo ) will make it possible to conclude the financial stability of companies (Tab. 3):
Fs = WC0 - SL, Ff = WC0 + Llt - SL, Fo = WCo + Lit + Lst-SL, (1)
where WCo – own working capital, rubles;
ZL – stock level of raw materials and supplies, rubles;
Llt – long-term liabilities, rubles;
Lst – short-term liabilities, rubles.
Calculation of the above indicators in dynamics from 1999 to 2022 for the whole set of enterprises of each industry sector will make it possible to analyze the dynamics of financial development of industries and assess the risks of loss of financial stability. We propose to calculate the presented indicators for separate groups of enterprises depending on their size (large, medium-sized and small). This will make it possible to take a differentiated approach to the study of the financial position and sustainability
Table 2. Conditions for assessing the solvency of enterprises in the industry
|
Conditions |
Conclusions |
|
А1 ≥ P1; А2 ≥ P2; А3 ≥ P3; А4 ≤ P4 |
Absolute liquidity (solvency) of the company |
|
А1 + А2 ≥ P1 + P2; А4 ≤ P4 |
Current liquidity, it indicates the solvency of the enterprises of the industry in the near future |
|
А3 ≥ P3; А4 ≤ P4 |
Prospective liquidity – forecast of solvency based on comparison of future receipts and payments |
|
А4 ≤ P4 |
Insufficient level of prospective liquidity |
|
А4 ≥ P4 |
Balance sheet is not liquid (the company is not solvent) |
|
Source: own compilation. |
|
Table 3. Conditions for assessing the financial stability of enterprises
|
Conditions |
Degree of financial stability of enterprises in the industries |
|
F s > 0, F f > 0, F o > 0 |
Absolute financial stability |
|
Fs< 0, Ff > 0, Fo > 0 |
Normal financial stability |
|
F s < 0, F s < 0, F o > 0 |
Unstable financial situation |
|
Fs< 0, Ff< 0, Fo< 0 |
Crisis financial situation |
|
Source: own compilation. |
|
of enterprises of industries in the region, to identify the type of enterprises experiencing the most serious financial difficulties and most exposed to the bankruptcy risks.
At the third stage , the research proposes to estimate the probability of bankruptcy of enterprises of industries. The theoretical review of works has shown that the methods of discriminant evaluation of bankruptcy probability are not universal for the study of all industries. For example, the methodology of E.S. Lyutova (Lyutova, 2011) is more suitable for assessing the probability of bankruptcy of metallurgical enterprises, the methodology of E.A. Fedorova and Yu.V. Timofeev (Fedorova, Timofeev, 2015) – for construction and agriculture. The methods of M.V. Evstropov (Evstropov, 2008), T.K. Bogdanova and Yu.A. Alexeeva (Bogdanova, Alekseeva, 2011), E.A. Fedorova and Yu.V. Timofeev (Fedorova, Timofeev, 2015), E.V. Shirinkina (Shirinkina, 2015), J. Legault (Legault, 1987) are used exclusively for manufacturing industries. A more universal methodology, suitable for enterprises of various industries, is the model of W. Beaver (Beaver, 1966). However, its application complicates the assessment of the probability of bankruptcy of enterprises in the industries, since it uses a limited set of indicators and does not assume the calculation of an integral indicator. In addition, the methods under consideration differ in the level of accuracy of the forecast. The five-factor model of E. Altman (2) is considered to be the most reliable for the Russian economy, with a forecast accuracy of 95% and more:
Z = 1.2x1 + 1.4x X2 + 3.3X X 3 + 0.6x X 4 + X 5, (2)
where Х1 – ratio of working capital to the sum of all assets of the company;
Х2 – ratio of retained earnings to total assets of the enterprise;
Х3 – ratio of operating profit to the sum of all assets of the enterprise;
Х4 – ratio of market value of shares to the sum of all liabilities;
Х5 – ratio of revenue to the sum of all assets of the enterprise.
The main advantage of this model is that it takes into account factors reflecting various aspects of the organization’s activity, which makes the methodology more universal and allows obtaining a more accurate forecast of the probability of bankruptcy compared to other methods. At the same time, it is worth noting that Altman’s model is applicable only to companies whose securities are traded on the stock exchange, and this limits the possibility of applying the model in the study of the probability of bankruptcy of industrial enterprises, since not all enterprises are joint-stock companies. Exclusion of factor X4 from the model will allow more reliably estimating the probability of bankruptcy of industrial enterprises, since the sample of observations will include not only large, but also medium and small non-equity enterprises. We will use the modified Altman methodology (without the variable X4) to assess the probability of bankruptcy of each enterprise separately, at the next stage – to calculate the average level of this indicator for large, medium and small enterprises. The weighted average value of Z in the Altman model for all enterprises will allow estimating the probability of bankruptcy of each industry sector as a whole. When interpreting the results, it is assumed to use not the standard threshold values of E. Altman, but the values calculated using standard deviations from the geometric mean for all enterprises of the industry for the whole period under consideration from 1999 to 2022. The high level of probability of bankruptcy of the enterprises of the industries will be observed at the values of Z-statistics below the geometric mean by one standard deviation. The increased level of probability of bankruptcy will be observed at the enterprises of the industries with the value of Z-statistics below the geometric mean, but at the same time not exceeding one standard deviation from the geometric mean. Moderate level of probability of bankruptcy of enterprises will be observed at the values of Z-statistics close to the geometric mean, and the values exceeding it will indicate normal financial stability and low level of probability of bankruptcy. Calculation of Altman statistics in dynamics for the period from 1999 to 2022 will allow identifying the industries most exposed to bankruptcy risks.
The fourth stage of the methodological approach involves the construction of regression models that assess the impact of internal and external environmental factors ( Tab. 4 ) on the dynamics of the probability of bankruptcy of industries to assess the bankruptcy risks of enterprises in the industries. The factors that have a negative impact will be considered by us as the key risks of bankruptcy of enterprises and will be used as “controlled variables” in the design of forecast scenarios.
The review of the scientific literature shows that studying factors influencing the bankruptcy risks of enterprises is not given enough attention. The works focus on assessing the impact of internal factors, such as asset turnover (Karas, Reznakova, 2015; Alifiah, 2014), term liquidity (Petersen, Plenborg, 2012), current liquidity (Zmijewski, 1984), return on sales (Fedorova et al., 2016). Among external factors, the influence of unemployment rate (Kloster, Jacobsen, 2005), inflation (Wadhwani, 1986), interest rates on loans (Kangari, 1988), lending volumes (Fedorova et al., 2016). Our research assumes a significant expansion of the range of assessed internal and external factors (see Tab. 4). They were selected based on the availability of official statistical data for the period under consideration. The model does not include such a variable as gross regional product as a factor, since this indicator reflects the volume of all goods produced in the constituent entities of the
Table 4. System of internal and external factors concerning change probability of bankruptcy of industrial enterprises
|
External factors |
Internal factors |
||
|
Ri |
Inflation rate in the region, % |
La |
Absolute liquidity |
|
Rc |
Interest rate on bank loans for legal entities in Russian rubles, % |
Lu |
Urgent liquidity |
|
Lc |
Current liquidity |
||
|
Qc |
Quotes of foreign currencies (dollar), rubles |
Lm |
Liquidity in mobilizing funds |
|
Ru |
Unemployment rate in the region, % |
Pc |
Working capital provision |
|
Eap |
Economically active population in the region, people |
Fi |
Financial independence level |
|
Rde |
Debt and equity ratios |
||
|
Ifc |
Investments in fixed capital, rubles |
Tca |
Turnover of current assets |
|
Da |
Depreciation of fixed assets, % |
Tfa |
Fixed assets turnover |
|
Eia |
Expenditures on innovation activities of organizations in the region, million rubles |
Ti |
Inventory turnover |
|
Tap |
Accounts payable turnover |
||
|
Dt |
Volume of developed advanced production technologies, units |
Tr |
Receivables turnover |
|
Pa |
Profitability of core activities, % |
||
|
Ut |
Volume of used advanced production technologies, units |
Ps |
Profitability (unprofitability) of sales, % |
|
Pnca |
Profitability of non-current assets, % |
||
|
Et |
Export volume of technologies and services of technical nature, rub. |
Pca |
Profitability of current assets, % |
|
Fs |
Inventory availability |
||
|
It |
Volume of imports of technologies and technical services, rub. |
Ff |
Availability of functioning capital |
|
Fo |
Provision of total capital |
||
|
Source: own compilation. |
|||
Russian Federation, services rendered and in our case is a resultant feature in modeling the socioeconomic consequences of bankruptcy of industrial enterprises in the region. This indicator cannot be used as a factor sign in modeling the probability of bankruptcy of enterprises in a particular industry.
We propose to form regression models for large, medium-sized and small enterprises separately to build reliable forecast scenarios of changes in bankruptcy risks of industries. This will improve the homogeneity of the data sample and obtain more reliable results, to assess the differentiated influence of the factors under consideration.
We assume to conduct autoregressive modeling of the dynamics of factors presented in Table 4, using a moving average (ARIMA / ARMA) to project the forecast scenarios of changes in the bankruptcy risks of industrial enterprises in the region at the next (fifth) stage . Formation of inertial forecast of the development of the dynamics of factors using this method will help to forecast the most probable scenario of changes in the dynamics of bankruptcy risks of enterprises of industries at the next stage , taking into account the preservation of established trends. The marginal forecast values obtained as a result of autoregressive modeling of factor dynamics will be used to form extremely optimistic and pessimistic scenarios of bankruptcy risk development of enterprises in the industries.
The seventh stage involves regression analysis of the relationship between the level of bankruptcy probability (Altman Z-statistics for all industries in the aggregate) and such indicators of socioeconomic development of the regions as the volume of GRP, unemployment rate, population income, etc. to assess the socio-economic consequences from the implementation of the designed scenarios of changes in the bankruptcy risks of enterprises in the industries. Separately, we plan forming a model of dependence of these indicators on the bankruptcy risks of enterprises of each industry. This will make it possible to identify the industries whose bankruptcy risks will have the greatest negative impact on the socio-economic development of the regions.
The economic-mathematical dependencies established in the course of modeling at the next stage will be used to forecast socio-economic consequences for the region from the possible implementation of projected scenarios of changes in the risks of bankruptcy of enterprises in the industries. The values of the probability of bankruptcy of enterprises (Altman Z-statistics), calculated as a result of the formation of forecast scenarios at the sixth stage of this methodological approach, will be used as factor attributes in the construction of these forecasts.
The industries identified in the course of modeling, which are most exposed to bankruptcy risks and have the most negative impact on the dynamics of socio-economic development of regions, as well as the built forecast scenarios of changes in bankruptcy risks will allow determining the sectoral priorities of state financial support to ensure the optimal vector of development of the real sector of the economy in the region, and selecting the optimal mechanisms of its implementation at the final stage . The development of a whole system of forecast scenarios of changes in the risks of bankruptcy of industrial enterprises due to the use of “controlled variables” in scenario modeling (factors concerning internal and external environment), as well as appropriate mechanisms of state support will help to form a system to prevent the implementation of negative scenarios for socio-economic development of the region and determine the optimal measures of state support of the real economy to reduce the bankruptcy risks of enterprises.
Research results
The Sverdlovsk Region is an industrially developing region with a powerful machine-building complex. The production of machinery and equipment is one of the key industries in the region, its share in the structure of manufacturing industries in 2022 was 10.4% 1 . The largest machinebuilding enterprises in the region (with annual revenues of over 2 billion rubles) are PJSC Uralmashzavod, Mashine-Building Holding JSC, PSM-Hydraulics, JSC Pnevmostroymashina, OOO Uraldomnoremont-Yekaterinburg, Mechanical
Engineering Company Technex, Uralhimmash and AO AMZ Ventprom. They have liquid assets, their structure according to the data of 2022 is dominated by cash and short-term financial investments (22.1%), quick-realizable assets (31.3%). The enterprises have solvency, liquidity indicators slightly, but slightly exceed the normative values ( Tab. 5 ). At the same time, term liabilities of the enterprises are not covered by production stocks, liquidity at mobilization of funds throughout the period did not reach the normative value.
Table 5. Dynamics of indicators of financial position and sustainability of enterprises producing machinery and equipment in the Sverdlovsk Region
|
Indicator |
Size |
2012 |
2013 |
2014 |
2015 |
2016 |
2017 |
2018 |
2019 |
2020 |
2021 |
2022 |
|
Absolute liquidity (norm: > 0.2) |
Large |
0.02 |
0.03 |
0.03 |
0.03 |
0.02 |
0.06 |
0.07 |
0.06 |
0.06 |
0.09 |
0.42 |
|
Medium |
0.17 |
0.07 |
0.07 |
0.09 |
0.07 |
0.14 |
0.16 |
0.10 |
0.14 |
0.16 |
0.16 |
|
|
Small |
0.13 |
0.08 |
0.07 |
0.13 |
0.08 |
0.11 |
0.15 |
0.14 |
0.13 |
0.16 |
0.34 |
|
|
Urgent liquidity (norm: > 1) |
Large |
0.37 |
0.62 |
0.45 |
0.38 |
0.39 |
0.48 |
0.74 |
0.48 |
0.64 |
0.73 |
1.01 |
|
Medium |
0.62 |
0.70 |
0.66 |
0.76 |
0.76 |
0.75 |
0.84 |
0.80 |
0.84 |
0.84 |
0.87 |
|
|
Small |
0.54 |
0.59 |
0.56 |
0.62 |
0.60 |
0.52 |
0.61 |
0.71 |
0.69 |
0.84 |
0.97 |
|
|
Current liquidity (norm: > 1-2) |
Large |
0.79 |
1.16 |
0.74 |
0.70 |
0.67 |
0.74 |
1.09 |
0.87 |
1.05 |
1.22 |
1.43 |
|
Medium |
1.28 |
1.30 |
1.22 |
1.22 |
1.32 |
1.28 |
1.39 |
1.28 |
1.32 |
1.30 |
1.27 |
|
|
Small |
1.28 |
1.21 |
1.16 |
1.22 |
1.03 |
0.98 |
1.12 |
1.19 |
1.14 |
1.43 |
1.45 |
|
|
Liquidity in mobilizing funds (norm: > 0.5) |
Large |
0.41 |
0.53 |
0.28 |
0.24 |
0.27 |
0.24 |
0.36 |
0.39 |
0.40 |
0.49 |
0.41 |
|
Medium |
0.63 |
0.60 |
0.56 |
0.46 |
0.53 |
0.46 |
0.55 |
0.48 |
0.49 |
0.45 |
0.40 |
|
|
Small |
0.71 |
0.60 |
0.57 |
0.56 |
0.41 |
0.45 |
0.50 |
0.47 |
0.44 |
0.57 |
0.46 |
|
|
Working capital provision (norm: > 0.1) |
Large |
-0.68 |
-0.44 |
-0.68 |
-0.82 |
-0.82 |
-0.70 |
-0.63 |
-0.53 |
-0.33 |
-0.27 |
0.04 |
|
Medium |
0.22 |
0.22 |
0.15 |
0.15 |
0.21 |
0.20 |
0.18 |
0.15 |
0.14 |
0.12 |
0.13 |
|
|
Small |
0.15 |
0.08 |
0.04 |
-0.02 |
-0.10 |
-0.12 |
-0.04 |
-0.04 |
-0.08 |
0.23 |
0.14 |
|
|
Financial independence (norm: > 0.5) |
Large |
-0.06 |
0.19 |
0.11 |
0.02 |
-0.03 |
-0.03 |
-0.02 |
-0.07 |
0.00 |
0.05 |
0.28 |
|
Medium |
0.25 |
0.25 |
0.21 |
0.21 |
0.27 |
0.26 |
0.28 |
0.27 |
0.27 |
0.26 |
0.24 |
|
|
Small |
0.47 |
0.44 |
0.48 |
0.42 |
0.31 |
0.29 |
0.35 |
0.32 |
0.30 |
0.33 |
0.25 |
|
|
Debt and equity ratio (norm: < 0.7) |
Large |
-18.6 |
4.4 |
7.8 |
43.3 |
-34.1 |
-33.4 |
-52.2 |
-15.7 |
-874 |
20.2 |
2.54 |
|
Medium |
3.01 |
2.95 |
3.78 |
3.70 |
2.69 |
2.84 |
2.61 |
2.67 |
2.66 |
2.79 |
3.12 |
|
|
Small |
1.09 |
1.27 |
1.10 |
1.39 |
2.21 |
2.40 |
1.84 |
2.15 |
2.29 |
2.01 |
2.99 |
|
|
Balance sheet liquidity assessment |
Large |
БН |
БН |
БН |
БН |
БН |
БН |
БН |
БН |
БН |
БН |
ТЛ |
|
Medium |
ПЛ |
ПЛ |
ПЛ |
ПЛ |
ПЛ |
ТЛ |
ТЛ |
ТЛ |
ПЛ |
ПЛ |
ПЛ |
|
|
Small |
ПЛ |
ПЛ |
ПЛ |
БН |
БН |
БН |
БН |
БН |
БН |
ПЛ |
ПЛ |
End of Table 5
|
Indicator |
Size |
2012 |
2013 |
2014 |
2015 |
2016 |
2017 |
2018 |
2019 |
2020 |
2021 |
2022 |
|
Fixed assets turnover rate per year |
Large |
2.54 |
1.89 |
1.31 |
1.27 |
1.64 |
2.02 |
2.29 |
2.34 |
3.49 |
3.83 |
2.47 |
|
Medium |
64.4 |
31.2 |
23.3 |
21.6 |
24.2 |
23.9 |
16.2 |
12.4 |
10.4 |
11.9 |
12.9 |
|
|
Small |
3.76 |
6.97 |
3.33 |
3.12 |
4.39 |
5.39 |
5.28 |
4.60 |
4.65 |
4.53 |
10.4 |
|
|
Turnover of current assets per year |
Large |
1.04 |
1.04 |
0.78 |
0.76 |
0.88 |
0.87 |
0.87 |
0.73 |
0.88 |
0.85 |
1.39 |
|
Medium |
1.33 |
1.17 |
1.46 |
1.38 |
1.67 |
1.63 |
1.53 |
1.64 |
1.61 |
1.68 |
1.41 |
|
|
Small |
1.72 |
2.74 |
1.41 |
1.25 |
1.39 |
1.42 |
1.41 |
1.25 |
1.18 |
1.27 |
1.17 |
|
|
Inventory turnover per year |
Large |
1.24 |
1.29 |
1.23 |
1.43 |
1.77 |
1.81 |
2.00 |
1.54 |
1.52 |
1.49 |
0.85 |
|
Medium |
2.80 |
1.78 |
2.14 |
2.71 |
3.07 |
3.27 |
3.00 |
3.02 |
3.11 |
3.77 |
3.73 |
|
|
Small |
2.39 |
4.04 |
2.01 |
1.95 |
2.26 |
2.31 |
2.51 |
2.26 |
2.15 |
1.51 |
2.44 |
|
|
Accounts payable turnover rate |
Large |
1.48 |
1.81 |
1.92 |
2.25 |
3.07 |
3.00 |
2.87 |
2.72 |
2.57 |
2.09 |
1.30 |
|
Medium |
2.45 |
2.39 |
2.62 |
2.44 |
2.62 |
2.77 |
2.61 |
2.85 |
2.64 |
2.78 |
2.41 |
|
|
Small |
2.82 |
4.55 |
2.10 |
1.95 |
1.94 |
1.80 |
2.16 |
1.91 |
1.68 |
1.42 |
2.39 |
|
|
Receivables turnover rate |
Large |
1.94 |
2.06 |
1.46 |
1.44 |
1.80 |
1.73 |
1.59 |
1.53 |
1.81 |
1.61 |
1.17 |
|
Medium |
2.90 |
2.94 |
3.02 |
3.04 |
3.19 |
3.61 |
3.33 |
3.30 |
3.17 |
3.62 |
3.13 |
|
|
Small |
6.02 |
8.11 |
3.46 |
3.29 |
3.14 |
3.05 |
3.87 |
3.09 |
2.53 |
1.93 |
2.85 |
|
|
Profitability of core activities, % |
Large |
-5.4 |
-2.7 |
-11.0 |
-5.4 |
0.5 |
10.5 |
11.2 |
5.7 |
5.6 |
6.7 |
15.1 |
|
Medium |
4.0 |
6.9 |
5.6 |
7.6 |
8.7 |
5.0 |
6.7 |
7.0 |
9.7 |
8.1 |
8.7 |
|
|
Small |
7.1 |
7.5 |
6.3 |
4.4 |
5.3 |
5.1 |
6.7 |
7.7 |
8.4 |
7.3 |
9.3 |
|
|
Profitability of sales, % |
Large |
-5.7 |
-2.8 |
-12.3 |
-5.7 |
0.5 |
9.5 |
10.1 |
5.4 |
5.3 |
6.0 |
13.1 |
|
Medium |
3.9 |
6.5 |
5.3 |
7.0 |
8.0 |
4.8 |
6.3 |
6.5 |
8.8 |
7.5 |
8.0 |
|
|
Small |
6.6 |
7.0 |
6.0 |
4.3 |
5.0 |
4.9 |
6.3 |
7.1 |
7.8 |
6.8 |
8.5 |
|
|
Return on non-current assets, % |
Large |
-47.9 |
-26.8 |
-15.5 |
-19.8 |
-13.7 |
-4.6 |
1.5 |
-17.6 |
-17.3 |
10.2 |
36.7 |
|
Medium |
70.3 |
66.4 |
46.7 |
83.0 |
105.1 |
66.6 |
54.9 |
39.4 |
51.7 |
49.9 |
58.3 |
|
|
Small |
9.0 |
18.3 |
5.0 |
1.0 |
4.9 |
4.9 |
3.0 |
7.7 |
8.1 |
33.0 |
45.1 |
|
|
Profitability of current assets, % |
Large |
-28.3 |
-20.8 |
-13.8 |
-17.0 |
-10.6 |
-3.0 |
0.9 |
-7.6 |
-5.6 |
3.4 |
12.4 |
|
Medium |
3.2 |
3.3 |
3.8 |
6.2 |
8.3 |
5.6 |
7.0 |
6.6 |
9.8 |
9.7 |
8.7 |
|
|
Small |
5.6 |
11.7 |
4.1 |
0.7 |
3.0 |
2.9 |
1.8 |
4.1 |
4.4 |
5.2 |
6.8 |
The structure of their liabilities is dominated by the most urgent liabilities (51% of all liabilities), and this forms serious risks for their financial stability. The situation is complicated by the fact that the enterprises are not provided with their own working capital (see Tab. 5). The dynamics of financial independence, the ratio of borrowed and own funds shows that the enterprises have a high level of crediting, the volume of borrowed capital is 2.5 times higher than its own. For a long period of time the enterprises were on the verge of bankruptcy, had illiquid balance of assets, the volume of their non-current assets exceeded the available capital and reserves, and the most urgent and short-term liabilities were not secured by liquid assets. The financial situation of machinebuilding holdings in the region has slightly improved in 2022, this was facilitated by the reduction of accounts receivable from 23.9 to 5.1 billion rubles in 2022 as compared to 2021, shortterm liabilities – from 37.1 to 8.6 billion rubles, long-term liabilities – from 20.5 to 3.1 billion rubles, increase of turnover of current assets – from 0.8 to 1.4 times during the year (see Tab. 5), improvement of profitability of production activities – from 6.7 to 15.1%, sales – from 6 to 13.1%, utilization of non-current assets – from 10.2 to 36.7%. At present, they have financial stability, have liquid assets and, unlike medium and small enterprises, are characterized by high profitability, which indicates a low probability of their bankruptcy.
Medium-sized enterprises of the machinebuilding industry, with proceeds from the sale of products from 0.198 to 2.0 billion rubles per year, unlike large ones, throughout the period had the necessary amount of current assets, but their structure was dominated by hard-to-realize assets. This had a negative impact on their absolute and immediate liquidity, their available resources were insufficient to repay short-term liabilities and accounts payable. Like large enterprises, throughout the period under review they felt a serious dependence on borrowed capital. The level of working capital required for production activities was maintained through short-term lending. As a result, the accumulated level of short-term liabilities exceeded long-term liabilities by 9.4 times and formed a threat of solvency loss. At present these enterprises do not have a liquid balance sheet and can become solvent only in some perspective. Insufficient provision with inventories, functioning capital throughout the period contributed to the decline in their financial stability. Despite the low liquidity of assets, solvency problems, these enterprises are in a better financial position than large machine-building holdings, their working capital is actively turned over during the year. Thus, in 2022, the inventory turnover rate of medium-sized enterprises was 4.3 times higher than that of large enterprises, the turnover rate of accounts payable – 1.9 times, accounts receivable – 2.7 times, fixed assets – 5.2 times. Therefore, the probability of bankruptcy of medium-sized enterprises is lower.
Small enterprises of the industry with proceeds from the sale of products less than 0.198 billion rubles per year, as well as medium-sized enterprises, have sufficient working capital to maintain the continuity of production processes, but it is also formed at the expense of borrowed funds, i.e. the enterprises do not have financial independence. They are characterized by a low level of solvency and prospective liquidity of the balance sheet due to the insufficiency of quickly realizable assets to repay the most urgent obligations. The low level of resources turnover also worsens the financial position of small enterprises. Due to the high level of crediting, it is difficult for enterprises to attract borrowed capital for renewal of available stocks and fixed assets. Accounts payable and accounts receivable turnover rates are lower than those of mediumsized enterprises. All this significantly hinders the financial development of small machine-building enterprises in the Sverdlovsk Region and increases the probability of their bankruptcy.
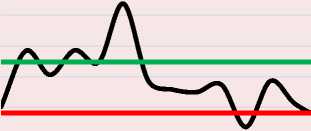
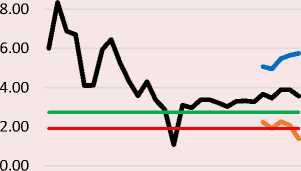
In the course of the study, we determine the threshold values for assessing the probability of bankruptcy of machine-building enterprises in the Sverdlovsk Region using geometric mean and standard deviations: below 1.91 – high level of bankruptcy probability (“red” zone), from 1.91 to 2.74 – average level (“gray” zone) and values above 2.74 – low level of bankruptcy probability of enterprises (“green” zone).
The calculation of the values of Altman statistics shows that at present the machinebuilding industry in the Sverdlovsk Region is characterized by a stable financial situation. After 2009, the indicators are in the “gray” zone, and this indicates a weak probability of bankruptcy of enterprises engaged in the production of machinery and equipment ( Fig. 2 ).
During the periods of increasing crisis phenomena in the economy (in 2012, 2014, 2020–2021), the values of Altman Z -statistics approached the
4.00
Figure 2. Dynamics of changes in the probability of bankruptcy of the machine-building industry in the Sverdlovsk Region as a whole and by type of enterprises
3.50
3.00
2.50
2.00
1.50


^^^мAverage value of Altman's Z-statistic for all enterprises
■■■■■ MBZ<1.91– red zone (high bankruptcy risk)
^^^^^»Z>2.74 – green zone (low bankruptcy risk)
3.00
12..0000 '^^J
0.00
large enterprises
medium-sized enterprises

small businesses
Source: own compilation.
“red” line, the financial situation of machinebuilding enterprises in the Sverdlovsk Region worsened, but no such crisis as in 2009 was observed. During the period of the coronavirus pandemic, the Altman curve came as close as possible to the “red” line, the probability of enterprises’ bankruptcy increased sharply, but thanks to the targeted government financial support of individual enterprises of the machine-building industry in the region managed to maintain financial stability. The increased sanctions pressure on the enterprises, the collapse of the established logistics chains for the supply of resources and finished products, the sharp rise in prices for raw materials and supplies, the difficulty of importing advanced production technologies and foreign-made equipment in 2022 form new risks of bankruptcy of machine- building enterprises in the region. The most vulnerable in this situation are large holdings, which are characterized by high capital intensity and dependence on imported equipment. Large enterprises have been fine-tuning the channels of supply of raw materials for years, and any change in logistics chains leads to serious disruptions in their production processes. The Altman curve for large machine-building enterprises in the region showed that they are the most sensitive to any negative manifestations in the economy (see Fig. 2). The economic recessions of 2008–2009, 2012, 2014, 2020–2021 were accompanied by an extremely high probability of bankruptcy of these enterprises. Large machine-building holdings of the region were in the “red” zone with high bankruptcy risks for a very long period and only in 2022 improved their
Table 6. Results of regression modeling of dependence of bankruptcy probability (Altman Z-statistic) of machine-building enterprises of the Sverdlovsk Region on external internal factors
|
Large |
Medium |
Small |
|
|
Regression coefficients |
|||
|
Const |
-8.07 (2.3)*** |
7.14 (2.19)*** |
3.02 (0.21)*** |
|
La – absolute liquidity |
2.28 (0.9)** |
||
|
Pc – working capital provision |
1.06 (0.4)*** |
||
|
Tfa – fixed assets turnover, times per year |
0.01 (0.005)* |
||
|
Ti – inventory turnover, times per year |
0.09 (0.03)*** |
||
|
Tar – accounts receivable turnover, times per year |
0.24 (0.09)** |
||
|
Роа – current assets profitability, % |
0.02 (0.01)** |
0.16 (0.04)*** |
|
|
Ln (Ifa) – logarithm of the volume of investment in fixed assets |
0.87 (0.2)*** |
||
|
Da – degree of depreciation of fixed assets in the region, % |
-0.09 (0.04)** |
||
|
Ln (It) – logarithm of the volume of imported technologies |
-0.16 (0.1)*** |
||
|
Parameters for assessing the quality and reliability of the models built |
|||
|
R -square |
0.79 |
0.83 |
0.52 |
|
F -Fisher statistics |
13.87*** |
23.24*** |
10.25*** |
|
The Durbin – Watson statistic |
1.88 |
2.52 |
1.87 |
|
P -value of the Breusch – Pagan test (H0: no heteroscedasticity) |
0.52 |
0.20 |
0.07 |
|
P -value of the test (H0: errors are normally distributed) |
0.25 |
0.18 |
0.91 |
|
P -value of the Chow test (H0: no structural changes) |
0.28 |
0.21 |
0.52 |
|
P -value of the Breusch – Godfrey test (H0: no autocorrelation) |
0.88 |
0.08 |
0.96 |
|
P -test value (H0: no ARCH processes) |
0.87 |
0.60 |
0.99 |
|
P -value of the Quandt test (H0: no structural changes) |
0.28 |
0.2 |
0.63 |
|
Note: * – statistical significance at the 10% level, ** – statistical significance at the 5% level, *** – statistical significance at the 1% level. The standard errors of the regression parameters present in parentheses. Source: own compilation. |
|||
financial position. The value of Altman Z-statistic moved to the zone of uncertainty, in which it is very difficult to predict the further dynamics of the change in the probability of bankruptcy without the use of regression analysis tools. Similar dynamics of change in the probability of bankruptcy was observed in the group of small enterprises in the machinebuilding industry. The financial and economic crisis of 2008 and its second wave in 2012 significantly affected the financial stability of enterprises, the values of Altman Z-statistics were in the “red” zone, which indicated a high probability of bankruptcy of enterprises. The economic recession of 2014– 2015 and the pandemic of coronavirus infection had a negative impact on the financial position of enterprises, but it was not so critical. At present, they, as well as large enterprises, are in the zone of uncertainty.
Medium-sized machine-building enterprises of the region are in the most stable financial position. The economic recessions that have been observed in the country during the last eight years have not had such a negative impact on them as on large and small enterprises. Medium-sized enterprises are provided with a sufficient amount of current assets to cover their liabilities, their resources are actively turned over during the year. That is why the values of Altman Z -statistics for this group of enterprises during the last eight years were in the “green” zone, and this indicates a low probability of their bankruptcy.
The data on the dynamics of the calculated Altman Z-statistics for large, medium and small enterprises of the machine-building industry in the Sverdlovsk Region for the period from 1999 to 2022 were used for regression analysis ( Tab. 6 ).
Time series were evaluated for stationarity using the Dickey – Fuller test, for multicollinearity by constructing pairwise correlation matrices and VIF analysis. When assessing the reliability of the model, we checked for the presence of autocorrelation of residuals, structural shifts in the dynamics of the key variable, heteroscedasticity in the model, and normality of error distribution.
As a result of regression modeling, we have found that the dynamics of the probability of bankruptcy of large machine-building holdings in the Sverdlovsk Region is influenced by the absolute liquidity of enterprises, provision of their own working capital, turnover of accounts receivable, profitability of working capital use, as well as the volume of investments in fixed assets attracted by the region’s enterprises (see Tab. 6). Large enterprises of the industry are poorly provided with working capital, funds are not quickly enough turned around and are inefficiently used. The enterprises are fund-intensive and attract significant investments in fixed capital for modernization of production. Negative dynamics of these factors form bankruptcy risks.
The study showed that the dynamics of the probability of bankruptcy of medium-sized enterprises are influenced by the turnover of fixed assets and inventories, the profitability of current assets and the degree of depreciation of fixed production assets. These enterprises are insufficiently provided with stocks and other most liquid assets to repay term liabilities and formed accounts payable, they experience serious problems with solvency, in the structure of their capital are dominated by borrowed funds, and only a high level of turnover of accounts receivable and accounts payable, fixed and current assets, stocks, efficiency of their use support financial stability. Negative dynamics of these indicators can significantly increase the bankruptcy risks of enterprises. According to the results of regression analysis, the probability of bankruptcy of small enterprises is influenced by the volume of imported technologies. These enterprises have insufficient resources to develop and implement their own advanced production technologies and are forced to import them. Significant growth in the cost of imported technologies in conditions of limited working capital forces enterprises to attract borrowed capital, and this negatively affects the level of their financial independence, solvency, and forms the bankruptcy risks.
We applied autoregressive modeling using moving average to forecast the dynamics of key factors concerning change in the probability of bankruptcy of enterprises. In the course of the study, we have determined that the optimal method of this analysis is ARMA-modeling due to the lack of linear trends in the dynamics of indicators. Table 7 presents an example of the formed models for one of the key factors promoting bankruptcy probability of large machine-building enterprises of the Sverdlovsk Region.
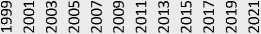
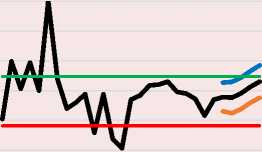
We used the 95% confidence interval to build forecast scenarios reflecting the dynamics of changes in the key factors regarding the probability of bankruptcy of enterprises, the lower and upper limits of this interval were used to form pessimistic and optimistic scenarios. The parameters of autoregressive models were used to develop the most probable, inertial forecast scenario of their change for the next five years, taking into account the preservation of the noted trends of the past. The forecasted values of the dynamics of these factors, as well as the constructed models formed the basis for the design of forecast scenarios of changes in the probability of bankruptcy of large, medium and small machine-building enterprises ( Fig. 3 ).
Table 7. ARMA-model of dynamics of profitability of current assets of large machine-building enterprises in the Sverdlovsk Region for the period from 1999 to 2022
|
Estimated using AS 197 (MLE) |
||||
|
Standard errors are calculated on the basis of the Hessian |
||||
|
Coefficient |
St. error |
z |
P -value |
|
|
const |
-5.58245 |
0.632170 |
-8.831 |
1.04e-018 *** |
|
phi _1 |
1.68253 |
0.0985203 |
17.08 |
2.16e-065 *** |
|
phi _2 |
-1.56825 |
0.187601 |
-8.360 |
6.30e-017 *** |
|
phi _3 |
1.68300 |
0.105349 |
15.98 |
1.90e-057 *** |
|
phi _4 |
-0.992345 |
0.0125970 |
-78.78 |
0.0000 *** |
|
theta _1 |
-1.72673 |
0.303976 |
-5.680 |
1.34e-08 *** |
|
theta _2 |
1.50863 |
0.513391 |
2.939 |
0.0033 *** |
|
theta _3 |
-1.72673 |
0.549006 |
-3.145 |
0.0017 *** |
|
theta _4 |
0.999998 |
0.320964 |
3.116 |
0.0018 *** |
|
Average of dependent variable |
-4.388445 |
Standard deviation of dependent variable |
9.352900 |
|
|
Average of innovations |
0.745540 |
Standard deviation of innovation |
3.970934 |
|
|
R -square |
0.843937 |
Corrected R-square |
0.775660 |
|
|
Log. plausibility |
-73.56009 |
Akaike criterion |
167.1202 |
|
|
Schwartz criterion |
178.9007 |
Hennan – Quinn criterion |
170.2456 |
|
|
Note: * – statistical significance at the 10% level, ** – statistical significance at the 5% level, *** – statistical significance at the 1% level. Source: own compilation. |
||||
3.50
3.00
2.50
2.00
1.50
1.00
0.50
0.00
Figure 3. Forecast scenarios of changes in the probability of bankruptcy of large, medium, and small machine-building enterprises in the Sverdlovsk Region up to 2027
Ti ^. ш co н rj ^ c m о OlOOOHHHtNNN aiooooooooo
4.00
3.50
3.00
2.50
2.00
1.50
Large enterprises
Small enterprises
Medium-sized enterprises
^^^^^M Inertial scenario
^^^^^ш Optimistic scenario
^^^^^ш Z>2.74 – Green zone (low bankruptcy risks)
■ шиммам Pessimistic scenario
^^^^^ш Z<1.91 – Red zone (high bankruptcy risks)
Source: own compilation.
The research shows that further reduction in the volume of imported new technologies (up to 10 million rubles per year) will positively affect the probability of bankruptcy of small machinebuilding enterprises. The cessation of parallel import of technologies, equipment and transition to the introduction of domestic developments will contribute to the improvement of their financial stability and elimination of the technological risk of bankruptcy. If the optimistic scenario is realized, the Altman statistics will reach the green zone by 2027. The growth in the volume of imported technologies will increase the probability of bankruptcy of enterprises, but it will not reach critical values, the Altman curve will remain in the “gray” zone of uncertainty. Moreover, the realization of the pessimistic scenario is unlikely due to the sanctions pressure and the impossibility of legal import of technologies. Preservation of the trends noted over the last decade and achievement by 2027 of the level of inventory turnover (3.4 times per year), fixed production assets (65.3 times per year) and return on current assets (8.6%) will contribute to a further reduction in the probability of bankruptcy of medium-sized enterprises, the values of which are already in the “green” zone. The increasing level of depreciation of fixed production assets, inflation growth, reduction of inventory turnover, fixed assets, business activity of enterprises, profitability of current assets at higher rates will contribute to the realization of the pessimistic scenario and will lead to a significant increase in the probability of bankruptcy of these enterprises. Altman Z-statistic will be in the “red” zone, reaching the value of 1.4.
Large machine-building holdings in the Sverdlovsk Region are most exposed to bankruptcy risks. These enterprises have been in the risk zone since 2012 due to the lack of own working capital and poor efficiency of its use, low level of solvency and insufficient level of receivables turnover. Further preservation of the negative dynamics of these factors will contribute to the realization of the inertia scenario, in which by 2027 there is a high probability of bankruptcy of this group of enterprises. In case of a more significant decrease in the solvency of enterprises (up to 0.1), turnover of accounts receivable (up to 0.7), provision of enterprises with working capital (up to 0.01), profitability of their use (to a negative value of 13.5%), a more pessimistic scenario is possible: the Altman curve will reach the value of 0.14, exceeding the level observed in 2009. The bankruptcy risks of machine-building holdings are also increased by the declining dynamics of investment in fixed assets since 2012. Large holdings are dependent on the state of fixed assets and, in order to ensure the continuity of production processes, are forced to attract borrowed resources for their modernization. A significant reduction in investments in fixed assets (by 9.6%) by 2027 will be one of the triggers for the realization of the pessimistic scenario in the dynamics of the probability of bankruptcy of machine-building holdings. Under the conditions of limited current assets and low turnover of accounts receivable, it will be difficult for enterprises to find resources to restore the production equipment that has failed.
Scenario forecasting of bankruptcy risks has shown that the machine-building industry of the Sverdlovsk Region is currently in a stable financial position. The most exposed to bankruptcy risks are large machine-building holdings. To improve their financial stability, the state support is required today, since the machine-building industry is the key industry in the region, and the dynamics of development of related industries depends on its financial position.
Conclusion
The study developed a methodological approach to the scenario modeling and forecasting of bankruptcy risks of enterprises in industries, the novelty of which is the accounting of data from primary accounting and annual reports of enterprises operating in the regional system according to their industry affiliation, as well as the systematic use of regression and autoregressive modeling methods. This approach allows us to more accurately and objectively assess the threats of loss of financial solvency of enterprises of various industries in the region.
As a result of the study, we found that the machine-building industry in the Sverdlovsk Region is currently in a stable financial situation. Large machine-building holdings of the region are exposed to bankruptcy risks, which are insufficiently provided with working capital, are characterized by a low level of solvency and have a significant debt load. Medium-sized machine-building enterprises of the region are in the most stable financial position. They have a sufficient amount of current assets to cover short-term and long-term liabilities, their resources are actively turned over during the year. Decreasing profitability of current assets utilization, turnover of fixed assets and inventories, as well as increasing degree of depreciation of fixed production assets form the risks of bankruptcy of these enterprises. The sustainable financial position of small enterprises is influenced by the volume of imported technologies and technical services. Due to their size, small companies do not have sufficient resources to develop and implement their own advanced production technologies and are forced to import them from other countries. Restricting the import of foreign technologies and switching to the implementation of Russian developments will contribute to improving their financial stability and eliminating the technological bankruptcy risk.
The developed approach to assessing and forecasting the probability of bankruptcy of enterprises is supposed to be further tested in other industries of the region in order to assess the socio-economic consequences of their possible bankruptcy and to identify the sectoral priorities of state financial support.
References Scenario-based approach to modeling bankruptcy risks for enterprises in various industries
- Adamowicz K., Noga T. (2018) Identification of financial ratios applicable in the construction of a prediction model for bankruptcy of wood industry enterprises. Folia Forestalia Polonica, Series A, 60(1), 61–72.
- Alifiah M.N. (2014). Prediction of financial distress companies in the trading and services sector in Malaysia using macroeconomic variables. Procedia – Social and Behavioral Sciences, 129, 90–98.
- Altman E. (1968). Financial ratios, discriminant analysis and the prediction of corporate bankruptcy. Journal of Finance, 23(4), 589–609.
- Bat’kovskii A.M., Bulava I.V., Mingaliev K.N., Fomina A.V. (2016). Forecasting the risk of financial insolvency of defense industry companies. Voprosy radioelektroniki, 6(5), 108–120 (in Russian).
- Beaver W. (1966). Financial ratios as predictors of failure. Empirical research in accounting selected studies. Journal of Accounting Research (Suppl.), 4, 71–111.
- Bogdanova T.K., Alekseeva Yu.A. (2011). Forecasting the probability of bankruptcy of enterprises taking into account changes in financial indicators in dynamics. Biznes-informatika, 1(15), 50–60 (in Russian).
- Conan J., Holder М. (1979). Explicative Variables of Performance and Management Control: Doctoral Thesis. Paris: CERG, Universite Paris Dauphine.
- Cultrera L., Brédart X. (2016). Bankruptcy prediction: The case of Belgian SMEs. Review of Accounting and Finance, 15(1), 101–119.
- Evstropov M.V. (2008). Assessment of possibilities for forecasting bankruptcy of enterprises in Russia. Vestnik OGU, 85, 25–32 (in Russian).
- Fedorova E.A., Khrustova L.E., Chekrizov D.V. (2018). Industry characteristic of bankruptcy prediction models appliance. Strategicheskie resheniya i risk-menedzhment=Strategic Decisions and Risk Management, 1(106), 64–71 (in Russian).
- Fedorova E.A., Lazarev M.P., Fedin A.V. (2016). Forecasting the entity’s bankruptcy in line with the operating environment factors. Finansovaya analitika: problemy i resheniya=Financial Analysis: Science and Experience, 42, 2–12 (in Russian).
- Fedorova E.A., Timofeev Ya.V. (2015). Developing the bankruptcy prediction models for Russian businesses of the construction and agriculture industries. Finansy i kredit=Finance and Credit, 32(656), 2–10 (in Russian).
- Fulmer J., Moon J., Gavin T., Erwin M. (1984). A bankruptcy classification model for small firms. Journal of Commercial Bank Lending, July, 25–37.
- Ismailova P.A., Evdokimov S.Yu., Golovetskii N.Ya. (2019). Assessment of financial instability using tools for forecasting financial insolvency (bankruptcy) of enterprises in the regional market. Vestnik Evraziiskoi nauki=The Eurasian Scientific Journal, 6, 1–12 (in Russian).
- Ivanova E.V., Efremkova T.I. (2020). Methodological prerequisites for the development of the bankruptcy forecasting model. Vestnik Altaiskoi akademii znanii, 4, 336–343 (in Russian).
- Kaczmarek J., Alonso S.L.N., Sokołowski A., Fijorek K., Denkowska S. (2021). Financial threat profiles of industrial enterprises in Poland. Oeconomia Copernicana, 12(2), 463–487.
- Kangari R. (1988). Business failure in construction industry. Journal of Construction Engineering and Management, 114(2), 172–190. DOI: 10.1061/(ASCE)0733-9364(1988)114:2(172)
- Karas М., Reznakova M. (2015). Predicting bankruptcy under alternative conditions: The effect of a change in industry and time period on the accuracy of the model. Procedia – Social and Behavioral Sciences, 213, 397–403. DOI: 10.1016/j.sbspro.2015.11.557
- Kazakova N.A., Leshchinskaya A.F., Sivkova A.E. (2018). Assessment and forecasting bankruptcy risk of mining companies. Ekonomika v promyshlennosti=Russian Journal of Industrial Economics, 11(3), 261–272. DOI: 10.17073/2072-1633-2018-3-261-272 (in Russian).
- Kloster B.T., Jacobsen H.D. (2005). What influences the number of bankruptcies? Economic Bulletin, 76(4), 191–211.
- Legault J. (1987). C.A. – Score, a warning system for small business failures. Bilanas, June, 29–31.
- Lyutova E.S. (2011). Economic and mathematical modeling of bankruptcy forecasting of metallurgical enterprises. Problemy ekonomiki i yuridicheskoi praktiki, 2, 362–365 (in Russian).
- Mogilat A.N. (2019). Modelling financial distress of Russian industrial companies, or what bankruptcy analysis can tell. Voprosy ekonomiki, 3, 101–118 (in Russian).
- Ohlson J.A. (1980). Financial ratios and the probabilistic prediction of bankruptcy. Journal of Accounting Research, 18, 109–131.
- Pechenskaya-Polishchuk M.A., Malyshev M.K. (2021). Metallurgical corporations and the state: Trends in financial interaction of the last decade. Ekonomicheskie i sotsial’nye peremeny: fakty, tendentsii, prognoz=Economic and Social Changes: Facts, Trends, Forecast, 14(3), 150–166. DOI: 10.15838/esc.2021.3.75.9 (in Russian).
- Petersen C., Plenborg T. (2012). Financial Statement Analysis: Valuation, Credit Analysis and Executive Compensation. Pearson Education Limited.
- Qin Z., Chen Y. (2010). The bankruptcy prediction study under the financial crisis: The case of Chinese export-oriented enterprises. In: Proceedings – 2010 2nd IEEE International Conference on Information and Financial Engineering, ICIFE, 301–306, 56093072010.
- Shatkovskaya E.G., Faizulloev A.Kh. (2016). Bankruptcy of organization, its concept and methods of forecasting. Fundamental’nye issledovaniya=Fundamental Research, 5, 433–440 (in Russian).
- Shirinkina E.V. (2015). Forecasting the risk of enterprise insolvency under conditions of uncertainty. Vestnik Permskogo universiteta. Ser. “Ekonomika”, 3(26), 137–144 (in Russian).
- Taffler R.J., Tisshaw H.J. (1977). Going, going, gone – four factors which predict... Accountancy, 88, 50–54.
- Wadhwani S.B. (1986). Inflation, bankruptcy default premia and the stock market. The Economic Journal, 96(381), 120–138.
- Zaitseva O.P. (1998). Anti-crisis management in a Russian firm. Aval’ (Sibirskaya finansovaya shkola), 11–12 (in Russian).
- Zmijewski M.E. (1984). Methodological issues related to the estimation of financial distress prediction models. Journal of Accounting Research, 22, 59–82.
