Scenario modeling and forecasting of the spatial heterogeneity of innovation development in Russia

Author: Naumov I.V., Nikulina N.L.
Journal: Economic and Social Changes: Facts, Trends, Forecast @volnc-esc-en
Section: Science, technology and innovation development
Article in issue: 4 т.16, 2023.
Free access
Uneven spatial innovation development of Russia is due to many factors such as GRP volume, fiscal capacity of territories, fixed capital investments attracted by enterprises. However, the key factors determining the concentration of innovation industries in territorial systems of various levels are enterprises’ expenditure on innovation activity and the available scientific personnel potential. The increasing spatial heterogeneity of localization and concentration of these resources, according to our research hypothesis, enhances the spatial heterogeneity of innovation development in Russia. To confirm this hypothesis, we aim to assess the spatial heterogeneity of enterprises’ innovation development at the national level and carry out scenario modeling and forecasting of the dynamics of this heterogeneity until 2025. The paper presents a methodological approach to scenario forecasting of the spatial heterogeneity of innovation development of Russia. In the framework of the approach, the heterogeneity is assessed using spatial autocorrelation analysis according to P. Moran’s method, regression analysis of the dependence of the volume of shipped innovation goods and services performed on the costs of innovation activities carried out by enterprises, and the number of research personnel in the regions, as well as autoregressive analysis of the dynamics of their changes using a moving average (ARIMA modeling) to form the most likely forecast scenarios of innovation development for different groups of regions. The novelty of the approach lies in the system-wide use of spatial autocorrelation analysis methods based on various spatial weight matrices, regression analysis methods based on panel data and ARIMA modeling, which in combination with each other make it possible to determine the degree of influence of the factors on the heterogeneity of innovation development in regions and to form a system of various forecast scenarios. The results of the study will serve as the basis for the formation of Russia’s innovation framework. The constructed forecast scenarios will help to form strategies for innovation development in Russian regions, taking into account the identified features of the spatial localization of factors that have a significant impact on innovation development.
Spatial heterogeneity, russia’s regions, innovation development, expenditure on innovation activity, cobb, douglas function, regression modeling, spatial autocorrelation, arima modeling
Short address: https://sciup.org/147241625
IDR: 147241625 | UDC: 332.14+330.43 | DOI: 10.15838/esc.2023.4.88.4
Text of the scientific article Scenario modeling and forecasting of the spatial heterogeneity of innovation development in Russia
Currently innovation development of enterprises is an important factor promoting sustainable, progressive socio-economic development of territorial systems at various levels. The introduction of technical, technological, organizational, economic, social and other innovations in various spheres of life and their active implementation in the form of innovation products open up new technological opportunities for the development of enterprises and growth of their competitiveness and also shape the progress-based image of territories. A significant number of research works deal with innovation issues and investigate trends in innovation development of territories, factors contributing to such development, and mechanisms that help to increase innovation activity. Some of the works include those by A.G. Granberg, S.D. Valentey (Granberg, Valentey, 2006), N.I. Komkov (Komkov, 2017), I.M. Golova, A.F. Sukhovey (Golova, Sukhovey, 2017), O.A. Donichev, D.Yu. Fraimovich, S.A. Grachev (Donichev et al., 2018), A.A. Kisurkin (Kisurkin, 2012), P.A. Degtyarev (Degtyarev, 2020),
S.N. Mityakov, O.I. Mityakova, N.A. Murashova (Mityakov et al., 2017) and others. However, little attention is given to spatial aspects related to the implementation of innovation activities by enterprises. The current polarization of innovation development is largely due to the spatial features regarding the concentration of scientific potential and financial resources. Thus, an urgent task is to assess and predict the dynamics of changes in the spatial heterogeneity of the placement of these factors in order to develop mechanisms for smoothing it.
We test a hypothesis according to which the increasing spatial heterogeneity in the localization and concentration of research personnel and enterprises’ expenditures on the implementation of innovation activities enhances the spatial heterogeneity of innovation development in Russia. Thus, the aim of the work is to conduct an assessment, scenario modeling and forecasting of spatial heterogeneity of innovation development of enterprises in Russia until 2025. To achieve the goal, we set the following tasks: theoretical review of assessment methods, scenario modeling and forecasting of spatial heterogeneity of innovation development of territories and the formation of a system-wide approach that takes into account the advantages and disadvantages of these methods; assessment of spatial heterogeneity of Russia’s innovation development; search for the main centers (growth poles), regions that are similar in the level of their innovation development that can unite in spatial clusters, as well as the zones of their influence; formation of the Cobb – Douglas regression model using panel data on Russian regions to assess the effectiveness of innovation industries in territorial systems, the impact of enterprises’ expenses on innovation activities and research personnel in the region on the volume of shipped innovative goods; ARIMA modeling of the dynamics of these factors in order to form the most likely forecast scenarios for innovation development of regions until 2025: an inertial scenario, taking into account the observed trends, an optimistic and a pessimistic scenario. Solving these research tasks will make it possible to forecast the dynamics of spatial heterogeneity of innovation development of Russian regions, and the constructed models will help to develop mechanisms for smoothing it.
Theoretical and methodological approaches to the assessment and forecasting of spatial heterogeneity in the innovation development of a territory
Spatial heterogeneity of innovation development is investigated with the use of various assessment methods, statistical analysis being the most common of them. Researchers use various techniques and methods to assess spatial aspects of innovation development of Russian regions: A.V. Krivchanskaya (Krivchanskaya, 2017), M.S. Gusarova (Gusarova, 2021), M.A. Dugarzhapova and E.A. Zhalsaraeva (Dugarzhapova, Zhalsaraeva, 2020), O.S. Moskvina (Moskvina, 2019), V.N. Makoveev (Moskvina, Makoveev, 2019) use statistical indices; E.F. Nikit-skaya (Nikitskaya, 2020) uses indicators of density, structure, concentration, convergence and connectivity; V.V. Filatov (Filatov, 2014) uses commission methods, the Delphi method, morphological analysis and extrapolation; O.P. Smirnova, A.O. Ponomareva (Smirnova, Ponomareva, 2020) use methods of correlation analysis, standardization and aggregation of indicators; E.A. Polina and I.A. Solovyeva (Polina, Solovyeva, 2019) use multidimensional factor analysis methods. These methods of studying spatial heterogeneity are more often used by researchers at the initial stage of its assessment, for grouping territories according to enterprises’ innovation development indicators. They do not allow us to simulate the influence of factors on innovation development of territorial systems and form predictive scenarios for the deployment of innovation processes in the future.
Spatial heterogeneity of innovation development of territorial systems was also assessed with the help of spatial clustering methods. Thus, A.L. Myachin, for example, used methods of analyzing clustering patterns (Myachin, 2020). The use of clustering methods allowed F.A. Blanco, F.J. Delgado, M.J. Presno to establish the convergence of the European Union countries in terms of spending on science and substantiate “the need to revise the EU policy in the field of research and development in the direction of greater coordination of resource use, as well as the introduction of new tools” (Blanco et al., 2020). Spatial clustering methods were also used by A.S. Mikhailov, V.V. Gorochnaya, D.V. Khvaley, I.S. Gumenyuk according to several criteria. The statistical assessment was “supplemented by an analysis of the spatial concentration of innovation potential taking into account the agglomeration factor” (Mikhailov et al., 2020).
I.P. Kilina used intraregional and spatial innovation parameters (density and homogeneity indices) to cluster regions according to the level of innovation development. On the basis of the indices and with the use of gravity indicators, the author formed an innovation profile of regions, which made it possible to arrange RF constituent entities into typological groups, identify their specifics, and reveal directions of interregional cooperation in the innovation sphere1. To assess the spatial heterogeneity of innovation development, I.V. Naumov and A.Z. Barybina used “spatial autocorrelation analysis according to the method of P. Moran and L. Anselin using various spatial weight matrices to search for innovation growth poles, interregional spatial clusters, zones of their influence” (Naumov, Barybina, 2020).
In comparison with statistical methods, cluster analysis methods are more suitable for assessing the spatial heterogeneity of innovation development of territorial systems; they help to objectively form clusters of similar territorial systems. At the same time, unlike statistical methods, cluster analysis methods focus primarily on spatial aspects when identifying clusters and include closely located territories in clusters. At the same time, both statistical research methods and clustering methods do not allow modeling and forecasting changes in the spatial heterogeneity of innovation development in the future, but form only the basis for it. Thus, when assessing and modeling the heterogeneity of the distribution of green innovations in 30 provinces of China from 2009 to 2019 P. Liu, L. Zhang, H. Tarbert, and Z. Yan used spatial-temporal characteristics of these innovations and the factors affecting the effectiveness of their implementation (Liu et al., 2021). A similar study was conducted by K.-L. Wang and F.-Q. Zhang (Wang, Zhang, 2021). The authors used a global measurement model based on Moran’s spatial autocorrelation indices and a vector autoregression (VAR) model. Using the spatial econometric model, X. Yong Gang assessed the characteristics of convergence and variations of regional innovations, studied the influence of space-related factors on the convergence of regional innovations (Yong Gang, 2023). Using regression analysis methods and indices of regional spatial structure, innovation efficiency and innovation gap index, Z. Ye, C. Zou, and Y. Huang investigated the impact of various types of spatial structures on the introduction of scientific and technological innovations in 26 provinces and autonomous regions of China from 2005 to 2019 (Ye et al., 2022). K. Wu, Y. Wang, H. Zhang, Y. Liu, Y. Ye studied the spatial heterogeneity of regional innovation development in China’s Pearl River Delta by combining negative binomial regression and Geodetector (Wu et al., 2021). To model the spatial heterogeneity of innovation development in 67 European countries M.A.M. Antunes used a quantile regression model with a discrete dependent variable (Antunes, 2016).
Regression analysis aimed at searching for factors influencing innovation development of productive forces in Russia’s regions was used by O.S. Mariev, E.D. Ignatieva, E.P. Naberezhneva and I.V. Savin. The modified Cobb – Douglas “knowledge generation function” they constructed (Mariev et al., 2012) may well be used to design forecasting scenarios for the dynamics of regions’ innovation development. L.V. Marabaeva, O.A. Sokolov, I.A. Gorin, and A.E. Kovalev formed forecasting scenarios for the development of territorial innovation clusters in Russia using ARIMA model (Marabaeva et al., 2020).
A theoretical review of the works that apply regression analysis showed a wide variety of tools used to model the factors promoting innovation development of territorial systems. At the same time, scientific literature does not contain sufficient results of modeling and forecasting the spatial features of innovation development and the spatial heterogeneity of the placement of innovation industries; only a small part of the models formed was used to build a system of forecasting scenarios for innovation development. Scenario modeling and forecasting spatial heterogeneity of innovation development of territorial systems is a complex and multi-stage process requiring the solution of several tasks: assessing spatial heterogeneity of development of innovation processes and clustering territories on this basis; assessing production factors for innovation products in different territorial systems using regression analysis; making multivariate forecasts of changes in the dynamics of factors influencing innovation development of territorial systems; building on their basis a system of forecast scenarios of innovation development of territories; assessing the forecast level of concentration of innovation industries in different groups of territorial systems. Accordingly, the solution of the tasks requires comprehensive use of various modeling and forecasting methods.
Methodological approach to scenario modeling and forecasting spatial heterogeneity of innovation development of a territory
At the stage of assessing the spatial heterogeneity of innovation development of territories and their clustering we propose to use statistical research methods. They will help to identify the following groups of regions by the volume of shipped innovation goods: regions with a high value exceeding the standard deviation from the average, regions with an indicator value close to the average level and slightly exceeding it, and regions with a volume of shipped goods below the average level. Assessing the concentration of shipped innovation goods in each region and by groups of regions will help to establish the presence of spatial heterogeneity of innovation development. To confirm this heterogeneity and carry out spatial clustering, it is assumed to use spatial autocorrelation analysis according to P. Moran’s method with the generalization of the results for various spatial weight matrices between regions (by highways and linear distances, adjacent borders, by railway, as well as their normalized versions). The calculated global and local spatial autocorrelation indices in terms of the volume of innovation goods shipped will allow us to establish the formed and emerging growth poles, spatial clusters of regions similar in terms of innovation development, zones of their influence, as well as direct and inverse interterritorial relationships.
At the next stage of the study, regression modeling is supposed to be carried out within the selected groups of regions; the purpose of the modeling is to assess the degree of influence of the main factors of production (enterprises’ innovation activities costs and the entire set of research personnel in the region) on the volume of innovation goods shipped in the regions. Since in this study we consider it important to assess the degree of influence of factors on the spatial heterogeneity of the dynamics of the volume of innovation goods shipped, we will use the classical Cobb – Douglas production function. In order to obtain more correct results in the conditions of spatial heterogeneity of data on innovation development of enterprises, it is assumed to form a quantile regression (1) assessing the degree of influence of these factors in three groups of regions:
QAVt i^ t ) = A(t) + Р г№и + P 2 (T)C it + ц , (1)
where Q t ( V .t |X . t) — т -th conditional quantile Vit of the given X .t ;
-
V .t — volume of shipped innovation goods in the region, million rubles;
X - factors L .t , C;
-
L.t — number of personnel engaged in scientific research in the region, people;
в 1 ( т ) — coefficient of elasticity in terms of the number of personnel;
Cit — costs of innovation activities of organizations in the region, million rubles;
в 2 ( т ) — coefficient of elasticity in terms of innovation costs;
A( t ) — technological coefficient, a combination of other factors;
e i — regression error.
The constructed models for the three quantiles will not only become the basis for scenario forecasting spatial heterogeneity of regions’ innovation development, but will also allow us to establish emerging effects from the scale of production activities of innovation enterprises in different groups of regions, to assess the effectiveness of their organization. To confirm the different degree of influence of these factors on the volume of shipped innovative goods in different groups of regions, it is planned to build Cobb – Douglas regression models for each region for the same period under consideration (2010–2020). To assess the contribution of the factors to the formation of spatial heterogeneity of innovation development, at the next stage, it is planned to conduct a spatial autocorrelation analysis of the features of their distribution according to P. Moran’s method, during which growth poles, spatial clusters and zones of their influence will be determined by the financial resources attracted by enterprises for innovation and the number of research personnel.
In order to form forecast scenarios for changes in the volume of shipped innovative goods in three groups of regions, at the next stage of the study, it is planned to conduct an autoregressive analysis of the dynamics of changes in the enterprises’ innovation activities costs and the number of research personnel in all regions of Russia for the period from 2010 to 2020 using a moving average (ARMA/ARIMA). This method will allow us to determine the most probable – inertial scenario of the dynamics of these factors until 2025, taking into account the preservation of the trends noted during the period under consideration, as well as to identify extremely possible (pessimistic and optimistic) scenarios for changing their dynamics in the future. The obtained forecast values of changes in the dynamics of these factors will be substituted into the equations of the quantile regression model of three groups of regions (1) to form inertial forecast scenarios and extremely possible forecast scenarios for the dynamics of the volume of shipped innovative goods. The regression models presented in this paper can also be used to form a whole system of various scenarios due to a combination of predictive values of the factors.
Thus, the methodological approach to the scenario forecasting of spatial heterogeneity of innovation development in Russia that is presented in the article is based on the system-wide use of various research methods: standard deviation methods and spatial autocorrelation analysis for clustering regions by volume of enterprises’ innovation activity, regression modeling methods to assess the dependence of the volume of shipped innovative goods on the level of enterprises’ innovation activities costs, and the number of research personnel in the regions, as well as the degree of influence of these factors in different groups of regions, methods of autoregressive analysis of the dynamics of their changes to form the most likely and extremely possible forecast scenarios of changes in the dynamics of these factors in the future, corresponding to scenarios of changes in the dynamics of innovative goods shipped by enterprises and their concentration in certain regions.
Research results
Considering the country’s innovation development in the regional context, we can note the strong spatial heterogeneity of enterprises’ innovation activity. Currently, 54% of all innovative goods shipped in Russia are concentrated in eight regions: Moscow, Saint Petersburg, the Republic of Tatarstan, Perm Krai, the Moscow, Nizhny Novgorod, Sverdlovsk, and Tyumen oblasts ( Tab. 1 ).
A significant increase in the concentration of innovative goods was observed in the city of Moscow and in the Tyumen Oblast. The second group of regions with the volume of shipped innovative goods above the average in Russia according to 2020 included: the Belgorod, Samara, Omsk, Tula, Murmansk, Rostov and Chelyabinsk oblasts, the republics of Bashkortostan, Udmurtia and Mordovia, and Krasnoyarsk and Khabarovsk krais. In 2020, 26.8% of all innovative goods and services were shipped in 12 regions of this group. A significant increase in the concentration of innovative goods was observed in Krasnoyarsk and Khabarovsk krais, in the Omsk, Tula, Murmansk and Belgorod oblasts; and a decrease was observed in the Samara Oblast. The regions of the third group, with the volume of shipped innovative goods and services below the average in Russia, which
Table 1. Dynamics of the volume of shipped innovative goods and the level of their concentration in the regions of Russia in 2010 and 2020
|
Region |
2010 |
2020 |
|||
|
Million rub. |
% |
Million rub. |
% |
||
|
Major centers of innovation development |
Moscow |
64 543 |
5.1 |
626 603 |
12.0 |
|
Republic of Tatarstan |
161 216 |
12.8 |
528 840 |
10.2 |
|
|
Saint Petersburg |
84 474 |
6.7 |
448 025 |
8.6 |
|
|
Moscow Oblast |
90 231 |
7.2 |
380 965 |
7.3 |
|
|
Nizhny Novgorod Oblast |
76 468 |
6.1 |
276 160 |
5.3 |
|
|
Perm Oblast |
65 317 |
5.2 |
190 630 |
3.7 |
|
|
Sverdlovsk Oblast |
59 748 |
4.8 |
185 485 |
3.6 |
|
|
Tyumen Oblast |
2 789 |
0.2 |
175 458 |
3.4 |
|
|
Regions with the volume of shipped innovative goods above the Russian average |
Belgorod Oblast |
9 392 |
0.7 |
158 024 |
3.0 |
|
Samara Oblast |
96 237 |
7.7 |
157 163 |
3.0 |
|
|
Republic of Bashkortostan |
44 702 |
3.6 |
150 638 |
2.9 |
|
|
Krasnoyarsk Krai |
4 957 |
0.4 |
135 373 |
2.6 |
|
|
Omsk Oblast |
9 783 |
0.8 |
132 406 |
2.5 |
|
|
Tula Oblast |
8 396 |
0.7 |
131 270 |
2.5 |
|
|
Murmansk Oblast |
792 |
0.1 |
112 798 |
2.2 |
|
|
Khabarovsk Krai |
4 557 |
0.4 |
109 696 |
2.1 |
|
|
Rostov Oblast |
19 185 |
1.5 |
106 740 |
2.0 |
|
|
Chelyabinsk Oblast |
19 352 |
1.5 |
78 108 |
1.5 |
|
|
Udmurt Republic |
8 768 |
0.7 |
63 741 |
1.2 |
|
|
Republic of Mordovia |
20 996 |
1.7 |
61 536 |
1.2 |
|
|
Regions with the volume of shipped innovative goods below the Russian average |
403 182 |
32.1 |
997 859 |
19.2 |
|
|
Source: Federal State Statistics Service. |
|||||
included 65 constituent entities of the Russian Federation, accounted for only 19.2% in 2020, while in 2010 – 32.1%. Thus, at present there is an increase in the spatial heterogeneity of innovation development, their significant concentration of innovative goods and services in the regions of the first and second groups. Spatial autocorrelation analysis according to P. Moran’s methodology was also used to assess the degree of spatial heterogeneity of Russia’s innovation development and clustering of regions in terms of the volume of goods shipped. Positive values of the global Moran index for all spatial weight matrices and Z-scores have shown that in Russia there are regions similar in terms of innovation development, which, with the active development of interregional relationships, can form spatial clusters. The results of spatial autocorrelation analysis, reflected in the Moran scatter plots for eight spatial weight matrices, were summarized and systematized in Table 2 .
This analysis was also carried out in order to confirm the results of the performed grouping of regions by volume of innovative goods shipped. The spatial cluster of innovation development with a high level of spatial interaction is formed by the city of Moscow, the Moscow Oblast, and the Sverdlovsk Oblast. These regions have an extremely high volume of shipped innovative goods and are included in the first group of regions. The regions that are growth poles, according to the majority of spatial weight matrices, include Saint Petersburg, and the emerging poles of growth are Krasnoyarsk and Khabarovsk krais and the Rostov Oblast, which differ significantly from the surrounding regions in terms of the volume of goods shipped. The formed growth pole, according to the grouping presented in Table 1, also belongs to the first group of regions, and the emerging growth poles with a low level of spatial interaction belong to the second group of regions with the volume of goods shipped slightly
Table 2. Generalized P. Moran’s scatter plot by volume of shipped innovative goods in Russia in 2020
|
LH – Influence zones |
HH – Spatial clusters |
||
|
High level of mutual spatial influence |
Low level of mutual spatial influence |
High level of mutual spatial influence |
Low level of mutual spatial influence |
|
Kurgan, Ryazan, Vladimir, Tver, Kostroma, Kaluga, Ivanovo, Oryol, Smolensk, Tambov oblasts |
Voronezh, Bryansk, Kursk, Lipetsk, Yaroslavl, Volgograd oblasts; Khanty-Mansi Autonomous Okrug, Yamalo-Nenets Autonomous Okrug |
City of Moscow; Moscow and Sverdlovsk oblasts |
Nizhny Novgorod, Samara, Murmansk, Omsk, Tyumen, Chelyabinsk, Belgorod, Tula oblasts; Perm Krai; republics of Bashkortostan, Mordovia, Tatarstan, and Udmurtia |
|
LL |
HL – Regions that are growth poles |
||
|
Other regions of Russia |
Saint Petersburg |
Krasnoyarsk and Khabarovsk krais; Rostov Oblast |
|
|
Source: own elaboration. |
|||
above the national average. The emerging spatial clusters of similar regions, which do not have such a high level of spatial interaction as those already formed, were included in the first (the Republic of Tatarstan, Perm Krai, the Nizhny Novgorod and Tyumen oblasts) and the second (the republics of Bashkortostan, Mordovia, Udmurtia; the Murmansk, Belgorod, Tula, Samara, Omsk and Chelyabinsk oblasts) group of regions. The zone of influence of spatial clusters included mainly regions of the Central and Ural federal districts (see Tab. 2). Most of the regions of the Far Eastern, Siberian, Northwestern, North Caucasian and Southern federal districts have not become growth poles or spatial clusters and have not entered the zone of their influence. These regions form the third group of territories with the volume of shipped innovative goods below the Russian average. The presence of 65 constituent entities of the Russian Federation in this group indicates an extremely high spatial heterogeneity of Russia’s innovation development.
The Cobb – Douglas quantile regression model was used to forecast the dynamics of change in the heterogeneity and assess the degree of influence of production factors. Panel data on 85 Russia’s constituent entities for the period from 2010 to 2020 (935 observations) were used to form the model. Before its construction, the descriptive statistics of variables were analyzed and the stationarity of time series was estimated using the augmented Dickey – Fuller test (ADF test). According to the results of the analysis of the calculated descriptive statistics, a high level of data variation was established, which confirms the spatial heterogeneity of the regions’ innovation development. To obtain more reliable estimates, the data were reduced to a comparable form by extracting the natural logarithm. The results of the constructed model for three groups of regions are presented in Table 3.
Regression coefficients for all quantiles of this model were tested using the Wald test, the normality of the error distribution was checked using the Jarque – Bera test, and the stability of the model parameters was tested using the Ramsey technique. Regression coefficients in this model are statistically significant with the exception of the third quantile for the “number of personnel engaged in scientific research” variable. The constructed quantile regression model shows that in the group of regions with a high volume of shipped innovative goods, the main factor is enterprises’ innovation activities costs. The personnel scientific potential formed in the second group of regions according to the results of modeling is a secondary factor that does not have a significant impact on innovation development in these regions. This factor influenced the innovation development of the regions of the second group, which differ in the volume of shipped innovative goods above the Russian average. According to this model, an increase in the number of research personnel in the regions included in the second quantile by 1% contributes to an increase in the volume of innovative goods sold by 0.16%. In this group of regions, there was also a more significant impact on innovation
Table 3. Parameters of the quantile regression model of the dependence of the volume of shipped innovative goods (V) on the volume of enterprises’ innovation activities costs (C) and the number of personnel engaged in research and development in Russia’s constituent entities
|
First quantile of regions with a low volume of shipped innovative goods (tau = 0.25) |
||||
|
Variable |
Coefficient |
Std. Error |
t -Statistic |
Prob. |
|
Const |
-0.906 |
0.215 |
-4.221 |
0.000*** |
|
C |
0.939 |
0.031 |
31.113 |
0.000*** |
|
L |
0.214 |
0.042 |
5.109 |
0.000*** |
|
Pseudo R-squared |
0.563 |
Mean dependent var |
8.584 |
|
|
Adjusted R-squared |
0.562 |
S.D. dependent var |
2.877 |
|
|
S.E. of regression |
1.581 |
Objective |
407.719 |
|
|
Quantile dependent var |
7.206 |
Restr. objective |
933.203 |
|
|
Sparsity |
3.591 |
Quasi-LR statistic |
1560.783 |
|
|
Prob(Quasi-LR stat) |
0,000 |
|||
|
Second quantile of regions with an median volume of shipped innovative goods ( tau = 0.5 ) |
||||
|
Variable |
Coefficient |
Std. Error |
t-Statistic |
Prob. |
|
Const |
0.735 |
0.193 |
3,803 |
0.0002*** |
|
C |
0.875 |
0.027 |
32,146 |
0.0000*** |
|
L |
0.164 |
0.038 |
4,346 |
0.0000*** |
|
Pseudo R-squared |
0.524 |
Mean dependent var |
8.584 |
|
|
Adjusted R-squared |
0.522 |
S.D. dependent var |
2.877 |
|
|
S.E. of regression |
1.440 |
Objective |
466.497 |
|
|
Quantile dependent var |
9.223 |
Restr. objective |
979.038 |
|
|
Sparsity |
2.801 |
Quasi-LR statistic |
1463.66 |
|
|
Prob(Quasi-LR stat) |
0.000 |
|||
|
Third quantile of regions with a high volume of shipped innovative goods (tau = 0.75 ) |
||||
|
Const |
2.541 |
0.174 |
14.601 |
0.000*** |
|
C |
0.854 |
0.025 |
34.832 |
0.000*** |
|
L |
0.046 |
0.034 |
1.342 |
0.181 |
|
Pseudo R-squared |
0.498 |
Mean dependent var |
8.584 |
|
|
Adjusted R-squared |
0.497 |
S.D. dependent var |
2.877 |
|
|
S.E. of regression |
1.718 |
Objective |
347.461 |
|
|
Quantile dependent var |
10.381 |
Restr. objective |
691.797 |
|
|
Sparsity |
2.913 |
Quasi-LR statistic |
1260.886 |
|
|
Prob(Quasi-LR stat) |
0.000 |
|||
|
Source: own compilation. |
||||
activity carried out by enterprises compared to the regions of the first group. The degree of significance of these two factors was the highest in the third group of regions. The elasticity coefficients for production factors in this group of regions were significantly higher than in the first and second groups. These regions are characterized by less developed human scientific potential and a smaller volume of costs attracted by enterprises for the implementation of innovation activities. Therefore, their importance for innovation development in this group of regions is much higher. The Cobb – Douglas production function made it possible to establish the effectiveness of innovation activities carried out by enterprises in different groups of regions: an increasing return on the scale of innovation activity in the regions of the first and second groups, in which the sum of elasticity coefficients exceeded one, and a decreasing return in the third group of regions. The low efficiency of the innovation activity carried out in the regions of the third group is associated with a low concentration of research personnel and the costs incurred by enterprises for the production of innovative goods, services and works. The models constructed by time series for the period from 2010 influence of production factors on the volume of to 2020 for each constituent entity of the Russian shipped innovative goods in Russia’s constituent Federation allowed us to confirm the differentiated entities (Tab. 4).
Table 4. Results of regression analysis of the dependence of the volume of shipped innovative goods on the enterprises’ innovation activities costs and the number of research personnel in Russia’s regions
|
Region |
Volume of innovation activities costs |
Number of research personnel |
||
|
с -£ о о ™ § $ 111 |
Moscow |
0.688** |
0.367* |
|
|
Saint Petersburg |
0.905** |
0.205** |
||
|
Sverdlovsk Oblast |
1.105*** |
- |
||
|
Tyumen Oblast |
1.212*** |
- |
||
|
Perm Oblast |
0.566* |
0.654* |
||
|
Nizhny Novgorod Oblast |
0.465*** |
0.659*** |
||
|
Moscow Oblast |
0.521*** |
0.576*** |
||
|
Republic of Tatarstan |
0.591*** |
0.659*** |
||
|
1 |
5 |
Belgorod Oblast |
0.649*** |
0.684*** |
|
Samara Oblast |
0.523*** |
0.702*** |
||
|
Republic of Mordovia |
0.195* |
1.304*** |
||
|
Chelyabinsk Oblast |
- |
1.14*** |
||
|
Omsk Oblast |
- |
1.189*** |
||
|
Tula Oblast |
0.721** |
0.482* |
||
|
Rostov Oblast |
0.748*** |
0.384*** |
||
|
Republic of Bashkortostan |
0.849*** |
0.339** |
||
|
Udmurt Republic |
1.209*** |
- |
||
|
Krasnoyarsk Krai |
1.006*** |
- |
||
|
Murmansk Oblast |
1.083*** |
- |
||
|
Khabarovsk Krai |
1.120*** |
- |
||
|
5 1 |
Ulyanovsk Oblast |
0.527*** |
0.689*** |
|
|
Stavropol Krai |
0.411*** |
0.869*** |
||
|
Kemerovo Oblast |
0.027* |
1.273*** |
||
|
Tver Oblast |
0.188* |
0.965*** |
||
|
Kursk Oblast |
0.085* |
1.136*** |
||
|
Novosibirsk Oblast |
0.329* |
0.744*** |
||
|
Chuvash Republic |
0.481* |
0.804** |
||
|
Altai Krai |
0.314* |
0.84*** |
||
|
Kostroma Oblast |
0.576* |
0.991* |
||
|
Oryol Oblast |
0.195* |
0.948* |
||
|
Saratov Oblast |
0.268* |
0.828*** |
||
|
Komi Republic |
0.131* |
1.131*** |
||
|
Yaroslavl Oblast |
- |
1.181*** |
||
|
Volgograd Oblast |
- |
1.193*** |
||
|
Ryazan Oblast |
- |
1.185*** |
||
|
Vologda Oblast |
- |
1.607*** |
||
|
Leningrad Oblast |
- |
1.101*** |
||
|
HMAO Knanty-Mansi Autonomous Okrug |
- |
1.311*** |
||
|
Zabaikalsky Krai |
- |
1.372*** |
||
|
Sakhalin Oblast |
- |
1.421*** |
||
|
Novgorod Oblast |
- |
1.185*** |
||
Note: * – statistical significance at the level of 10%, ** – statistical significance at the level of 5%, *** – statistical significance at the level of 1%.
Source: own compilation.
To confirm the high importance of these factors in the formation and deepening of the spatial heterogeneity of innovation development in Russia, a spatial autocorrelation analysis of the distribution of these factors was carried out according to P. Moran’s method (Fig. 1, 2).
Figure 1. Spatial clustering of regions by number of research personnel in 2020
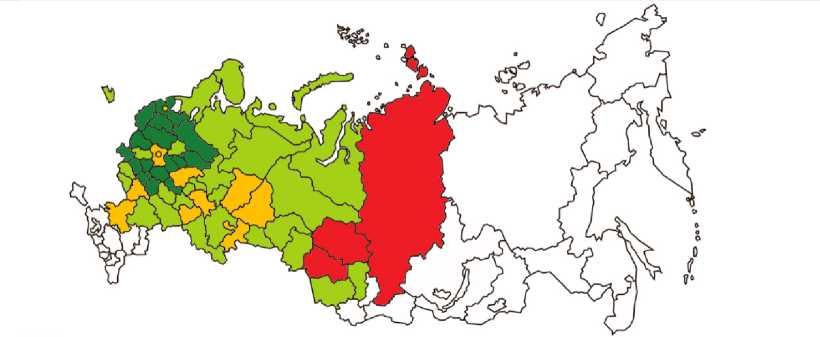
Growth pole with a greater number of research personnel, compared to surrounding territories
Spatial cluster of regions with high concentration of research personnel
Regions in which the influence of growth poles and spatial clusters is strong
Regions in which the influence of growth poles and spatial clusters is weak
Regions with a smaller number of research personnel, compared to surrounding territories
Source: own elaboration.
Figure 2. Spatial clustering of regions by volume of enterprises’ innovation activities costs in 2020
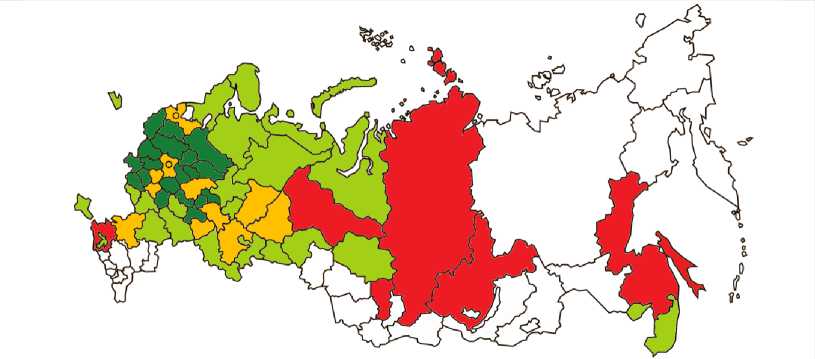
Growth pole with a greater volume of innovation activities costs, compared to surrounding territories
Spatial cluster of regions with high innovation activities costs
Regions in which the influence of growth poles and spatial clusters is strong
Regions in which the influence of growth poles and spatial clusters is weak
Regions with a smaller volume of innovation activities costs, compared to surrounding territories
Source: own elaboration.
As a result of the analysis, we identified growth poles with a high concentration of research personnel (the Tomsk and Novosibirsk oblasts, Krasnoyarsk Krai), clusters of similar regions were formed in terms of the number of research personnel: “Central” (Moscow, the Moscow and Nizhny Novgorod oblasts), “Southern” (the Voronezh and Rostov oblasts), “Privolzhsky” (the Samara Oblast, Perm Krai, and the Republic of Tatarstan), “Uralsky” (the Sverdlovsk and Chelyabinsk oblasts), as well as the zones of their influence extending to the regions of the Central and Northwestern federal districts (see Fig. 1). Spatial autocorrelation analysis has shown that regions with a high concentration of research personnel (growth poles and spatial clusters) form the first and second groups of regions with a high volume of shipped innovative goods.
The established spatial clusters and their zones of strong influence in terms of the number of research personnel (see Fig. 1) and in terms of the volume of innovative goods shipped (see Tab. 1) almost completely coincided. The quadrants of LL regions with low values of these indicators also coincided. This quadrant includes regions of the North Caucasian, Siberian and Far Eastern federal districts, that is, regions with a low concentration of research personnel and a low level of innovation activity of enterprises. A very similar clustering of regions was established as a result of spatial autocorrelation analysis and in terms of the volume of enterprises’ innovation activities costs (see Fig. 2). Most of the identified spatial clusters and zones of their influence for this indicator coincided with similar quadrants of P. Moran’s scatter plot in terms of the number of research personnel (see Fig. 1). The results of the spatial autocorrelation analysis in terms of enterprises’ innovation activities costs are very similar to the results of the analysis in terms of the volume of shipped innovative goods, works and services, which confirms our hypothesis about the significant influence of this factor on the deepening of the spatial heterogeneity of innovation development in Russia. A significant part of the financial resources allocated to the implementation of innovation activities are concentrated in the regions included in the Central, Northwestern, Volga and Ural federal districts.
ARMA and ARIMA modeling of the dynamics of the considered production factors was used to construct forecast scenarios for innovation development in Russia’s regions. As a result, the forecast values of their dynamics up to 2025 were determined according to three possible trajectories: taking into account the preservation of the noted trends in the dynamics of indicators for the period from 2010 to 2020, as well as the maximum permissible forecast values in case of the implementation of positive or negative trends. The forecast values of these factors were used to design three basic forecast scenarios for changes in the dynamics of the volume of shipped innovative goods in Russia’s regions – inertial, optimistic and pessimistic ( Fig. 3 ).
An inertial scenario, assuming the continuation of the noted trends in the dynamics of shipped innovative goods, works and services for 2010–2020, predicts further moderate growth of this indicator in the first and second groups of regions and the preservation of the achieved values without a directional trend in the regions of the third group. According to an optimistic forecast scenario, a moderate increase in the volume of shipped innovative goods is possible in the first and third groups and a more significant increase in this indicator in the second group of regions. The growth of innovation development in the regions of the third group, in our opinion, is constrained by the insufficiently high level of concentration of research personnel and financial resources of enterprises directed to innovation activities in comparison with the regions of other groups. Perhaps that is why in the regions of this group, the growth of enterprises’ innovation activity is not expected while maintaining the noted trends in the future, that is, when implementing an inertial scenario.
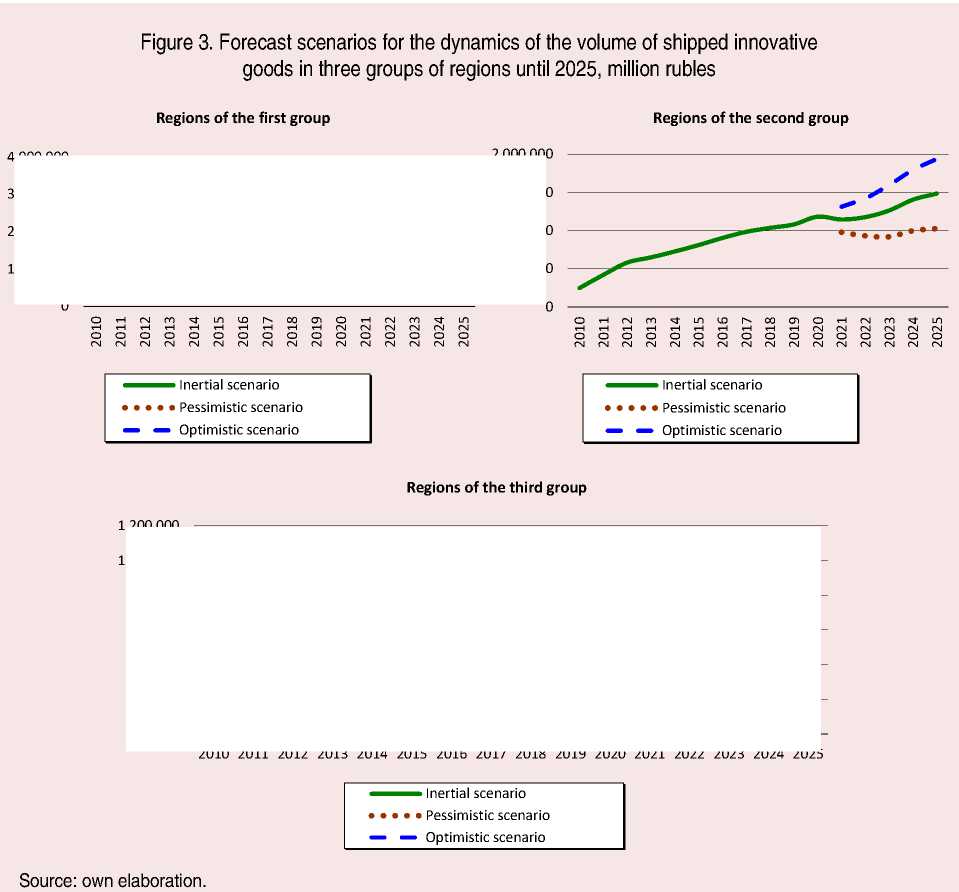
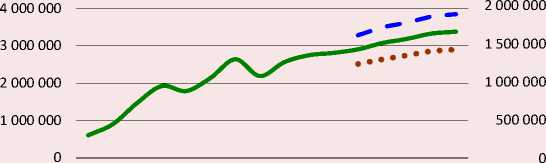
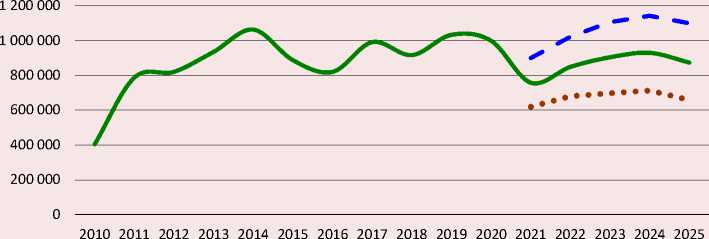
In our opinion, the rapid growth in the dynamics of the volume of shipped innovative goods in the second group of regions, expected under an optimistic scenario, is due to the fact that these regions belong to the emerging spatial innovation clusters (see Tab. 1), having a high level of concentration of research personnel and financial resources of enterprises, close interregional relationships with research centers. At the same time, due to the significant deterioration of the geopolitical situation and sanctions pressure on the Russian economy, it is quite possible that a pessimistic scenario will be imple- mented, which involves a reduction in the volume of shipped innovative goods in all groups of regions (see Fig. 3).
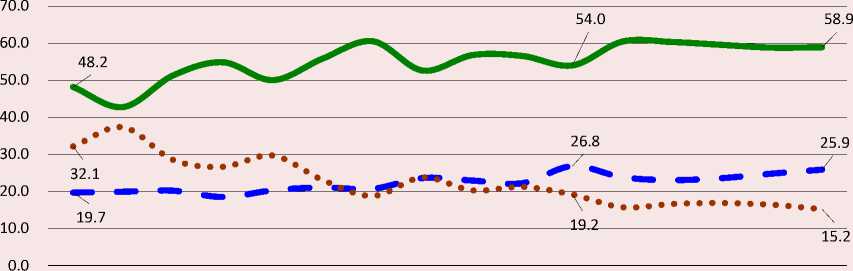
An assessment of the dynamics of changes in the level of concentration of shipped innovative goods in three groups of regions during 2010–2020 and its forecast values within the most likely, inertial scenario showed a deepening of the processes of increasing spatial heterogeneity of innovation development in Russia ( Fig. 4 ). In 2010 48.2% of all innovative goods shipped in Russia were concentrated in the first group of regions, while by 2020 the concentration level has increased to 54%.
Figure 4. Inertial forecast of changes in the concentration of innovation industries in three groups of regions until 2025, %
2010 2011 2012 2013 2014 2015 2016 2017 2018 2019 2020 2021 2022 2023 2024 2025
First group of regions Second group of regions Third group of regions
Source: own elaboration.
By 2025, it is possible for this indicator to grow to 58.9%. It is likely that the high level of concentration of innovation industries will also remain in the second group of regions, which was achieved by 2020 for the period from 2010 to 2020. The concentration level of shipped innovative goods in this group of regions has increased from 19.7 to 26.8%. By 2025, according to an inertia scenario, the concentration level of all shipped innovative goods in Russia is expected to reach 25.9% in the regions of this group. A significant deepening of spatial heterogeneity is also evidenced by the forecast reduction in the concentration of shipped innovative goods in the regions of the third group, which includes 65 constituent entities of Russia. If in 2010 the level of concentration of all goods shipped in Russia in this group of regions was 32.1%, then by 2020 it has decreased to 19.2%, and by 2025 the decline is expected to continue up to 15.2%. This means the curtailment of innovation industries in a significant part of the regions. Thus, according to the most likely forecast scenario, by 2025, an even more significant increase in the spatial heterogeneity of innovation development in regions is expected, and the main factors contributing to this process, according to our study, are the financial resources attracted by enterprises directed to the implementation of innovation activities, as well as the number of personnel in the region engaged in scientific research and development.
Conclusion
The study has confirmed the hypothesis that the increasing spatial heterogeneity of localization and concentration of research personnel and the costs of enterprises for the implementation of innovation activities enhance the spatial heterogeneity of innovation development in Russia. The study has revealed a strong spatial heterogeneity of Russia’s innovation development in the regional context, there is a significant concentration of volumes of shipped innovative goods and services in the regions of the first and second groups. Thus, 54% of all innovative goods shipped in Russia are concentrated in eight regions: the cities of Moscow and Saint Petersburg, the Republic of Tatarstan, the Moscow, Nizhny Novgorod, Sverdlovsk and Tyumen oblasts, and Perm Krai. In the second group of regions with the volume of shipped innovative goods above the Russian average, which included the Belgorod, Samara, Omsk, Tula, Murmansk, Rostov, and Chelyabinsk oblasts, the republics of Bashkortostan, Udmurtia and Mordovia, and Krasnoyarsk and Khabarovsk krais, according to 2020, 26.8% of all Russian innovative goods and services were shipped. The regions of the third group, with the volume of shipped innovative goods and services below the Russian average, which included 65 Russia’s constituent entities, accounted for only 19.2% in 2020.
The paper presents an original methodological toolkit based on the methods of standard deviations and spatial autocorrelation analysis using P. Moran’s method, regression modeling, autoregressive analysis using a moving average (ARMA, ARIMA). As a result of the study, clustering of regions was carried out by the volume of innovation activities carried out by enterprises, the dependence of the volume of shipped innovative goods on the level of enterprises’ innovation activities costs and the number of research personnel in the regions, as well as the degree of influence of these factors in different groups of regions, the most probable and extremely possible forecast scenarios of changes in the dynamics of these factors were formed in the future, corresponding scenarios of changes in the dynamics of innovative goods shipped by enterprises and their concentration in certain regions. The calculation of the concentration level in the regions of all innovative goods shipped in Russia according to the values forecast until 2025 will allow us to establish further directions of spatial localization of innovation industries, trends of decreasing or increasing spatial heterogeneity of innovation development of regions. The constructed forecast scenarios can be used to form strategies for innovation development in Russia’s regions, taking into account the identified features of the spatial localization of factors that have a significant impact on it.
References Scenario modeling and forecasting of the spatial heterogeneity of innovation development in Russia
- Antunes M.A.M. (2016). Regional innovation heterogeneity in Europe: A Quantile Regression Analysis. Final Work in the form of Dissertation, Católica Porto Business School, 42.
- Blanco F.A., Delgado F.J., Presno M.J. (2020). R&D expenditure in the EU: Convergence or divergence? Economic Research-Ekonomska Istraživanja, 33(1), 1685–1710. DOI: 10.1080/1331677X.2020.1756371
- Degtyarev P.A. (2020). Influence of socio-economic factors on innovative development of regions and implementation of technological initiatives. Finansovye issledovaniya, 1(66), 71–77 (in Russian).
- Donichev O.A., Fraimovich D.Yu., Grachev S.A. (2018). Regional system of economic and social factors in the formation of innovation development resources. Ekonomicheskie i sotsial'nye peremeny: fakty, tendentsii, prognoz=Economic and Social Changes: Facts, Trends, Forecast, 11(3), 84–99 (in Russian).
- Dugarzhapova M.A., Zhalsaraeva E.A. (2020). Models and mechanisms of spatial development: Innovation aspect. Vestnik Altaiskoi akademii ekonomiki i prava, 8, 175–185 (in Russian).
- Filatov V.V. (2014). Forecasting of development of the market of innovations sectoral economic systems in conditions of uncertainty of the environment. Nauchnyi zhurnal NIU ITMO. Seriya “Ekonomika i ekologicheskii menedzhment”=Scientific Journal NRU ITMO. Series “Economics and Environmental Management”, 3, 576–584 (in Russian).
- Golova I.M., Sukhovey A.F. (2017). Development of innovative component for the region’s economic security. Ekonomika regiona,13(4), 1251–1263 (in Russian).
- Granberg A.G., Valentey S.D. et al. (2006). Dvizhenie regionov Rossii k innovatsionnoi ekonomike [Movement of Russian Regions Toward an Innovation Economy]. Moscow: Nauka.
- Gusarova M.S. (2021). Problems of innovative development in Russia: Factor analysis and institutional solutions. Voprosy innovatsionnoi ekonomiki=Russian Journal of Innovation Economics, 11(4), 1383–1402. DOI: 10.18334/vinec.11.4.113870 (in Russian).
- Kisurkin A.A. (2012). Factors influencing innovation development in the region and their classification by management levels. Sovremennye problemy nauki i obrazovaniya, 2. Available at: https://science-education.ru/ru/article/view?id=5762 (accessed: January 17, 2023; in Russian).
- Komkov N.I. (2017). Scientific and technological development: Limitations and opportunities. Problemy prognozirovaniya=Studies on Russian Economic Development, 5, 11–21 (in Russian).
- Krivchanskaya A.V. (2017). Features of the innovation market. Ekonomika i menedzhment innovatsionnykh tekhnologii=Economics and Innovations Management, 11. Available at: https://ekonomika.snauka.ru/2017/11/15430 (accessed: December 15, 2022; in Russian).
- Liu P., Zhang L., Tarbert H., Yan Z. (2021). Analysis on spatio-temporal characteristics and influencing factors of industrial green innovation efficiency – from the perspective of innovation value chain. Sustainability, 14(1), 342. DOI: 10.3390/su14010342
- Marabaeva L.V., Sokolov O.A., Gorin I.A., Kovalev A.E. (2020). Scenario forecast of the Russian territorial innovative clusters development based on the project approach. Innovatsii, 1, 86–93 (In Russian).
- Mariev O.S., Ignat'eva E.D., Naberezhneva E.P., Savin I.V. (2012). Econometric modeling of regional factors of production forces innovational development in the resources-dependent Russian economy. Vestnik UrFU. Seriya “Ekonomika i upravlenie”, 5, 133–145 (in Russian).
- Mikhailov A. S., Gorochnaya V. V., Khvalei D. V., Gumenyuk I. S. (2020). Innovative development of Russian coastal regions: North-south divergence. Baltiiskii region=Baltic Region, 12(3), 105–126. DOI: 10.5922/2079-8555-2020-3-7 (in Russian).
- Mityakov S.N., Mityakova O.I., Murashova N.A. (2017). Innovative development of the regions of Russia: Results of monitoring (on the example of the Privolzhsk federal district). Innovatsii, 8(226), 114–119 (in Russian).
- Moskvina O.S. (2019). Measuring the spatial polarization of development of innovative processes in Russia. Kreativnaya ekonomika=Creative Economy, 13(4), 685–692. DOI: 10.18334/ce.13.4.40602 (in Russian).
- Moskvina O.S., Makoveev V.N. (2019). Statistical analysis of spatial unevenness of Russian regions’ innovative development. Problems of Territory’s Development, 5(103), 124–137. DOI: 10.15838/ptd.2019.5.103.8 (in Russian).
- Myachin A.L. (2020). Innovation development: Review and estimation of heterogeneity. In: Proceedings of the 20th International Conference on Group Decision and Negotiation. Ryerson University, 22.1-22.10. Available at: https://publications.hse.ru/en/chapters/369954183
- Naumov I.V., Barybina A.Z. (2020). The spatial autoregression model of innovative development of Russian regions. Vestnik Tomskogo gosudarstvennogo universiteta. Ekonomika= Tomsk State University Journal of Economics, 52, 215–232. DOI: 10.17223/19988648/52/13 (in Russian).
- Nikitskaya E.F. (2020). Spatial irregularity in innovative development of macro-regions and regions of Russia. Federalizm=Federalism, 25(4)(100), 68–89. DOI: 10.21686/2073-1051-2020-4-68-89 (in Russian).
- Polina E.A., Solovyeva I.A. (2019). Methodology for comprehensive assessment of regional innovative development. R-Economy, 5(2), 79–91. DOI: 10.15826/recon.2019.5.2.009
- Smirnova O.P., Ponomareva A.O. (2020). Assessment of innovative development differentiation of Russian regions. International Transaction Journal of Engineering, Management, & Applied Sciences & Technologies, 11(13), 11A13P. DOI: 10.14456/ITJEMAST.2020.262/. Available at: http://TUENGR.COM/V11A/11A13P.pdf
- Wang K.-L., Zhang F.-Q. (2021). Investigating the spatial heterogeneity and correlation network of green innovation efficiency in China. Sustainability, 13(3), 1104. DOI: 10.3390/su13031104
- Wu K., Wang Y., Zhang H., Liu Y, Ye Y. (2021). Impact of the built environment on the spatial heterogeneity of regional innovation productivity: Evidence from the Pearl River Delta, China. Chin. Geogr. Sci., 31, 413–428. DOI: 10.1007/s11769-021-1198-4
- Ye Z., Zou C., Huang Y. (2022). Impact of heterogeneous spatial structure on regional innovation – from the perspectives of efficiency and gap. Sustainability, 14, 12095. DOI: 10.3390/su141912095
- Yong Gang X. (2023). Research on spatial heterogeneity of regional innovation convergence. ECIT 2022, AHE 11, 419–426. DOI: 10.2991/978-94-6463-005-3_41
