Scene based non-uniformity correction for optical remote sensing imagery

Author: Lolith Gopan, E.Venkateswarlu, Thara Nair, G.P.Swamy, B.Gopala Krishna
Journal: International Journal of Image, Graphics and Signal Processing @ijigsp
Article in issue: 12 vol.9, 2017.
Free access
In this work, we propose and evaluate different scene based methods for non-uniformity corrections for optical remote sensing data sets. These methods can be used to correct or refine the existing radiometric calibrations, thereby improving the image quality. The performance of each algorithm against different datasets are analyzed and a quantitative comparison of different quality parameters viz. entropy, correlation coefficient, signal to noise ratio, peak signal to noise ratio and structural similarity index are carried out to recommend the best method for each scene. For a given data set, the selected method depends on the severity, type of terrain it covered, etc.
Non-uniformity Correction, gain, bias, mean ratio, median ratio, entropy, radiometric quality
Short address: https://sciup.org/15015924
IDR: 15015924 | DOI: 10.5815/ijigsp.2017.12.06
Text of the scientific article Scene based non-uniformity correction for optical remote sensing imagery
The objective of spectral imaging is that to get the range for every pixel in the image for object detection, identifying materials, or other recognizing processes. Mainly there are two branches of spectral imaging-'Push broom sensor', which read in an image over time and 'Snapshot hyper spectral imaging' which generates an image in an instance. Focal plane arrays are used in many modern spectral sensing and imaging systems like push broom sensor. It consists of an array of light-sensing pixels at the focal plane of a lens. The variability in the response of focal plane array detectors and roughness and presence of the dirt at cameras entrance slit are the main reason of the non-uniformity. It will appear as a striping artifact or fixed pattern noise in the output image or video sequences. Hence the push broom sensor needs the nonuniformity correction (NUC) in order to guarantee that all individual detectors behave uniformly to same input data [1].
For the sensor with linear array, the NUC will be the array of gains and offsets. Correction can be applied as a multiplicative factor for each detector response. But for nonlinear sensors, NUC will be the higher order mathematical expression. For push broom sensor data, usually the non-uniformity will appear as vertical stripes in the output data. Visually it is a disturbance for the users and also affects the result of image processing. Hence the need of non-uniformity correction arises. A good quality non-uniformity correction will increase the image interpretability and reduces the post-processing error. Different scene based methods of non-uniformity correction are studied. A comparative analysis has been carried out using image quality parameters and the best method is recommended based on image statistics.
-
II. Related work
With a particular purpose to fundamentally decrease the non-uniformity in the data, non-uniformity correction (NUC) must be applied. Based upon the accuracy conditions, some post processing strategies can be implemented to correct non-uniformities. These techniques include primary strategies, including calibration-based methods and scene-based methods.
Changes in the photo response of the individual detector for same irradiance may lead to fixed pattern noise in the image. Also gain and bias differences [2], variation in parameters will cause non-uniformity from sensor to sensor [3]. This type of fixed pattern noise can be dealt with laboratory calibration. Dark frame method capture the sensor output while no light reaches the photo detectors to acquire a great approximation of it [4, 5]. Then, the ensuing dark body is saved as reference and subtracted at each frame from the sensor output. At the same time as this method is simple and inexpensive, this one-time calibration has the drawback to disregard fixed pattern noise versions brought about by using the sensor working conditions. It is necessary to do calibration frequently for fixed pattern noise due to its uncertainty. This problem can be solved using multiple calibration [6, 7].
A greater cost-effective answer in terms of memory is defined in [8]. At the top of the sensor, a series of black and dark lines more strains being protected from light is located. In particular, black lines have 0 integration time while darkish traces are protected from incident light whilst having the identical exposure as the image [9]. A column fixed pattern noise (FPN) signature can be estimated and should be updated according to conditions.
The calibration based method is the simplest and most precise and regular NUC strategy used for correcting the non-uniformities. It incorporates single point correction (SPC), two point correction (TPC), multiple point correction and the enhanced two point correction. In those methods, the gain and offset parameters are predicted with the aid of exposing the focal plane array (FPA) to various uniform blackbody temperatures relying on the set of rules adopted [10]. The calibration based strategies offer reasonably proper estimates of the nonuniformity, and after NUC, the ensuing IR images are radiometrically accurate [11]. In calibration-based techniques, the NUC has to be achieved on a regular basis due to the fact that non-uniformity has a tendency to drift over the time. The single point correction [12] technique may be used to accurate the offset of every pixel inside the infrared focal plane array (IRFPA). That is carried out by putting a non reflecting gray body (emissivity ≥ 0.9) of homogeneous temperature directly in front of the camera lens.
The TPC technique [13] is the most common and broadly used method to correct for non-uniformity of IRFPA. This technique uses uniform blackbody infrared sources at two extraordinary temperatures to estimate detector parameters and then compensate up on nonuniformity.
The piecewise-linear correction technique is simply an extension of the two-point calibration approach [14], to which more measurement points are included. It is used for correct characterization of the nonlinear behavior of the detector response. In this approach, some of unique temperature factors are used to divide the (nonlinear) response curve into several piece-wise linear sections a good way to accurate for non-uniformity.
Scene based non-uniformity correction methods does not require specific scenes or initial conditions for the purpose of calibration [15]. They are able to yield better results than calibration-based techniques. This method has higher machine reliability but higher computational complexity [16]. Scene-based non-uniformity correction (NUC) methods include distinct classes of postprocessing-algebraic techniques, and statistical techniques.
As defined in [17], the algebraic techniques employ global motion among the frames within the video datasets and attempt to compensate for the non-uniformity without making statistical assumptions about the non-uniformity [18,19,20]. In [28] motion based non-uniformity correction methods are explained for Division of Focal Plane (DoFP) polarimeters. Ratliff et al. [21] particularly, have proposed an algebraic method based on motion vector estimation. Such techniques provide accurate robustness however, are computationally heavy and no longer without a doubt suitable for real-time correction. On the other hand, statistical techniques version of the fixed pattern noise (FPN) as a random spatial noise and estimate the information of the noise to cast off it [22, 23]. But, they depend on hypotheses concerning the sensor output image so as to separate the FPN from the actual image. It is necessary to make some assumptions for this method by means of the way the sensor captures data. The wrong assumption of the parameters results ghosting artifact [3].
-
III. Algorithm Description
Push broom sensors gather one spatial line of information at any given moment. The movement of the satellite permits to contribute another spatial line of information. The number of detectors and bands of a data is restricted by the dimensions of the FPA, while the number of lines in the image corresponds to the number of frames recorded. So correction and calibration parameters should be calculated for every detector individually by using following scene based methods.
-
A. Mean ratio method
It is a simple and common NUC method for linear push broom sensors [24]. It makes an assumption that the mean radiance of each detector is approximately the global radiance of the data (Fig. 1).
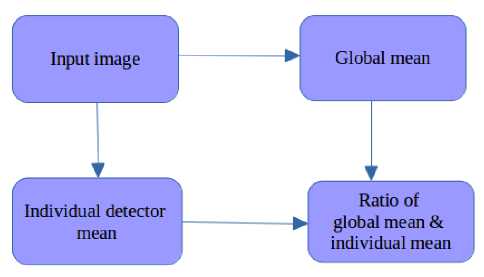
The NUC can be computed as follows:
-
• Compute the mean of each detector along the column
-
• Estimate the mean of the data over the entire image
-
• Calculate the ratio of overall mean value to the mean of individual detector
-
• Ratio is considered as mean ratio NUC
-
B. Local mean ratio method
In this method (Fig. 2), the challenge is to find out the uniform sub scene within the scene. The uniform scene is ideally rooftops, flat fields, ocean etc. [25].
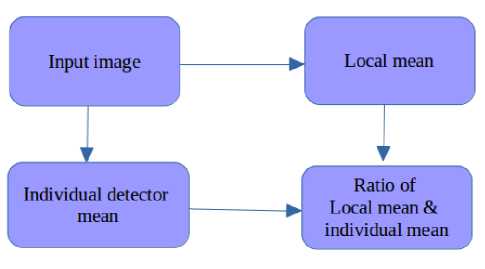
Local mean NUC can be obtained as follows:
-
• Divide the large image into sub images
-
• Obtain the standard deviation of each sub image and select the block which has minimum standard deviation
-
• Calculate the mean for each detector along the column
-
• Estimate the mean of the uniform sub image
-
• Compute the ratio of mean of uniform scene with the mean of each detector
-
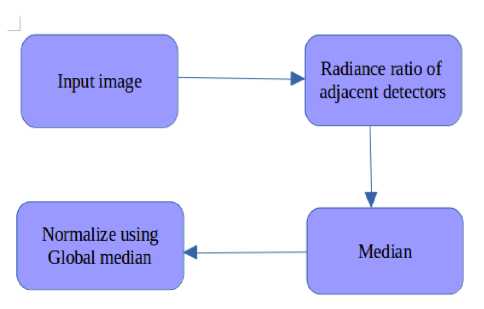
C. Median ratio method
Median ratio method depends on the ratio of adjacent radiance of each detector (Fig. 3). The ratio matrix extracts the strip information alone from the whole image.
same mean and standard deviation over the whole image (Fig. 4).
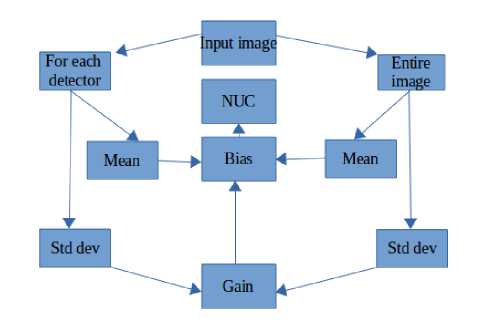
Fig.4. Gain and bias NUC method
For a linear sensor gain and bias are calculated using the mean and standard deviation of the image locally and globally [26].
This method can be summarized as follows.
-
• Calculate the mean and standard deviation of the entire image and for each detector
-
• Ratio of the standard deviation of entire image to the standard deviation of individual detectors will give the gain
-
• Difference between the mean of the entire image and individual detector mean will give the bias
-
• Use these gain and bias for correcting the nonuniformity
Gain =
StddevOrigmaL
StddevReference
Bias = Mean difference (reference - original).(2)
E. Frequency domain method
This method makes use of Gaussian low pass filter to cut the high frequency components from the input image (Fig. 5). Individual detector mean of original image is subtracted from the Gaussian filtered output in the log domain [25].
Median ratio NUC can be derived as follows:
-
• Compute the ratio of each sample radiance with adjacent sample
-
• Estimate the median of the above data along each detector
-
• Calculate the ratio of overall median value to the median of individual detector
-
• Calculate the rest of the values and consider as NUC coefficients
-
D. Gain and bias method
If the striping is caused by unequal detector gain and bias in the push broom sensors, this method works well. It will adjust the radiance from each detector to yield the
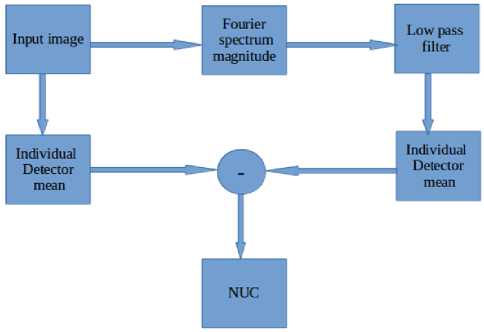
Fig.5.Frequency domain NUC method
The following steps to be followed to obtain the frequency domain correction matrix:
-
• Compute the average of each detector and find its logarithmic value
-
• Use Gaussian low pass filter to cut the higher frequency components
-
• Results are subtracted from the log of average of each detector
-
• Take the anti-log of the output array. It gives the NUC
-
IV. Quality Parameters
Various quality parameters are evaluated to assess the improvement introduced by different methods under consideration, discussed in the previous section. The analysis can be done both individually and comparatively [27]. From the input and corrected images, correlation coefficient, Peak signal to noise ratio, structural similarity index values can be calculated. For these parameters, the size of both images should same. Entropy and signal to noise ratio are calculated individually for input and output images.
-
A. Entropy
Entropy is a statistical measure of randomness that can be used to characterize the texture of the image. Entropy is defined as
Js^d l -L ' ) I 100
Banding = -------------- x 100 (5)
Where Li is individual detector mean, L’ is the mean of corresponding block and ‘i‘ is the line number.
-
D. Peak Signal to Noise Ratio (PSNR)
PSNR is the ratio between maximum possible power of the radiance of the image and the corrupting noise (MSE).
PSNR = 10 * log io Q (6)
Here R is the highest possible pixel value of the image. MSE is the Mean Squared Error. For a good quality image PSNR will be a higher value.
-
E. Structural Similarity index (SSIM)
SSIM is the quality metric which is used for measuring the similarity between the images. It is based on the comparison of image luminance, contrast and structure. For two input images x and y
SSIM =
(2mxmy+c i )(2sxy+c2)
(m } +m ^ +c i )(s 2 +s 2 +c2)
Where m x , m y are the mean and s x , s y are the standard deviation of input and output images respectively. S xy is the co-variance between x and y. c1 and c2 are constants to stabilize the division with weak parameters.
Е = — Z“=1 рп .* log2(pn) (3)
Where M is the number of gray levels and pn is the probability associated with gray level n .
-
B. Correlation Coefficient
The correlation coefficient is a measure that determines the degree to which two images are associated. The range of the output lies in the interval [-1 1]. It will give 1 if both images are same. It estimates only the linear relationship between the pixels.
2™ 1 2 "=1 (ху-х‘НУу-У')
^Й=1^№
where x and y are input and output image, m and n are the row and column number of the image, x’ and y’ represents the mean of input and output image respectively.
-
C. Banding
This quality parameter will calculates the percentage of the density of striping in the image. For an image it will divide the whole image into blocks of size 100 in across track direction. Banding gives the plot between banding percentage and block number. Banding can be calculated as follows-
-
V. Tool Description
The system is developed using Matlab 2015a software. We developed an automated tool which read the input image directly from the command line and apply all algorithms and compare the results based on the quality parameters (section IV). It gives the result which has maximum correlation coefficient, PSNR, SSIM and SNR. Also it will save the output image along with the quality report (Fig 6). In this automated tool, the type of method which is used and all the quality checking operations are hidden from the user.
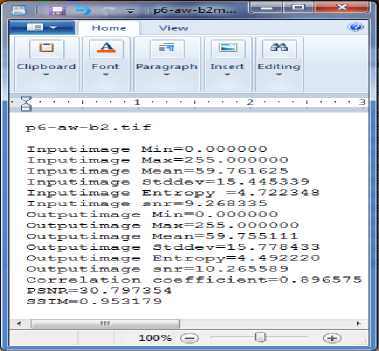
Fig.6. Snapshot of the log file of quality parameters
An interactive environment is built by using a graphical user interface (GUI) in Matlab (Fig. 7). User can transparently deal with all correction methods. The interactive method will give the comparative analysis in qualitatively and quantitatively for each method.
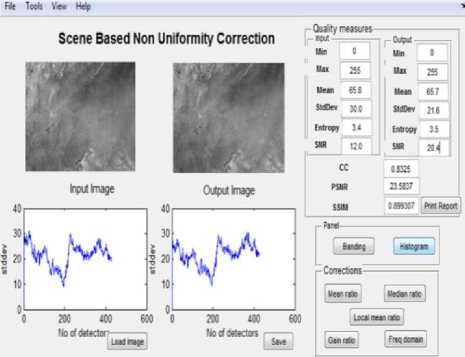
Fig.7.Snapshot of GUI
The interactive tool will give the input and output image along with its standard deviation plot. All scene based non-uniformity correction methods are given in a way that user can select one at a time. Output image displays along with standard deviation plot and quality measures-entropy, signal to noise ratio, correlation coefficient, peak signal to noise ratio, structural similarity index. The user can also save the output image and quality parameters. View menu provides the option for histogram, banding plots and display the input and output image.
-
VI. Experimental Results and Analysis
The datasets selected for the assessment are from Linear Imaging and Self Scanning Sensor (LISS-3) and Advanced Wide Field Sensor (AWiFS) of IRS-P6. Details are provided in table-1:
Table-1. Details of satellite data used
|
Satellite |
Sensor |
Date of pass |
|
IRS-P6 |
AWiFS |
08Jan2015 |
|
IRS-P6 |
LISS-3 |
03Oct2015 |
Table II. Quality parameters of AWiFS image
|
Quality Parameters |
Input |
Outputs of various methods |
||||
|
MR |
LMR |
MDR |
GB |
FD |
||
|
Mean |
59.7 |
59.7 |
72.2 |
74.9 |
59.3 |
59.7 |
|
Std. dev |
16.6 |
15.7 |
19.1 |
20.2 |
16.4 |
16.2 |
|
SNR |
9.3 |
10.3 |
10.3 |
9.5 |
12.9 |
10.2 |
|
Entropy |
4.7 |
4.5 |
4.7 |
4.7 |
4.4 |
4.4 |
|
CC |
0.89 |
0.89 |
0.98 |
0.87 |
0.96 |
|
|
PSNR |
30.8 |
30.6 |
38.9 |
29.7 |
35.8 |
|
|
SSIM |
0.95 |
0.95 |
0.99 |
0.94 |
0.98 |
|
(MR-mean ratio; LMR-local mean ratio; MDR-median ratio; GB-gain-bias; FD-frequency domain)
(a) (b)
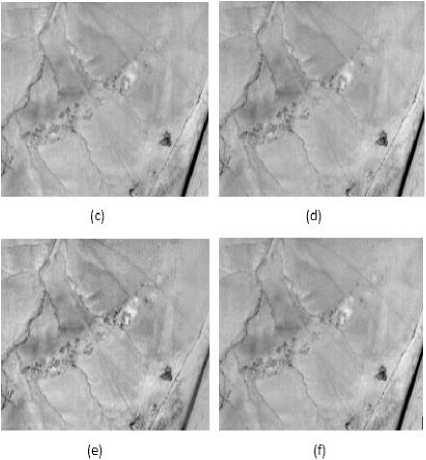
Fig.8.(a) Input image (b) Mean ratio method (c) Local mean ratio method (d) Median ratio method (e) Gain and bias method (f) Frequency domain method
Fig- 8 shows the output of the AWiFS image against all correction methods with input image. It is clear that striping effect from the input image is removed by using median ratio method without affecting the brightness and contrast information of the input image. Frequency domain method gives better performance for the given LISS-3 image (Fig 9). Here the median ratio method gave poor performance for this image. If there is any spatially uniform areas are present in the image then the local mean method will give good result.
Table III. Quality parameters of LISS-3 image
|
Quality Parameter s |
Input |
Outputs of various methods |
||||
|
MR |
LMR |
MDR |
GB |
FD |
||
|
Mean |
137 |
136 |
182 |
183 |
137 |
126 |
|
Std. dev |
49.8 |
41.8 |
85.3 |
7.34 |
49.8 |
48.6 |
|
SNR |
11.7 |
12.9 |
12.9 |
11.8 |
13.1 |
18.8 |
|
Entropy |
4.2 |
4.6 |
5.3 |
1.3 |
4.6 |
5.2 |
|
CC |
0.70 |
0.64 |
0.52 |
0.70 |
0.93 |
|
|
PSNR |
17.0 |
17.0 |
6.0 |
16.5 |
25.0 |
|
|
SSIM |
0.85 |
0.82 |
0.15 |
0.85 |
0.96 |
|
(MR-mean ratio; LMR-local mean ratio; MDR-median ratio; GB-gain-bias; FD-frequency domain)
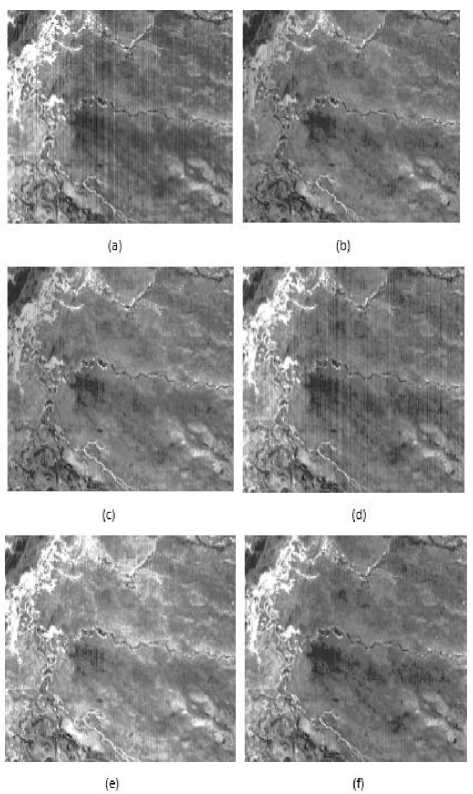
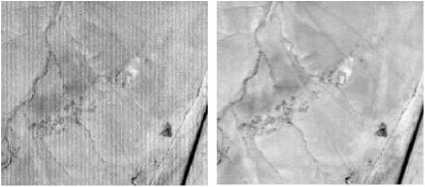
Fig 9.(a) Input image (b) Mean ratio method (c) Local mean ratio method (d) Median ratio method (e) Gain and bias method (f) Frequency domain method
Gaussian low pass filter is used in frequency domain method to eliminate high frequency components from the image. The high frequency components that are removed from the image contain the striping and noise of the input image. Results of LISS-3 image are shown in Fig-10.
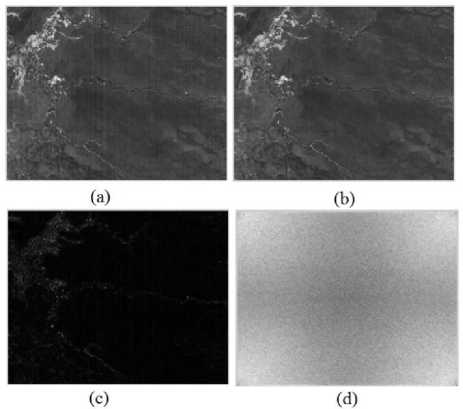
Fig.10.(a) Input image (b) Frequency domain corrected image (c) High frequency component removed (d) power spectrum of high frequency component
For all input and output images, banding parameter is estimated in percentage for every 100 detectors as one block in across track direction and shown in Fig-11.
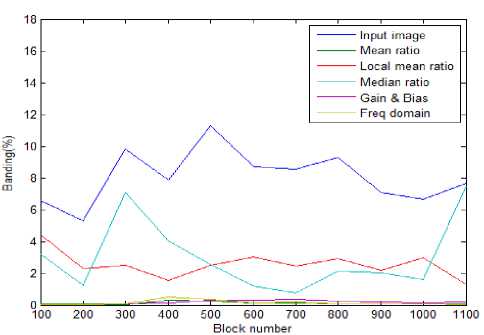
Fig.11.Banding plot of LISS-III image
From the banding plot the highest banding percentage is 11.85 in the input image for 500th block. But it is reduced to 3.15 after applying the median and local mean ratio correction. For other methods, banding percentage is less than 1% and the lowest banding rate is given by frequency domain method for the given LISS-3 image.
-
VII. Conclusions
In this paper we analyzed different scene based nonuniformity correction methods on different images in spatial and frequency domain. The output of each algorithm will depend on the type of sensor and the scene that captured. Experimental results show that median ratio method outperforms giving good result for the given AWiFS image. But for the given LISS-3 image frequency domain method gives better result. Based on the comparative analysis of quality measures, correction method is applied and result is saved in automatic module. But in interactive module, manual intervention is needed. For large size images, median ratio method is more computational intensive because it calculates the ratio between adjacent pixels of the image. In local mean method, it automatically estimate the uniform area from the image by the standard deviation of sub blocks achieved by using divide and conquer approach. Gain and bias parameters are required for the gain and bias method where as mean and median methods directly deal with the image as a whole. Taking the fast Fourier transform instead of DFT also gives good result in terms of time in frequency domain method.
-
VIII. Future Work
In this work, both frequency and spatial domain methods are applied sequentially and the quality parameters are evaluated to recommend the best method. To further improvise on this, we propose to apply a combinational approach on any single image by dividing the whole image into sub images. Main challenges are the automated identification of homogeneous terrains and the application of the best method which suits different homogenous terrains. Another difficulty is to radiometrically normalize the entire image without sacrificing the image quality.
Acknowledgment
The authors would also like to thank the Department of Computer Science and Engineering, Amrita School of Engineering, Amrita University, Coimbatore, India for the support throughout the work.
References Scene based non-uniformity correction for optical remote sensing imagery
- Gómez-Chova, Luis, et al. "Correction of systematic spatial noise in push-broom hyperspectral sensors: application to CHRIS/PROBA images."Applied Optics 47.28 (2008): F46-F60.
- Torres, S., Rodrigo Reeves, and M. Hayat. "Scene-based nonuniformity correction method using constant-range: Performance and analysis."Proceedings of 6th World Multiconference on Systemics, Cybernetics and Informatics. Vol. 9. No. 1. 2002.
- Harris, John G., and Yu-Ming Chiang. "Nonuniformity correction using the constant-statistics constraint: analog and digital implementations."AeroSense'97. International Society for Optics and Photonics, 1997.
- Schöberl, Michael, et al. "Non-linear dark current fixed pattern noise compensation for variable frame rate moving picture cameras."Signal Processing Conference, 2009 17th European. IEEE, 2009.
- Malueg, Richard M. "Detector array fixed-pattern noise compensation." U.S. Patent No. 3,949,162. 6 Apr. 1976.
- Friedenberg, Abraham, and Isaac Goldblatt. "Nonuniformity two-point linear correction errors in infrared focal plane arrays."Optical Engineering 37.4 (1998): 1251-1253.
- Newman, J.W.. Method and apparatus for image signal compensation of dark current, focal plane temperature, and electronics temperature 2007.
- Bosco, A., Findlater, K., Battiato, S., Castorina, A.. A temporal noise reduction filter based on image sensor full-frame data. In: IEEE.International Conference on Consumer Electronics, ICCE 2003. 2003, p. 402 – 403.
- Collins, Steve. Simplified fixed pattern noise correction and image display for high dynamic range CMOS logarithmic imagers. Diss. University of Oxford, 2007.
- Smith, Ronald D. "Correcting non-uniformity in displays." U.S. Patent No. 6,285,349. 4 Sep. 2001.
- Hayat, M. M.; Ratliff B. M.; Tyo J.S.; Agi K.; “Generalized Algebraic Algorithm for Scene-based Nonuniformity Correction,” procspie,5556,122-136, 2004.
- Tendero, Y., et al. "Efficient single image non-uniformity correction algorithm."Security+ Defence. International Society for Optics and Photonics, 2010.
- Friedenberg, Abraham, and Isaac Goldblatt. "Nonuniformity two-point linear correction errors in infrared focal plane arrays."Optical Engineering 37.4 (1998): 1251-1253.
- Shi, Yan, Tianxu Zhang, and Zhiguo Cao. "A new piecewise approach for nonuniformity correction in IRFPA."International Journal of Infrared and Millimeter Waves 25.6 (2004): 959-972.
- Leathers, R., and T. Downes. "Scene-based nonuniformity correction and bad-pixel identification for hyperspectral VNIR/SWIR sensors."Proc. IEEE IGARSS. 2006.
- Huang, Tang, Liu Xiao-Lin, and Shen Yang. "Fixed pattern noise suppression algorithm based on background modeling."Procedia Engineering 29 (2012): 884-888.
- Sakoglu, U., Hardie, R., Hayat, M., Ratliff, B., Tyo, J.. Nan algebraic restoration method for estimating fixed pattern noise in infrared imagery from a video sequence. In: 9th Annual Meeting of the SPIE: Applications of Digital Image Processing XXVII, Denver, CO, SPIE Proc; vol. 5558. 2004, p. 69–79.
- Li, Jing, et al. "Scene-based nonuniformity correction with adaptively adjusting integration time." Information Science and Technology (ICIST), 2013 International Conference on. IEEE, 2013.
- Torres, S., Rodrigo Reeves, and M. Hayat. "Scene-based nonuniformity correction method using constant-range: Performance and analysis."Proceedings of 6th World Multiconference on Systemics, Cybernetics and Informatics. Vol. 9. No. 1. 2002.
- Ratliff, Bradley M., Majeed M. Hayat, and J. Scott Tyo. "Generalized algebraic scene-based nonuniformity correction algorithm."JOSA A 22.2 (2005): 239-249.
- Ratliff, B.M., Hayat, M.M., Hardie, R.C.. An algebraic algorithm for nonuniformity correction in focal-plane arrays. J Opt Soc Am A 2002;19(9):1737–1747.
- Hayat, Majeed M., et al. "Statistical algorithm for nonuniformity correction in focal-plane arrays."Applied optics 38.5 (1999): 772-780.
- Zuo, Chao, et al. "Scene-based nonuniformity correction method using multiscale constant statistics."Optical Engineering 50.8 (2011): 087006-087006.
- Leathers, R., and T. Downes. "Scene-based nonuniformity correction and bad-pixel identification for hyperspectral VNIR/SWIR sensors."Proc. IEEE IGARSS. 2006.
- Leathers, Robert A., Trijntje Valerie Downes, and Richard G. Priest. "Scene-based nonuniformity corrections for optical and SWIR pushbroomsensors."Optics express 13.13 (2005): 5136-5150.
- Ratliff, Bradley M., et al. "Combatting infrared focal plane array nonuniformity noise in imaging polarimeters."Optics & Photonics 2005. International Society for Optics and Photonics, 2005.
- Mohammadi, Pedram, Abbas Ebrahimi-Moghadam, and ShahramShirani. "Subjective and objective quality assessment of image: A survey."arXiv preprint arXiv:1406.7799 (2014).
- Kumar, Rakesh, J. Scott Tyo, and Bradley M. Ratliff. "Motion-based nonuniformity correction in DoFPpolarimeters."Optical Engineering+ Applications. International Society for Optics and Photonics, 2007.
