Search of mechanical stressed sections in fiber optical communication lines based on Brillouin backscattering spectrum analysis

Author: Bogachkov Igor V., Maystrenko Vasiliy A.
Journal: Журнал Сибирского федерального университета. Серия: Техника и технологии @technologies-sfu
Article in issue: 7 т.8, 2015.
Free access
The actual problem of duly revealing of mechanical stressed sections of fiber optical communication lines, in particular, optical fibers which are under influence of the raised mechanical pressure (strain) in optical cables is considered in this paper. Results of modeling of Brillouin backscattering spectrum changes depending on change of optical fiber strain are presented. Results of experimental examinations of strain characteristics of various types optical fibers, which are under longitudinal and transverse mechanical influences, based on Brillouin backscattering spectrum analysis are given in this paper. Also are discussed temperature dependences of Brillouin backscattering spectrum changes of the optical fibers. The received results confirmed a possibility to detect problem (mechanical stressed) sections and estimations of the optical fiber strain degree on basis of Brillouin refl ectometry method at different mechanical infl uences.
Brillouin reflectometry, early diagnostics, reflectometer, an optical fi ber
Short address: https://sciup.org/146115014
IDR: 146115014 | UDC: 621.372.8: | DOI: 10.17516/1999-494X-2015-8-7-878-889
Поиск механически напряженных участков в волоконно-оптических линиях связи на основе анализа спектра бриллюэновского рассеяния
В статье рассматривается актуальная проблема своевременного выявления проблемных участков волоконно-оптических линий связи, в частности отрезков оптических волокон, находящихся под повышенным механическим напряжением (натяжением) в оптических кабелях. Изложены результаты моделирования изменений спектра бриллюэновского рассеяния в зависимости от изменения натяжения оптоволокна. Приведены данные экспериментальных исследований характеристик натяжения при продольных и поперечных механических воздействиях на оптические волокна различного вида и их температурных зависимостей на основе анализа изменений спектра бриллюэновского рассеяния. Полученные результаты подтвердили возможность обнаружения проблемных участков и оценки степени натяжения оптоволокна методом бриллюэновской рефлектометрии при различных механических воздействиях.
Text of the scientific article Search of mechanical stressed sections in fiber optical communication lines based on Brillouin backscattering spectrum analysis
Fiber-optical communication lines (FOL) are a dominating kind of high-speed communication lines now. They are capable to provide the maximal speed of data transmission from all existing communication lines, thus have high noise immunity and reserve of communication. Besides in optical cables (OC) are used nonferrous metals, cost of telecommunication channels on the basis of optical fibers (OF) in process of perfection of manufacture OC gradually decreases.
Obtaining trustworthy information on the physical state of OF in the OC is an important problem of the monitoring and early diagnostics of FOL.
The longevity of OF depends on the its strain [1–7].
Mechanical pressures applied to OF changes its parameters. For example, the tensile load applied to OF change and module of elongation (Young’s modulus, strain characteristics) which in turn changes the velocity of the ultrasonic wave [1 – 6].
The transverse pressures may affect the properties of the transverse-cross-section of OF and the regularity of FOL.
Usual optical pulse reflectometers don’t define a OF strain and mechanical stressed FOLsections.
One of the effective ways to determine OF strain ratio is Brillouin reflectometry method [1–6] based on recording and subsequent analysis of the stimulated Brillouin backscattering spectrum (BS) in OF.
It is known [1–4] that the spectral components caused by stimulated Brillouin scattering (SBS), have an important property for practical applications that their frequency is shifted on the quantity proportional to the strain of OF.
Testing OF by short-pulses and scanning carrier frequency of this pulses the distribution along OF of BS and, respectively, the maximum signal frequencies in this spectrum can be found. By measuring distribution amount of Brillouin frequency shift along OF the pattern of mechanical stresses (strain) distribution can be realized, and find the location of distributed irregularities in OF and determine their characteristics [1–4].
To detect mechanical stresses of the FOL-section (the strain of OF) Brillouin optical reflectometers (BOR) are used.
The strain of OF appears not only because of the tensile load, but also due to OF temperature changes. In addition, the sudden change of OF-section temperature points clearly to the problems in the FOL.
The research of transverse pressures influences on BS and mechanical (strain) characteristics of OF has particular interest.
Dispersion-shifted single mode OF (DSF) are used in very long FOL with length of regenerative sections more than 100 km.
In this OF frequency dispersion characteristics shifted so that the minimum («zero») dispersion is into the «window» near wavelength (λ) 1550 nm. These OF have good characteristics for both the specific attenuation and bandwidth. However it is known that the application of DSF in optical wavelength division multiplexing systems (WDM) is met with difficulties associated with the appearance of nonlinear effects such as four-wave mixing (FWM). Since the signal power levels entered in OF with BOR lead to non-linear effects, BS analysis and the detection of mechanically stressed sections of DSF are interest.
-
II. STATEMENT OF THE PROBLEM
In relation to detailing the models discussed in [13] and verifying the simulation results, experimental researches with BOR «Ando AQ 8603» with the assistance of «Moskabel–Fujikura» were carried out.
-
III. THE THEORY
In the general case wave equation of light propagation in fiber can be written as [13]:
2 E - 1 ∂ 2 E 2 c ∂ t 2
- µ 0
∂ 2 P L
∂ t
-
µ 0
2
∂ PNL
∂t2
where P L is linear and P NL is nonlinear part of induced polarization P ( r , t ) = PL ( r , t ) + PNL ( r , t ).
Illi
Usually PNL is considered to be much less than PL ( P NL << I P L ). PL and nonlinear PNL are connected with E by expressions (2):
P L ( r , t ) = ε 0 ∫ χ (1)( t - t ') ⋅ E ( r , t ') dt ',
-∞
∞
PNL ( r , t ) = ε 0 ∫∫∫ χ (3)( t - t 1, t - t 2, t - t 3) ⋅
-∞
⋅ E ( r , t 1) E ( r , t 2) E ( r , t 3) dt 1 dt 2 dt 3
where χj – tensors of nonlinear susceptibility of jth order. Expressions (2) define the general formalities of low order nonlinear effects description [2, 3].
Propagation equation (1) is nonlinear partial differential equation that can not be solved analytically except several particular cases. Therefore for studying nonlinear effects in OF it is necessary to use numerical methods.
The main expression that connects the Brillouin frequency shift f B and degree of fiber tension is [2, 4]:
f = ω A = 2 nv À
B 2π λ where n – the refraction index; νA – the velocity of acoustic wave;
v A = E ρ ε , (4)
E ε – Young's modulus (strain characteristics, module of elongation); ρ – quartz glass density, λ – the wavelength of incident light [4].
The value of Brillouin frequency shift in turn is included in the expression of the Brillouin gain coefficient (BGC) [1, 3]
|1 f - f»
gB g B 1 + I 2 к г
I V Л f B
2 1
, (5)
V where gˆB – the maximal BGC; ∆fB – the Brillouin gain bandwidth usually equals 50...70 MHz; ∆f – the difference between carrier frequency and frequency of measurements.
It is known that DSF are sensitive to nonlinear effects, therefore the BS analysis for the detection of OF strain become more complicated.
-
IV. EXPERIMENTAL RESULTS
In the first experiment (Fig. 1) the fiber is composed of normalized OF reel (1 – OF1) (length is 1.72 km), spliced with OF (3 – OF2) (length is 3 km). The spliced section (2) and profile of BS marked by arrow 2, and the maximum of BS – arrow 4. Both OF are single-mode.
At a distance of 2 m from the splice was formed the place on which hung weights from 20 g to 500 g (tensile force – from 0.2 N to 5 N). The reels were arranged so that the tensile force acts on OF only in the longitudinal direction.
Fig. 1 presents the pattern of BS in the fiber (3D-graph – amplitude distribution function of the reflected signal along the fiber length and Brillouin frequency shift) in the absence of a tensile force.
Fig. 2 shows the pattern of BS exposed to the tensile force for 2 N (with the 200g weight). As Fig. 2 indicates, some changes of BS are been observed.
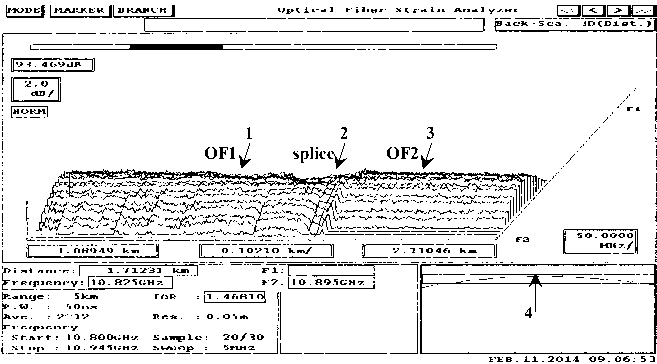
Fig. 1. 3D-graph BS distribution function of the reflected signal along the OF without tensile force
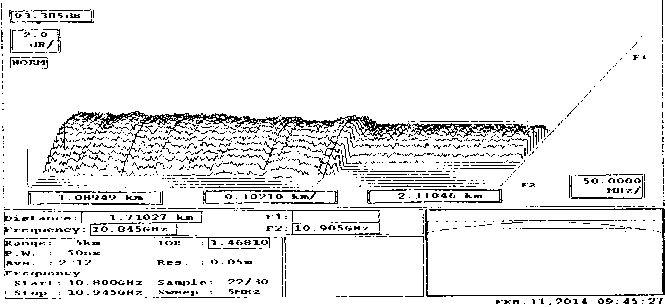
Fig. 2. 3D-graph BS distribution function along the OF with tensile force 2 N
(Shown on figures graphics (traces of device prints and photographs of its screens) were edited in «Photoshop» to improve quality and bring in a single form (elimination of glare, color inversion, brightness etc.)
Under increasing pressure to 4 N (400 g weight) changes in BS appears stronger in the strain section.
It should be noted that under 300 g weight pressure can be observed the fall in the level of the reflected signal for sprawling place which is associated with the appearance of different stresses in the attachment of weights due to asymmetry effects in the attachment.
Furthermore, dependence of BS different for OF with different elasticity of the protective coating.
In OF with tougher coating optical fiber can hardly stretch (BS in BOR does not change), but with loads of 4 N – 6 N immediately break off.
Fig. 3 and Fig. 4 show multi-reflectograms – the dependence of the fiber strain (Strain), BS, the width of BS (BSW) and losses (Loss) on the OF length.
Changing load the shift of the BS maximum from 10.84 GHz (without tensile force) to 10.90 GHz (tensile force is 5 N) was observed, which corresponds to the OF strain changes under load.
Fig. 3 and Fig. 4 show how BOR found strain change in the «problem section». The strain has changed approximately to 0.05 % when tensile force is 2 N and to 0.12 % when tensile force is 4 N.
With a further strain increasing up to 5 N the critical strain of 0.2 % was found. After removing the strain load OF returned to its original state.
Thereby, BS analysis allows effectively detect strain changes (Young’s modulus – E ε ) of OF.
Researching BS of OF inside the fiber optical cable (OC), which were under significant strain loads, led to the following conclusions.
Because of the power components of OC that protect it, and therefore all OF under it, against mechanical damages, significant changes in the BS under force strain loads are not observed.
As a result, BOR of the problem sections of OF in OC have not discovered until the critical levels of action (about 11 – 12 kN), which lead to destruction of OC.
In this experimental data analysis obtained by phase methods showed that these methods can detect the appearance of OF strain with a tensile load of 10 kN, which does not lead to the destruction of OC, which means you can take steps to find the problem section and eliminate hazardous exposures.
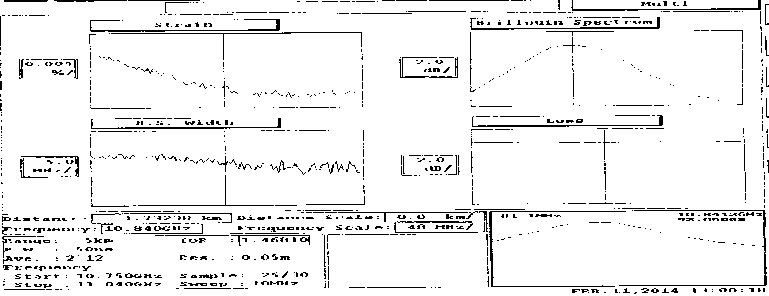
Fig. 3. Characteristics OF without tensile force
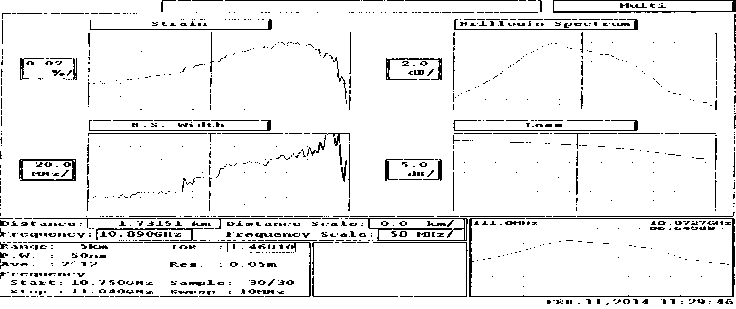
Fig. 4. Characteristics OF with tensile force 2 N
In the second experiment the fiber is composed of normalized OF reel (1 – OF1) (length is 1.72 km length), spliced with OF (3 – OF2) (length is 3 km). The spliced section (2) and profile of BS marked by arrow 2, and the maximum of BS – arrow 4. Both OF are single-mode.
In experimental researches this fusion spliced section (4 m – by 2 m of each OF reel) was placed in the heating chamber.
By heating the spliced section, BS and the strain of OF change was observed.
Fig. 5 shows the 3D-graph of BS at the temperature 120 °C.
Due to temperature changes shift of the maximum BS frequency from 10.82 GHz (– 20 °C) to 11.00 GHz (197 °C) was observed, which corresponds to the OF strain changes in the heating section.
At room temperature (25 °C) the maximum of BS was observed at a frequency 10.85 GHz.
The width of BS varied from 70 ... 100 MHz at room temperature for up to 90 ... 220 MHz at high temperatures.
Figures 6 and 7 show the dependence of the fiber strain (Strain), BS, the width of BS (BSW) and losses (Loss) on the OF length in the heated section.
The graphs show changes in characteristics.
Analysis of the Fig. 6 and 7 shows that upon the temperature change the strain grew up by 0.14 % (1 % = 104 µε ), and approached to a dangerous value.
At higher temperature increases to 150 °C the strain exceeded the critical level of 0.2 % (2000 µε ).
Similar studies by cooling OF from room temperature 25 °C to –20 °C led to compression of OF (negative strain) by 0.05 %.
When the temperature returns to 25 °C OF characteristics in both cases were restored to their original condition.
Fig. 8 presents a graphics of temperature dependence of the BS maximum in OF heating section obtained from data analysis of the experiment.
Graph of the temperature dependence of the OF strain in heating section based on analysis of experimental data shown in Fig. 9.
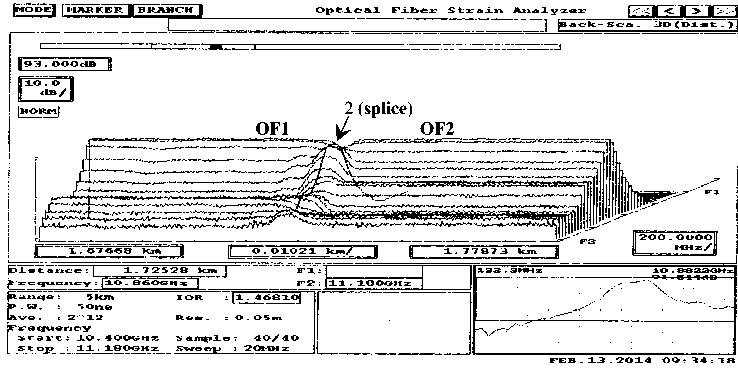
Fig. 5. 3D-graph of BS distribution along the OF length at the temperature 120 ° С
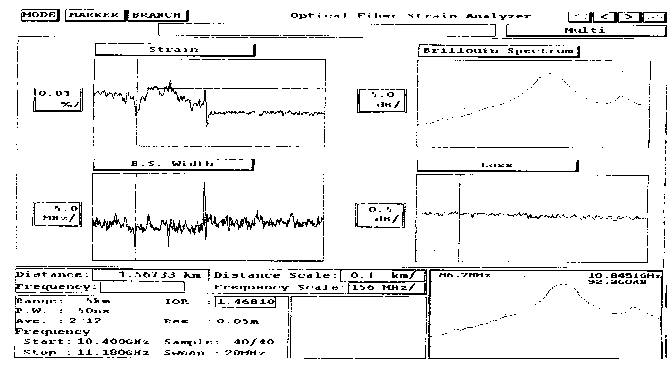
Fig. 6. OF characteristics at the room temperature (25 ° C)
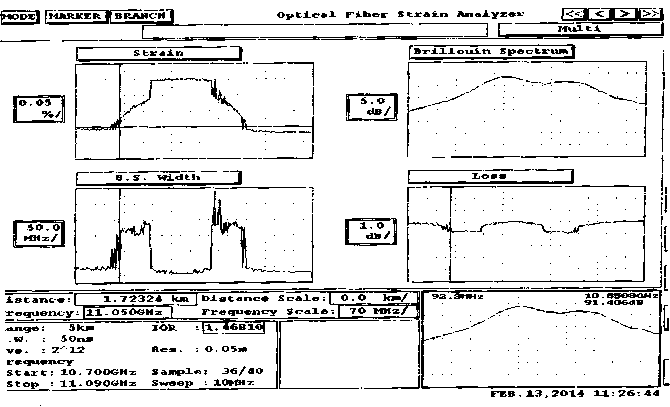
Fig. 7. OF characteristics at the temperature 120 ° С
In both graphs linear regressions of experimental data (dashed black line) are used, as expected a linear functional dependence on temperature [2, 4].
Thereby, BOR successfully detected problem section and allowed to detect Young’s modulus (strain characteristics) and OF temperature changes. This effect can be used for creating distributed temperature sensors based on OF with elastic protective cover.
In the 3rd experiment the fiber is composed of OF normalized reel (1 – OF1) (length is 1.73 km) spliced with optical fiber (3 – OF2) (length is 3 km) in the third experiment. The spliced section marked by arrow 2, and the maximum of BS – arrow 4. Both are single-mode optical fibers.
At a distance of 2 m from the splice was formed the place on which hung weights from 20 g to 500 g.
The reels were arranged so that the tensile force acts on OF only in the transverse direction.
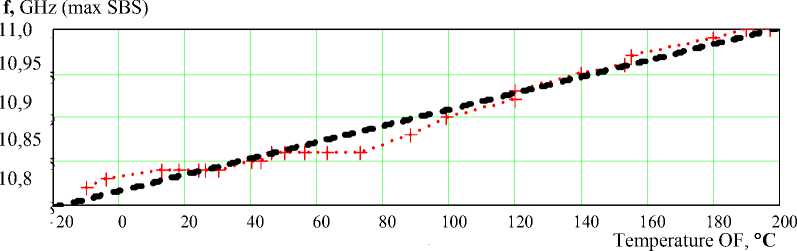
Fig. 8. Experimental data of temperature dependence of the BS maximum in OF heating section
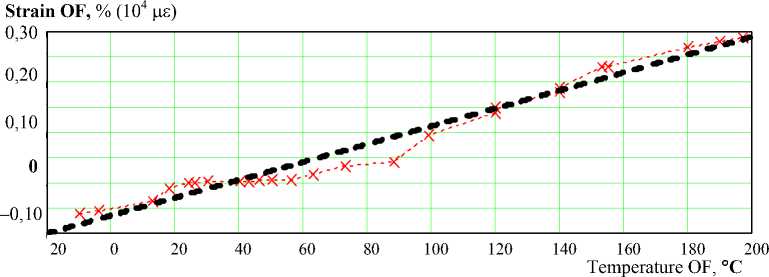
Fig. 9. Experimental data of temperature dependence of the strain ratio in OF heating section
When the transverse load starts at 0.2 N the BS changes in influence area began observed as shown in Fig. 10.
With further transverse load increasing when only at 0.5 N there are substantial BS changes the graphics begins resemble a break of OF. With further load increasing significant 3D-graph changes in the BS are not observed.
This effect can be explained by the fall of the reflected signal power because such transverse loads give rise to significant bending of OF, whereby the ray propagation path, and hence the reflection index is changed.
The strain distribution pattern in the fiber allow to fix the problem section (the pressure place), but do not show significant strain changes in this area.
Thus, in this case capable of BOR detect an problem area, but will not during normal assay procedure tension rate with high accuracy.
In the 4th experiment the study of transverse cracking stresses on the characteristics of the OF and BS obtained in BOR was carried out.
The fiber in this experiment was formed similarly to the 3rd experiment, but on the second-round OF (OF2), which was laid on a solid non-foldaway surface, installed massive loads with known weights from 2 kg to 21 kg.
Increasing cracking loads from 0 to 210 N significant BS changes weren’t observed.
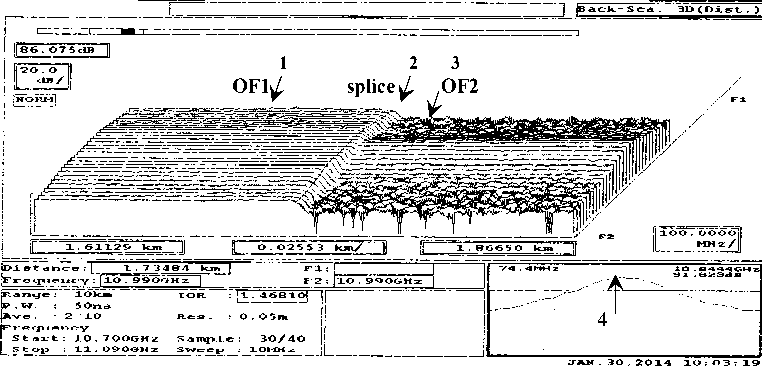
Fig. 10. 3D-graph BS distribution function along the OF with transverse force 0.2 N
Only increasing pressures in 20 times with transverse compressive load of 210 N (due to the applied load area changes of OF2) BS picture has significantly changed and began to resemble the picture at the break of OF.
However when removing the load in this extreme case, turned out that OF collapsed («crumbled») in place of influence.
Analysis of the experiment results showed that BS in OF practically unchanged with transverse crushing loads up to the levels that lead to the destruction of OF.
In the 5th experiment the BS in DSF is researched.
In this case the fiber is composed of OF normalized reel (length is 1.73 km) spliced with DSF (length is 2 km). Both are single-mode optical fibers.
The spliced section is clearly seen by the sharp change in the distribution of BS.
Fig. 11 presents the 3D-graphic which shows the distribution of BS along the fiber length with longitudinal force in 5 N is applied to the OF 2.
In Fig. 11 we can see that the BS-graphics in OF 2 (DSF) instead of the usual pronounced «hump» on the characteristic has 3 «humps», separated by two minimums. In this case the reflected from the OF 2 wave with shifted spectrum entered the OF 1 and led to the distortion of the spectrum on a small section OF 1, adjacent to the splice-place.
Typically for BS analysis and for the definition of the strain in OF the first «hump» is analyzed, although in DSF the redistribution of the spectrum clearly observed, similar to four-wave mixing phenomenon.
Fig. 12 shows the corresponding dependences (multi-graphs) along the length of the fiber strain (Strain), BS, the width of BS (BSW) and losses (Loss) with load of 5 N on OF 2. The multi-graphs on Fig. 12 obtained by assess of the first maximum of BS.
The graph analysis shows that the strain assesses differed two times, while the presence of a tensile force is not detected.
Interpenetration of BS fibers into each other at the spliced section led to significant distortions in the results.
First, OF 2 (DSF) from the measurements was «compressed» (negative strain) right up to 0.75 %, although there were not any prerequisites for this (for example, cooling to the temperatures of the order of – 50 °C).
Secondly, OB1 was also little compressed, although in the experiments in the same time and at the same temperature splicing with conventional «compression» OF it is not observed.
Third, in the usual computations algorithm based on BS analysis the longitudinal tensile load of 5 N on OF was not detected.
-
V. CONCLUSION
The results confirmed the possibility of detection mechanical stressed sections and assess the strain of OF based on BS analysis for tensile loads.
The experiments results confirmed the possibility of estimating temperature change of OF (the strain ratio of OF) based on analysis of BS.
The results analysis confirmed the possibility of estimating mechanically stressed sections and assess the tautness of OF based on BS analysis for various mechanical loads.
However, if the manifestation of transverse stresses on the spanned OF is found by BOR, what means that «problem» section of FOL can be detected, fixing the positions of OF in the transverse plane of the significant OF changes in BS is not detected even at strong transverse mechanical stresses until the limit is reached, at which the integrity of the structure of OF is broken.
The analysis of the experimental results showed that in DSF BS has obvious differences from conventional single mode OF and usual algorithm of detection of the strain characteristics («problem» sections) in this case gives unreliable results.
The correction of the strain computations algorithm should be created considering the redistribution of spectral components obtained by BOR, similar to four-wave mixing (FWM) phenomenon.
Connecting the DSF with other types of OF should be taken into consideration that BS of fibers penetrate into each other, causing significant distortion of the results of measurements and calculations, so it is necessary to measure the characteristics of OF spending as far as possible from the junction.
The authors would like to thank employees of «Moskabel–Fujikura» for the help in carrying out these experiments.
-
[1] Bogachkov I.V., Ovchinnikov S.V., Gorlov N.I. // IEEE 2012 11th International Conference on APEIE Proceedings. V. 1. P. 60–62. IEEE Catalog Number CFP12471-PRT.
-
[2] Bogachkov I.V., Gorlov N.I. // IEEE 2014 12th International Conference on Actual Problems of Electronic Instrument Engineering Proceedings. V. 1. P. 223–227. ISBN 978-5-7782-2506-0. IEEE Catalog Number CFP14471-PRT.
-
[3] Bogachkov I.V., Gorlov N.I . Components of fiber optic communication systems and methods of their parameters control: monograph. Omsk: Publishing house OmSTU, 2013. 192 p. (In Russian)
-
[4] Bogachkov I.V., Ovchinnikov S.V., Gorlov N.I., Sitnov N.J. // Telecommunications. 2014. № 2. Pp. 16–20. (In Russian)
-
[5] Listvin A.V., Listvin V.N. Reflectometry of optical fiber communications. M.: LESARart, 2005. 208 p. (In Russian)
-
[6] Bogachkov I.V., Gorlov N.I. // The Omsk scientific bulletin. 2009. № 1 (77). P. 195–198. (In Russian)
-
[7] Maistrenko V.A., Maistrenko V.V. // Journal of Siberian Federal University. Engineering & Technologies. 2014. (7). № 6. 636–640.
References Search of mechanical stressed sections in fiber optical communication lines based on Brillouin backscattering spectrum analysis
- Bogachkov I.V., Ovchinnikov S.V., Gorlov N.I.//IEEE 2012 11th International Conference on APEIE Proceedings. V. 1. P. 60-62. IEEE Catalog Number CFP12471-PRT.
- Bogachkov I.V., Gorlov N.I.//IEEE 2014 12th International Conference on Actual Problems of Electronic Instrument Engineering Proceedings. V. 1. P. 223-227. ISBN 978-5-7782-2506-0. IEEE Catalog Number CFP14471-PRT.
- Bogachkov I.V., Gorlov N.I. Components of fi ber optic communication systems and methods of their parameters control: monograph. Omsk: Publishing house OmSTU, 2013. 192 p.
- Bogachkov I.V., Ovchinnikov S.V., Gorlov N.I., Sitnov N.J.//Telecommunications. 2014. № 2. Pp. 16-20.
- Listvin A.V., Listvin V.N. Reflectometry of optical fiber communications. M.: LESARart, 2005. 208 p.
- Bogachkov I.V., Gorlov N.I.//The Omsk scientific bulletin. 2009. № 1 (77). P. 195-198.
- Maistrenko V.A., Maistrenko V.V.//Journal of Siberian Federal University. Engineering & Technologies. 2014. (7). № 6. 636-640.
