Segment-wise Quality Evaluation for Identification of Face Spoofing

Author: Akhilesh Kumar Pandey, Rajoo Pandey
Journal: International Journal of Image, Graphics and Signal Processing @ijigsp
Article in issue: 1 vol.12, 2020.
Free access
Non-intrusive nature of the face-based recognition technology makes it more popular among hand held devices. Spoof detection in face-based recognition systems has been an important topic of the research in the last decade. Among several techniques available in the literature for liveness detection, image quality measure (IQM) based technique are particularly attractive due to their computational efficiency. In this paper, an approach based on segment-wise computation of image quality measures is proposed to improve the accuracy of detection. Two types of the non-overlapping segments are considered here: 1) rectangular segments of identical sizes, 2) segment based on neighborhood variance. It is found that both approaches exhibit better performance in comparison with other techniques without increasing too much computational complexity. The experiments are carried out with well-known Replay-Attack database to prove its robustness under different conditions.
Image Quality Measures, Segmentation, face-antispoofing
Short address: https://sciup.org/15017063
IDR: 15017063 | DOI: 10.5815/ijigsp.2020.01.04
Text of the scientific article Segment-wise Quality Evaluation for Identification of Face Spoofing
Published Online February 2020 in MECS
In the modern age, the technology has become an essential part of the life. In the era of laptops, tabs, and smart phones, people keep the sensitive information in their personal devices, which generally employs electronic locks such as number combination or pattern recognition to secure the informative data [1]. With the availability of ample power of computation, hacking of the devices poses a serious threat [2]. Therefore, to overcome these threats, the device-makers are compelled to make the devices with better security features [3]. The biometric authentication mechanisms are considered to be very effective for this purpose. The biometric authentication mechanisms mainly involve fingerprint and iris recognition as they tend to be almost invulnerable. These methods, however, require additional sensors along with the user cooperation. The non-intrusive behavior of face recognition based biometric authentication system has recently drawn the attention of the research community towards it [4]. It can be noted that, now-a-days, many smart phones employ face recognition systems to provide sound security to the personal information.
Moving towards better security does not resolve the problem completely as the eavesdroppers have found new ways of spoofing the biometric systems [5-7]. Here, spoofing implies presenting a replica of an authentic biometric trait to the sensor to dodge the system. Generally, with the silica gel, copy of the fingerprint is created, whereas face-based recognition systems are spoofed by using recaptured images [5]. This paper focuses on the detection of the liveness of the samples acquired from camera without using any other information of the liveness.
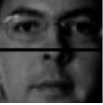
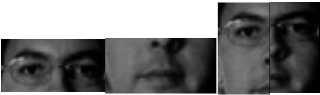
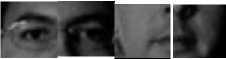
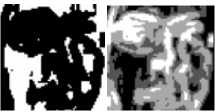
Fig. 1 presents some samples of real and fake (recaptured) images from Replay-Attack database, which are captured under different luminance conditions. It can be observed that the images in these samples have different quality due to different luminance conditions (different luminance intensity, source angle, and resulting reflection). Thus this change in image quality caused by variation in luminance conditions is used as a basis for detection of liveness of face images.
The paper is organized as follows. In section II, the related literature is discussed which is followed by the proposed methodology in section III. The results and comparisons with other techniques are presented in section IV and conclusion and scope for future work is discussed in section V.
-
II. Related Work
The spoof detection has been part of the research for years in fingerprint-based systems [6], and has become popular in face-based systems in this decade [7]. The importance of the spoof detection has been highlighted by several studies [11-13]. The spoofing in the face-based recognition systems is done primarily by presenting before the camera either the printed photo of the authentic person or the video. It is easier to detect the print-spoof with the techniques that employ motion estimation; however, these techniques are not equally effective against video replay attack. There are several antispoofing techniques available in the literature. In [8], eyeblinks are effectively detected by graphic framework and employed to discriminate between the photo and the real face. Bharadwaj et al [9] detected the lip movement along with the head rotation to discriminate between real and recaptured faces. Although, these methods are quite effective, however, need users’ cooperation and are computationally expensive. In [10], the authors presented a Replay-Attack database with the technique, which is based on LBP (Local Binary Pattern).
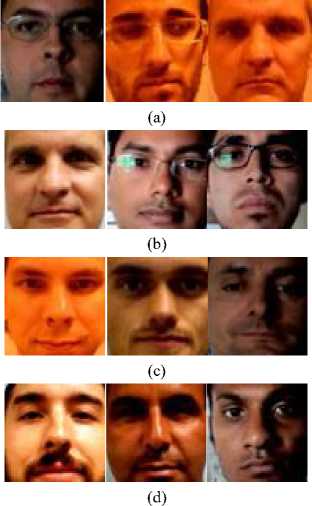
Fig. 1. Different face images from Replay-Attack database under different illumination conditions; (a) Real training samples, (b) Attack training samples, (c) Real test samples, and (d) Attack test samples
It is well known that the quality of the image will always differ from its replica. On the same hypothesis, Marcel et al [11] presented a novel approach that computes the image quality in terms of different quality measures and uses LDA (Local Discriminant Analysis) for the classification. In [12], two additional measures are introduced to make the discrimination more effective. The frequency domain analysis is also done to measure different amount of noise present in the image as they possess different amount of high and low frequency components [13]. This paper is based on the evaluation of the quality of the input image through different image quality measures (IQMs) to differentiate the real and recaptured face images and employs SVM (support vector machine) in the classification process. The focus of our work is to reduce overall computational cost of the system as the quality evaluation is done with the help of just a few frames instead of a long video sequence. Motivation behind this work can be summarized in following points:
-
1. Reduction of overall computational cost would lead to enhanced battery life of hand held devices that includes phones, tabs, etc.
-
2. The spoof detection technique should ensure that the performance of the system is maintained at satisfactory level without any additional power consumption.
-
3. Considering a reduced size image for computation of quality measures facilitates reduction in computational complexity.
-
III. Proposed Work
As described earlier, the paper attempts to efficiently use the IQMs and, hence, induces higher discrimination ability in the feature vectors. Fig. 2 shows the basic model of the proposed work. This approach involves three types of feature vectors that have 10, 20 and 40 dimensions at one time. The IQMs used in the present work to construct a feature vector are presented in the next subsection.

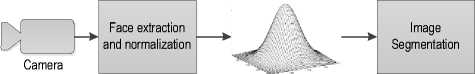
Gaussian filter
Image quality assessment
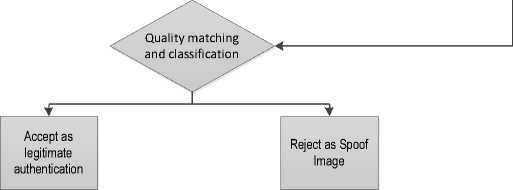
Fig. 2. Basic flow of the proposed work
-
A. Image Quality Measures
Let, I be an input image having size MxN, which is passed through a Gaussian filter to create the distorted version of this image I. Now, the quality measure is computed by treatingl as the reference image. The most popular way to evaluate the signal quality is by its SNR (Signal to Noise Ratio). The SNR is defined with the use of MSE (Mean Square Error), which is computed by equation (1). In image processing, the PSNR (Peak Signal to Noise Ratio) is used to describe the quality of the image, which is defined by equation (3). The Gaussian blur affects the edges most and leads to structural dissimilarity. In order to utilize this information, the GME (Gradient Magnitude Error), GPE (Gradient Phase Error), and SC (Structural Content) are also considered here and defined by equation (4), (5), & (6) respectively. As mentioned in [13], the real and recaptured images have different levels of high and low frequency components, hence, the difference is observed in the form of SME (Spectral Magnitude Error) and SPE (Spectral Phase Error) defined by equations (7), and (8), respectively. The effect of blurring under cosine domain is captured by equation (9).
i i = M j = N
MSE = wv EE (I, Ii,j)2(1)
MN 1=1 j=1’
1 i=M j=N
SNR =-У V — MN 1=1tl MSE
. Г 255 PSNR = 20 log.
IV MSE i=Mj = N
EE ( j
-
= i = 1 j = 1 __________
SC i = Mj = N/. X2
EE (4
i = 1 J = 1
1 i=Mj=N/, , ।|\2
GME =---У У G,, - Gi,j ) MN 1=1 tlV i’j|
-
1 i=M j=Ni ,.i
GPE=MN EEarg (Gj)-arg(Gi-j)
i=M j=Ni\2
SME =--УЖ -F,J)(7)
MN E E ( ' , j I I ' j I/
-
1 i=M J=NI ,.
SPE=t^EE arg(Fi,j-)-arg(F )
MN i = 1 j = 11
1 i=Mj=N , .
DCD = T^EE( C',j — Ci,j )
MN^-1, where, Ct j and Fifj, Ct,j and Ft,j are cosine and Fourier coefficients of 2D cosine and Fourier transform of I and /, respectively. The gradient G is first computedfrom image I by computing the gradients in horizontal and vertical directions, denoted by Gh, and GP, respectively. Then the gradient G is defined as G = Gh + iGv. The similar process is followed for I. | Gt j | denotes the magnitude of G at location (i, j). The last parameter, SSIM, as described in [14], which is one of the most widely used parameter in image processing, is defined by equation (10), where ц and a2 are the mean and the variance of the image, and C1 and C2 are constants.
SSIM =
( 2 ^ i M i + c i )( 2 ^ i ^ i + C2 )
( F i + F I + c i )( ^ i 2 + ° 11 + C 2 )
-
B. The Segmentation
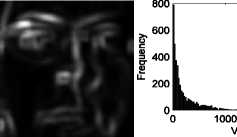
The above-mentioned quality measures are computed to form feature vector of dimension 10. The segmentation is done in two ways. First, the image is divided in nonoverlapping rectangular segments of identical sizes, named as Type-A. In the second method, named as Type-B, a group of disjoint segments of varying shape and size, is obtained on the basis of local variance. These disjoint segments are formed on the basis of variance of pixel in a predefined neighborhood. Fig. 3 illustrates these segmentation schemes. The Type-A segmentation is considered to incorporate the behavior of the light source under which the image is captured as the reflection plays an important role in the image quality. The second type of the segmentation is included because different parts of the face image carry different types of information such as edges, smoothness, corners, or the texture information which manifests in terms of change in local variance. Under Type-A segmentation, image is divided in two equal parts, horizontally and vertically, denoted as Type-AH and Type-AV, respectively. When the image is divided in four equal parts, the partitioning scheme is termed as Type-AF. Type-B segmentation is further classified as Type-B1 and Type-B2, which has two and four groups of segments, respectively. When the image is partitioned in two parts and four parts, the feature extraction process yields a feature vector of dimension 20 and 40, respectively. The Type-B1 and Type-B2 are divided according to the rule presented in equation (11) and (12), respectively.
Let, vt j- be the variance of a neighborhood of size 5x5, centered at pixel pt j , of the image I . The pixels are then grouped as:
Рме 5
Group1 vid < v2
Group2 vtj > v2
pi , j
е <
Group 1
Group 2
Group 3
Group 4
vy < v i v 1 ^ vy < v 2 v 2 ^ vy < v 3 vy ^ v 3
Here, 17 1 , 17 2 , and v3 are the threshold values of variance used to segment the image variance-wise. The values of these thresholds are made adaptive according to the variance of the image. The values {v 1 ,v2,v3} are in ascending order and given by equation (13)
v 1
v 2
v 3
MN
(a)
(b)
(c)
(d)
(e)
(f)
Fig. 3. The process of segmentation; (a) Original Image, (b) Division of image in different regions, (c) Type-AH and Type-AV segmented parts (d) Type-AF segmented parts, (e) variance image and the histogram, and (f) Type-B1 and Type-B2 segmented parts where, l^ = max^^v). Using the above equations (11) and (12), different binary maps are formed. For example, if Pi j £ Groupl, the location (i, j) is assigned a value 1 and rest of the pixels locations have zeroes. Similarly, if Pij £ Group2, the pixel value at corresponding location (i, j) is set equal to 1, whereas other locations are assigned values 0. In similar manner, two binary maps for equation (11) and four binary maps for equation (12) are formed. These maps are then elementwise multiplied with the image under consideration to create a new image for subsequent processing. Figure (3) depicts the entire process of segmentation. For the computation of the IQMs in the case of such processed images, the multiplier 1 is used rather than —, where, К is the total
-
1 к MN number of one’s in the respective map.
-
C. Formation of Training Set
As mentioned in above section, the training sets are separately formed for both types of segmentation. Accordingly, there are training sets of feature length 20 and 40 as shown in Table-I. As the training set plays an important role in machine learning, therefore, mixing of true and fake samples becomes important to ensure a reliable performance of the classifier. In order to make the classifier efficient, a study is presented here, which explores the role of the probability at which a true sample is present in the training set. Results of the study are presented in Table II and Table III. It can be observed from from these results that more the true samples in the training data, greater is the possibility of recognition of a spoof sample as true one. Similarly, lesser number of true samples in the training data leads to a higher rejection of true samples. Therefore, it is important to have sufficient samples (true and spoof) to achieve a reasonable true recognition ratio and with a minimal false acceptance rate.
For each of the above-mentioned groups, all previously defined measures are computed and concatenated to make the feature vectors of size 20, and 40, to form training sets for various groups. After building the feature vector, the SVM is applied to make the final decision about the liveness of the image. The performance is observed in terms of TRR (True Recognition Rate), FAR (False Acceptance Rate), and HTER (Half of Total Error Rate), that signify the number of samples that includes accepted recaptured samples and rejected true samples by the classifier.
-
IV. Experimental Results
The proposed work is simulated in the Matlab 2013a environment on a system having core i5 processor with 4GB RAM.
-
A. Simulation Prerequisites
The experiment is carried out with the Replay-Attack database that has 1300 video clips defined under four main groups - Train, Test, Enroll and Devel, used for training, testing, evaluating, and defining thresholds for the classifier, respectively. The analysis of the video is done on the basis of a single frame i.e. each frame is treated as a new entity. To ensure the reliability of the results, 10,000 random frames are considered in testing while 300 frames are taken to train the classifier. The model presented here doesn’t emphasize the attack type such as print media, low quality, and high-quality video;
rather the results are accumulated from all the groups that are defined by the database. The frames, used in the experiment, are first cropped according to the face information given in the database, and then, facial part is resized to 64 X 64. The rest of the processing is done only with these dimensions. The neighborhood size, used to compute the local variance, is taken as 5x5 . The values of C 1 and C 2 , used in evaluating SSIM, are kept same and equal to 0.5.
Table 1. Different type of segmentaion and the length of the feature vector
|
Sr. |
Segmentation Type |
Length of the feature vector |
|
1. |
Type-AH |
20 |
|
2. |
Type-AV |
20 |
|
3. |
Type-B1 |
20 |
|
4. |
Type-AF |
40 |
|
5. |
Type-B2 |
40 |
Table 2. True recognition rate for different feature sets under different probabilities of the true input being present in the training set.
|
Training |
Testing |
|||||||||
|
Type |
AH |
AV |
AF |
B1 |
B2 |
AH |
AV |
AF |
B1 |
B2 |
|
P t |
||||||||||
|
0.01 |
42.92 |
39.01 |
33.85 |
37.92 |
32.96 |
48.23 |
50.93 |
45.1 |
47.34 |
44.33 |
|
0.05 |
76.52 |
76.08 |
69.64 |
75.98 |
69.69 |
76.38 |
79.31 |
71.78 |
75.01 |
72.49 |
|
0.1 |
81.86 |
86.64 |
83.29 |
87.42 |
86.78 |
78.85 |
84.41 |
79.92 |
82.06 |
84.12 |
|
0.2 |
90.12 |
89.44 |
87.13 |
88.41 |
91.99 |
83.95 |
85.81 |
80.58 |
83.8 |
86.61 |
|
0.25 |
90.55 |
89.31 |
90.23 |
89.13 |
93.07 |
84.1 |
86.54 |
82.29 |
84.63 |
87.65 |
|
0.3 |
90.57 |
90.15 |
91.48 |
89.92 |
92.53 |
83.97 |
86.83 |
82.35 |
84.95 |
87.81 |
|
0.4 |
90.98 |
90.58 |
92.48 |
90.95 |
92.7 |
84.36 |
86.41 |
83.33 |
86.16 |
87.67 |
|
0.5 |
90.23 |
90.47 |
92.13 |
90.77 |
92.8 |
83.98 |
85.41 |
83.16 |
86.42 |
87.82 |
|
0.6 |
89.94 |
90.04 |
92.5 |
89.96 |
92.1 |
83.86 |
85.58 |
84.18 |
85.81 |
86.76 |
|
0.7 |
89.97 |
90.23 |
91.88 |
90.35 |
91.73 |
83.15 |
85.52 |
83.84 |
85.4 |
86.43 |
|
0.75 |
90.32 |
89.45 |
91.21 |
90.58 |
90.55 |
82.79 |
85.58 |
84.08 |
84.57 |
85.64 |
|
0.8 |
89.68 |
88.3 |
90.35 |
89.7 |
90.48 |
80.75 |
84.35 |
82.97 |
83.66 |
84.08 |
|
0.9 |
88.1 |
87.06 |
88.24 |
87.13 |
88.56 |
80.62 |
81.02 |
81.88 |
80.77 |
81.86 |
|
0.95 |
82.93 |
83.13 |
83.77 |
81.58 |
82.82 |
71.08 |
77.01 |
78.77 |
75.86 |
75.96 |
|
0.99 |
62.58 |
68.84 |
69.08 |
66.13 |
66.54 |
45.33 |
49.2 |
51.98 |
48.77 |
49.08 |
Table 3. False acceptance rate for different feature sets under different probabilities of the true input being present in the training set.
|
Training |
Testing |
|||||||||
|
Type |
AH |
AV |
AF |
B1 |
B2 |
AH |
AV |
AF |
B1 |
B2 |
|
P t |
||||||||||
|
0.01 |
0.84 |
0.28 |
0.15 |
0.74 |
0.32 |
1.22 |
0.75 |
0.48 |
1.10 |
0.36 |
|
0.05 |
2.61 |
1.49 |
0.72 |
3.23 |
1.22 |
3.97 |
2.46 |
1.72 |
4.43 |
1.39 |
|
0.1 |
4.51 |
3.68 |
1.70 |
6.14 |
2.16 |
7.13 |
5.17 |
3.3 |
8.33 |
2.89 |
|
0.2 |
5.32 |
5.04 |
2.90 |
6.66 |
2.5 |
8.83 |
7.07 |
4.84 |
8.76 |
3.88 |
|
0.25 |
5.78 |
5.15 |
3.96 |
6.15 |
3 |
9.50 |
6.87 |
6.19 |
7.00 |
4.24 |
|
0.3 |
6.14 |
5.69 |
3.91 |
5.51 |
3.29 |
9.34 |
7.11 |
6.17 |
5.89 |
4.49 |
|
0.4 |
5.63 |
6.00 |
3.88 |
4.78 |
3.41 |
9.09 |
7.84 |
6.88 |
5.92 |
4.81 |
|
0.5 |
6.62 |
6.81 |
4.43 |
4.81 |
4.27 |
9.91 |
8.8 |
7.29 |
6.54 |
5.57 |
|
0.6 |
6.98 |
7.06 |
5.33 |
5.97 |
5.42 |
10.63 |
9.03 |
7.97 |
7.52 |
6.47 |
|
0.7 |
6.61 |
6.71 |
5.74 |
6.07 |
6.34 |
10.53 |
8.68 |
8.13 |
6.84 |
6.85 |
|
0.75 |
6.93 |
6.87 |
6.56 |
5.53 |
7.82 |
10.97 |
7.94 |
7.92 |
5.92 |
8.16 |
|
0.8 |
7.19 |
8.33 |
7.39 |
6.39 |
8.29 |
11.46 |
8.97 |
7.72 |
7.39 |
9.48 |
|
0.9 |
8.77 |
10.64 |
10.19 |
10.01 |
10.57 |
13.37 |
11.58 |
10.51 |
11.42 |
12.93 |
|
0.95 |
15.13 |
14.59 |
15.51 |
17.3 |
16.94 |
18.47 |
16.47 |
15.41 |
18.56 |
19.09 |
|
0.99 |
34.28 |
27.48 |
28.11 |
30.93 |
30.8 |
34.51 |
29.58 |
27.73 |
31.92 |
32.29 |
Table 4. The table presents the hters with corresponding feature vector length for different conventional methods along with the proposed methodo for all groups on the grandtest set of the replay-attack database
|
Sr. |
Method |
Length of the feature vector |
HTER (%) |
|
1. |
LBP-based [10] |
59 |
15.2 |
|
2. |
LBP-based [19] |
59 |
13.9 |
|
3. |
IQA-LDA based [18] |
25 |
36.8 |
|
4. |
Radon-transform based [20] |
180 |
8.5 |
|
5. |
IQA-BOB based [11] |
14 |
15.2 |
|
6. |
Motion-based SVM [25] |
128 |
17.2 |
|
7. |
IQA-SVM |
10 |
11.3 |
|
8. |
Type-AH |
20 |
10.5 |
|
9. |
Type-AV |
20 |
9.5 |
|
10. |
Type-B1 |
20 |
10.0 |
|
11. |
Type-AF |
40 |
8.8 |
|
12. |
Type-B2 |
40 |
8.2 |

ею
50 С О)
Probability (pT)
(a)
60 0> ею
50 с 0>

0.01 0.05 0.1 0.2 0.25 0.3 0.4 0.5 0.6 0.7 0.75 0.8 0.9 0.95 0.99
Probability (pT)
(b)
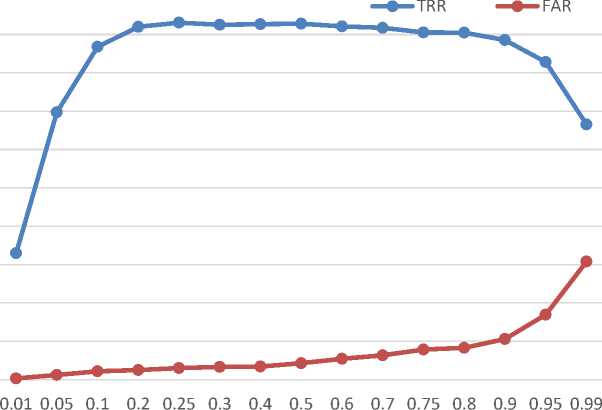
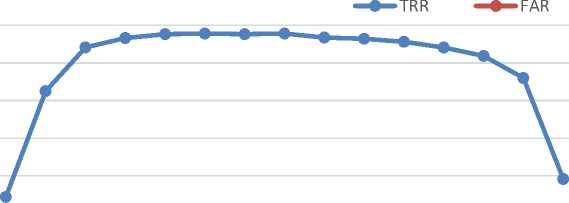
Fig. 4. False acceptance rate and true recognition rate vs the probability p T of pressence of true samples in the training data. (a) Training scenario, and (b) Testing scenario
-
B. Effect of training set on classification
In this section, a comparison of values of false acceptance rate (which is required to be minimum) is presented by computing them for different probabilities of true samples being present in the training set. Typically, a classifier will be biased towards the class, which appears more frequently during the training. Therefore, if the probability of true sample will increase in the training set, the false acceptance rate increases. As given in above section, only 300 frames, consisting of true and fake samples, are used to train the classifier, therefore, to form the training set, true samples are selected with probability pT. In Figure 4, the FAR is plotted against the probability of true sample in the training set. Inclusion of more true inputs in the training set leads to increase the FAR significantly, which can be easily interpreted from the figure. In the similar manner, lower the number of true samples in the training set, higher will be the true rejection ratio. The prime requirement of the face antispoofing is to reduce the FAR yet maintaining a good TRR. In the same figure, the FAR and TRR are plotted for different values of pT . From this figure, it is easily seen that keeping pT between 0.25 to 0.75, produces the TRR approximately same. However, for higher pT, FAR also increased. FAR is seen to increase from 4.24% to 8.16% when 0.25 < pT< 0.75. Therefore, in order to ensure an FAR below 5%, the pT must be kept below 0.5. Table II and table III show different values of TRR and FAR, respectively, for different values of probability pT.
-
C. Comparison with other techniques
The results of the experiments performed for comparison of various methods are presented in Table IV. It is shown that with the SVM, this image quality-based method outperforms the other methods. It is further noticed that the LBP-based method produces 15.2% HTER with the feature vector of dimension 59, whereas the proposed work yields HTER of 8.2% and 8.8% with the reduced feature vector length i.e. 40, for the group Type-AF, and Type-B2, respectively. It is also concluded from this table, that although the radon transform based anti-spoofing method has similar error rates as that of the proposed work, but it requires a very high dimensional feature vector i.e. 180, implying a significant increase in the complexity. Whereas in the present approach the groups Type-AH, Type-AV, and Type-B1 yield approximately 10% HTER with feature dimension 20. The improvement in the performance of the proposed method is attributed to the segment-wise computation of image quality measures which can effectively capture the variation caused by the luminance conditions affecting different parts of the image in different manners. This brings out the difference between real and fake image ore clearly even with limited number of frames taken from the video maintaining low complexity.
-
V. Conclusion and Future Scope
The paper presents a simple and effective technique to distinguish between real and recaptured face images. The novelty of the proposed work liesit its computational efficiency as the size of the image is small, in comparison to other state-of-the-art methods, and only basic mathematical operations have to be performed to implement this method. From the experiments, it can be seen that the proposed work not only provides a computationally efficient mechanism to discriminate between real and recaptured face images, but also enhances the performance of the system in terms of HTER. The total error rate is improved by almost 10% with the existing systems that are based on LBP and quality evaluation. The main findings of the work lead to the conclusion that1) image quality is a powerful tool in this scenario, 2) the quality of the images vary from region-to-region, and 3) employing quality measures to different regions separately enhances the performance and, therefore, studying this problem and carrying out further investigations from this new perspective holds a lot of promise. For example, selection of IQMs on the basis of the region characteristic and inclusion of some new image quality measures may be explored to realize an efficient, robust and economic system.
References Segment-wise Quality Evaluation for Identification of Face Spoofing
- H. A. Shabeer and P. Suganthi, "Mobile phones security using biometrics," in Conference on Computational Intelligence and Multimedia Applications, 2007. International Conference on, 2007.
- B. Schneier, "Biometrics: uses and abuses," Communications of the ACM, vol. 42, p. 58, 1999.
- N. Leavitt, "Mobile phones: the next frontier for hackers?," Computer, vol. 38, pp. 20-23, 2005.
- A. K. Jain, K. Nandakumar and A. Nagar, "Biometric template security," EURASIP Journal on Advances in Signal Processing, vol. 2008, p. 113, 2008.
- K. Singh, S. Sharma and R. K. Garg, "Visualization of latent fingerprints using silica gel G: a new technique," Egyptian Journal of Forensic Sciences, vol. 3, pp. 20-25, 2013.
- E. Marasco and A. Ross, "A survey on antispoofing schemes for fingerprint recognition systems," ACM Computing Surveys (CSUR), vol. 47, p. 28, 2015.
- J. Galbally, S. Marcel and J. Fierrez, "Biometric antispoofing methods: A survey in face recognition," IEEE Access, vol. 2, pp. 1530-1552, 2014.
- G. Pan, L. Sun, Z. Wu and S. Lao, "Eyeblink-based anti-spoofing in face recognition from a generic webcamera," in {Computer Vision, 2007. ICCV 2007. IEEE 11th International Conference on}, 2007.
- S. Bharadwaj, T. Dhamecha, M. Vatsa and R. Singh, "Computationally efficient face spoofing detection with motion magnification," in {Proceedings of the IEEE Conference on Computer Vision and Pattern Recognition Workshops}, 2013.
- I. Chingovska, A. Anjos and S. Marcel, "On the Effectiveness of Local Binary Patterns in Face Anti-spoofing," 2012.
- J. Galbally and S. Marcel, "Face Anti-spoofing Based on General Image Quality Assessment.," in ICPR, 2014.
- A. K. Pandey and R. Pandey, "Application of Spectral Information in Identification of Real-Fake Face Images," in Proceedings of the Sixth International Conference on Computer and Communication Technology 2015, 2015.
- G. Pan, L. Sun and Z. Wu, Liveness detection for face recognition, INTECH Open Access Publisher, 2008.
- Z. Wang, A. C. Bovik, H. R. Sheikh and E. P. Simoncelli, "Image quality assessment: from error visibility to structural similarity," IEEE transactions on image processing, vol. 13, pp. 600-612, 2004.
- J. Galbally, C. McCool, J. Fierrez, S. Marcel and J. Ortega-Garcia, "On the vulnerability of face verification systems to hill-climbing attacks," Pattern Recognition, vol. 43, pp. 1027-1038, 2010.
- T. de Freitas Pereira, A. Anjos, D. a. M. J. Martino and S. Marcel, "LBP- TOP based countermeasure against face spoofing attacks," in {Computer Vision-ACCV 2012 Workshops}, 2012.
- I. Chingovska, J. Yang, Z. Lei, D. Yi, S. Z. Li, O. Kahm, C. Glaser, N. Damer, A. Kuijper, A. Nouak and others, "The 2nd competition on counter measures to 2D face spoofing attacks," in {Biometrics (ICB), 2013 International Conference on}, 2013.
- J. Galbally, S. Marcel and J. Fierrez, "Image quality assessment for fake biometric detection: Application to iris, fingerprint, and face recognition," IEEE transactions on image processing, vol. 23, pp. 710-724, 2014.
- J. Määttä, A. Hadid and M. Pietikäinen, "Face spoofing detection from single images using micro-texture analysis," in Biometrics (IJCB), 2011 international joint conference on, 2011.
- R. D. Albu, "Face anti-spoofing based on Radon transform," in Engineering of Modern Electric Systems (EMES), 2015 13th International Conference on, 2015.
- N. Ben-Asher, N. Kirschnick, H. Sieger, J. Meyer, A. Ben-Oved and S. Möller, "On the need for different security methods on mobile phones," in Proceedings of the 13th International Conference on Human Computer Interaction with Mobile Devices and Services, 2011.
- K. Cao and A. K. Jain, "Hacking mobile phones using 2D printed fingerprints," Technical Report., 2016.
- A. D. Meadows and E. Y. Du, "Spoof and vulnerability of biometric systems," Biometrics: From Fiction to Practice, p. 187, 2013.
- D. J. Ohana, L. Phillips and L. Chen, "Preventing cell phone intrusion and theft using biometrics," in Security and Privacy Workshops (SPW), 2013 IEEE, 2013.
- T. Edmunds and A. Caplier, "Edmunds, Taiamiti, and Alice Caplier. "Motion-based countermeasure against photo and video spoofing attacks in face recognition," Journal of Visual Communication and Image Representation, no. 50, pp. 314-332, 2018.
