Segmentation and Counting of WBCs and RBCs from Microscopic Blood Sample Images

Author: Lata A. Bhavnani, Udesang K. Jaliya, Mahasweta J. Joshi
Journal: International Journal of Image, Graphics and Signal Processing(IJIGSP) @ijigsp
Article in issue: 11 vol.8, 2016.
Free access
In the biomedicine field, blood cell analysis is the first step for diagnosis of many of the disease. The first test that is requested by a doctor is the CBC (Complete Blood cell Count). Microscopic image of blood stream contains three types of blood cells: Red Blood Cells (RBCs), White Blood Cells (WBCs) and platelets. Earlier counting of blood cell was done manually which was inaccurate and depends on operator's skill. Counting of blood cells using image processing provides cost effective and accurate result than manual counting. During the counting process, the splitting of clumped cell is the most challenging issue. This paper represents segmentation and counting of RBCs and WBCs from microscopic blood sample images. Segmentation is done using Otsu's thresholding and morphological operations. Counting of cells is done using geometric features of cells. RBCs contain clumped cells which make the task of counting of cells accurately very challenging. For counting of RBCs, two different methods are used: 1) Watershed segmentation 2) Circular Hough Transform. Comparison of both this method is shown for randomly selected images. The performance of counting methods is also analyzed by comparing it with results obtained by manual counts.
White Blood Cell, Red Blood Cell, Segmentation of Blood Cells, Counting of Blood Cells, Watershed Segmentation, Circular Hough Transform
Short address: https://sciup.org/15014085
IDR: 15014085
Text of the scientific article Segmentation and Counting of WBCs and RBCs from Microscopic Blood Sample Images
Published Online November 2016 in MECS
Complete Blood cell Count (CBC) is the first test suggested by doctors to the patient for detecting any abnormalities. Blood cells are divided into three types: 1) White Blood Cells or leukocytes, 2) Red Blood Cells or erythrocytes, and 3) Platelets or thrombocytes. Analysis of blood cells using images can be useful to evaluate and diagnose various health conditions of the patient. Table 1 shows normal blood cell count for the male and female candidate.
WBCs are considered as immunity cells that protect from virus and bacteria attack in the human body. High
WBC count indicates disease like infection, allergy, leukemia, tissue damage etc. WBC consists of nucleus and cytoplasm. Depending on the shape of the nucleus, WBC is divided into five types: Basophil, Eosinophil, Monocyte, Lymphocyte, and Neutrophil. Red blood cells carry oxygen from lungs to various parts of the body. Low RBC count leads to anemia. High RBC counts can be the indication of serious medical conditions, such as heart, lung, or kidney disease. Platelets are the smallest fragments of all blood cells. Low platelet count indicates disease like dengue in which platelet count is continuously monitored. Abnormally high or low counts may indicate the existence of many forms of disease or infection. Blood cell counts are the most commonly performed blood tests in the field of medicine, as they can provide an overview of a patient's general health status.
Table 1. Normal blood cell count
|
Blood Cell Type |
Count ( million/microlitre) |
|
|
Male |
Female |
|
|
RBC |
4.5 to 6.0 |
4.0 to 5.0 |
|
WBC |
4.5 to 11 |
4.5 to 11 |
|
Platelet |
150 to 450 |
150 to 450 |
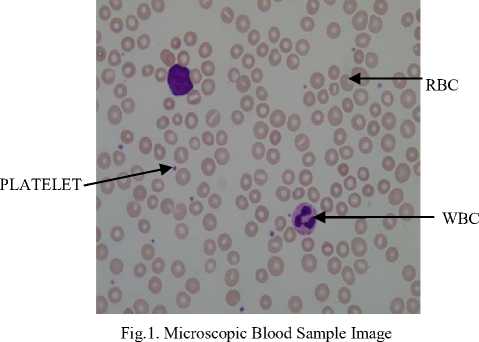
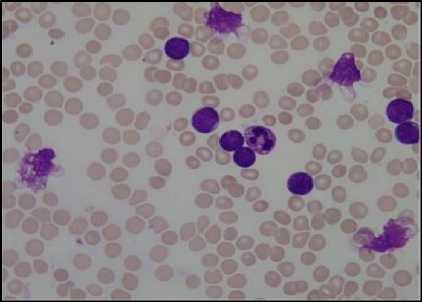
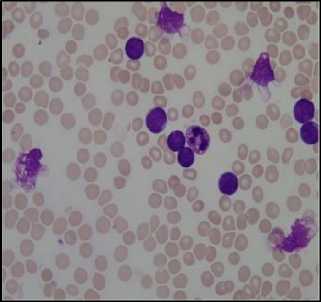
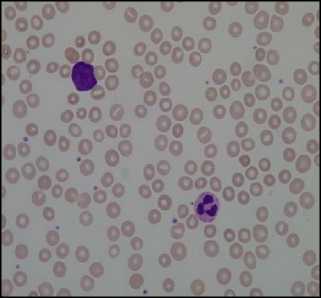
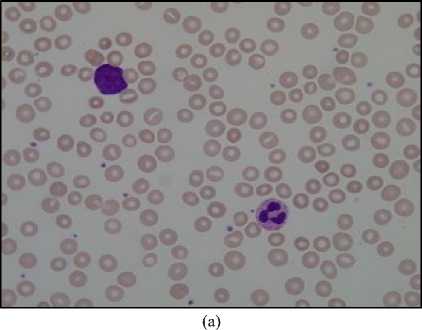
Earlier hematologists were performing microscopic examination and counting of blood cells manually, which was very time-consuming and tedious process. Also, the accuracy of counting mainly depends on their expertise skill and their physical conditions. Recently cell counter machines are being used in hematology center to perform CBC which gives faster and precise result. However, certain irregular cells in the blood may not be recognized correctly because it does not detect shapes of a cell. In the case of some diseases, morphological abnormalities of cells are not detected by cell counter hence a further manual examination of the blood smear is required. This research work provides the methodology for segmentation and counting of WBCs and RBCs from microscopic blood sample images using MATLAB R2013a. Fig. 1 shows microscopic blood sample image containing White Blood Cells, Red Blood Cells, and Platelets.
The paper is organized as following. Section II describes literature review in the area of blood cell segmentation and counting. Section III describes proposed work along with block diagram. Section IV describes counting method of RBCs and WBCs. Section V describes details of Image dataset used for experiments. Experimental results are discussed in section VI. Finally, section VII provides conclusion along with the future scope.
-
II. R elated W ork
Blood cell segmentation is the process of extracting different blood cells from microscopic blood sample image. Blood cell counting is the process which gives a number of blood cells detected after segmentation. Many researchers have implemented methods for segmentation and counting of blood cells.
Y.M. Alomari et al. [1] have developed a method for segmentation and counting of WBCs and RBCs. Segmentation is done using Otsu’s thresholding followed by morphological operations which are performed as a preprocessing before counting. Counting method is based on regular circle detection (RCD). Some modifications are done on basic RCD. It solves initialization problem of basic RCD, detects irregular circles and takes a dynamic number of iteration for an algorithm which reduces time complexity. It uses fixed thresholding value which can vary depending on the dataset. This method does not include platelets segmentation and counting.
P.Maji et al. [2] have developed a method for counting and characterizing red blood cells. They have also used morphological operations and Otsu’s thresholding for segmentation. They have discussed the problem of cells having holes which give inaccurate count. Hole filling algorithm is developed. Counting is done by counting a number of connected components. They have categorized the cells depending on shape analysis. This method does not work for cells which are highly overlapped.
J.Hari et al. [3] have used edge detection and morphological operations for segmentation. Further, for identifying different cells, they have used geometrical features. Area analysis is done for identification. To remove overlapping of cells, distance transform watershed segmentation technique is used.
S. Mazalan et al. [4] have used Circular Hough Transform (CHT) for counting red blood cells. Area of RBC is calculated using mean, standard deviation and tolerance on maximum and minimum radius of RBCs. Edge detection is used for detection of edges which is further used in CHT for cell detection. The dataset was limited to only 10 images and average accuracy was 91.87%.
K. Abuhasel et al. [5] have developed WBC segmentation method. WBC contains cytoplasm and nucleus. Nucleus segmentation is done using Modified Gram-Schmidth (MGS) method that is compared with the result of classical Gram Schmidth technique. Region growing algorithm is used for cytoplasm segmentation. Performance evaluation is done by measuring precision, false positive rate, and false negative rate. They have achieved accuracy more than 92% for lymphocyte and neutrophil types of cells.
H.Tulsani et al. [7] have presented an improved method for blood cell counting. They have used YCbCr color space model which overcomes issues of illumination. Morphological operations and thresholding are used for cell segmentation. Regional maxima and watershed segmentation are used for removing overlapping. Counting is performed using a number of connected components. Marker based segmentation solves the problem of over segmentation and regional maxima point computation eliminates the problem of overlapping.
-
III. P roposed A lgorithm
The proposed work is divided into two parts: segmentation of blood cell and counting of blood cells. Fig. 2 shows a block diagram for proposed work of segmentation and counting of blood cells.
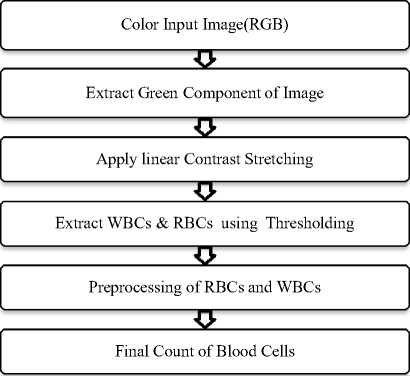
Fig.2. Proposed Block Diagram
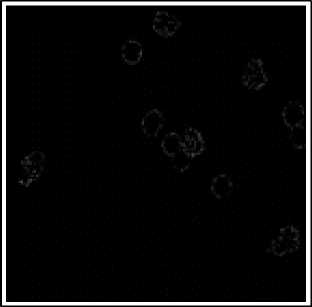
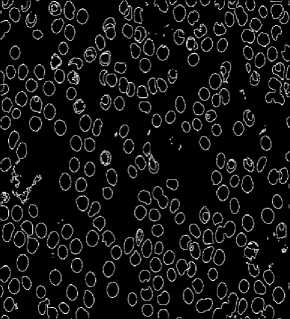
Preprocessing steps involve morphological operations like erosion, dilation, opening and closing. Edge detection is done using canny edge detection. Fig. 3 and Fig. 4 show preprocessing steps for WBCs and RBCs respectively. The last step is counting of blood cells. Here WBC counting is done by counting a number of connected components and RBC count is performed by using Watershed Segmentation and Circular Hough Transform.
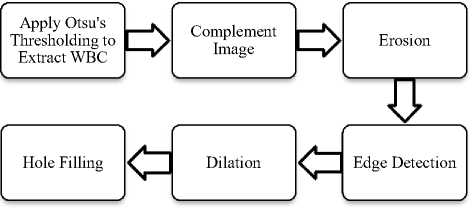
Fig.3. Preprocessing Steps for WBCs
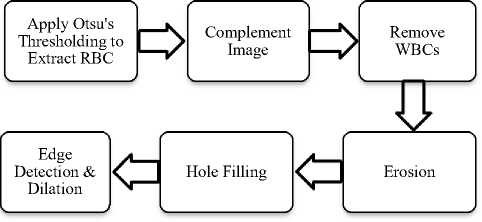
Fig.4. Preprocessing Steps for RBCs
Results of preprocessing steps for WBCs and RBCs are shown in Fig. 5, Fig. 6 and Fig. 7 respectively.
(d)
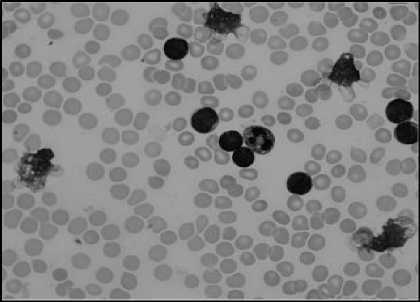
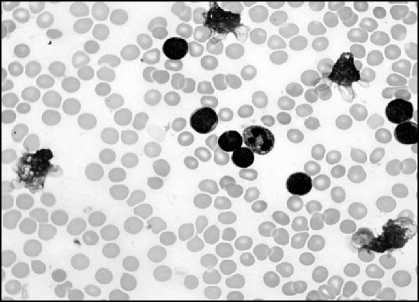
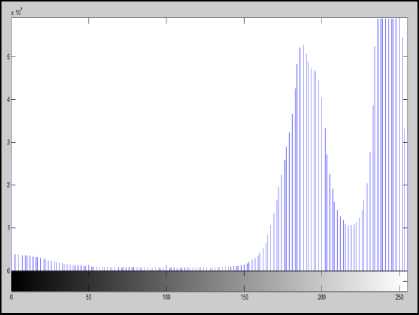
Fig.5. (a) Original Image (b)Green component of Image (c) Image after linear contrast stretching (d) Histogram to select threshold value
(a)
(b)
(c)
(d)
(e)
(f)
Fig.6. Preprocessing Steps for WBCs. (a) WBCs after thresholding (b) Complement image (c) WBCs after erosion d) Edge detection (e) Dilated gradiant mask (f) WBCs after hole filling.
(a)
(b)
(c)
(d)
(e)
(f)
-
IV. C ounting of B lood C ells
This section describes counting of WBCs and RBCs. It is the next step after segmentation. WBC counting is done using Connected label component and by considering the area of cells. RBC counting is performed using two different methods: (1) Circular Hough Transform (2) Watershed Segmentation. Both methods are described in detail here.
-
A. Counting of WBCs
Counting of WBC is done by analyzing features of WBCs. This is done by using connected label component and region selection process. Connected label component will be used to label all the different objects in the image. After that region selection from these objects is done by using Regionprops. Regionprops extract properties of an object like area, bounding box, centroid etc. Out of these different features, we have used area analysis of object to count WBCs. Average area is calculated of all the objects area. This average area is considered as a minimum size of WBC. So the objects which have a size greater or equal to this minimum size are considered as WBC for counting.
-
B. Counting of RBCs
Counting of RBCs is critical step in blood cell counting because blood cells are clumped with each other which requires separation of blood cells. Here for RBC counting, we have used two different techniques: Circular Hough Transform and Watershed segmentation.
-
i) Circular Hough Transform
The shape of red blood cell is almost circular. Circular Hough Transform is a well-known method which is used to detect circles in the image. In the process of the Hough transform algorithm, feature points are mapped to parameter space as shown in fig. 8. Equation (1), as given in [8], shows the general equation of circle while Equation (2), as given in [8] shows circle equation after switching into parameter space. A three-dimensional accumulator (a, b, r) is used to store all the points in the parameter space. When there exist repetitive intersections in the same position, the accumulator adds one at this position [8]. A threshold value is selected, when the accumulator value at a position surpasses the threshold, this point at this position is regarded as the circle center.
(x-a)2 + (y-b)2 = r2 (1)
(a-x)2 + (b-y)2 = r2 (2)
where (a, b) is the circle center, and r is the radius.
Here, preprocessed image of RBC containing edge pixels is applied as an input for Circular Hough Transform with the minimum and maximum range of radius for RBC. Minimum and the maximum radius of the cell are finalized 20 and 50 by analyzing the size of different RBCs in the 20 different sample images. Then a number of detected circles are considered as the number of RBCs.
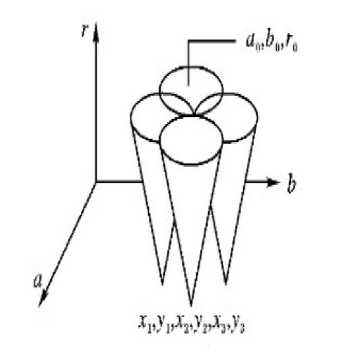
Fig.8. Circle in parameter space [9]
-
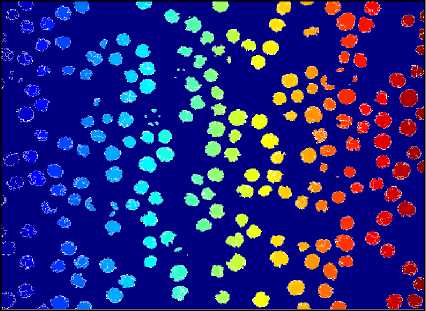
ii) Watershed Segmentation
As discussed above, the main problem in blood cell segmentation is overlapping of cells. Among the different algorithms for segmentation of clumped or overlapped objects, Watershed Segmentation is an effective approach to separate overlapped objects. The main feature of Watershed Segmentation is based on the concept of topographical representation of image intensity. The basic conception is based on visualizing a gray level image into its topographic representation, which includes three basic terms: minima, catchment basins, and Watershed lines [3]. Fig. 9 shows the concept of these three notations in Watershed Segmentation. The main drawback of Watershed Segmentation is over segmentation. To overcome this problem of over segmentation Marker controlled watershed segmentation is used which applies segmentation to the only set of markers. Here are the steps for marker controlled watershed segmentation applied for RBC segmentation.
Step 1 : Take the grayscale image of RBCs after thresholding and preprocessing.
Step 2: Identify the bright objects in the image using extended maxima operator.
Step 3 : Apply morphological operations on the resultant image like closing, hole filling and remove unwanted elements.
Step 4: Watershed transform identifies low points only so complement the image so that the peaks become valleys.
Step 5: Modify the image such that the background pixels and the extended maxima pixels become the only local minima in the image.
Step 6: Compute the watershed transform.
The result of Watershed Segmentation is used for counting using the same approach of WBC counting. Here also, the average area is considered as the minimum size of RBC. So connected objects having an area greater or equal to the minimum RBC size is considered for counting.
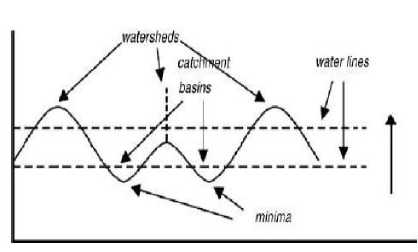
Fig.9. Watersheds and catchment basins [3]
-
V. I mage D ataset
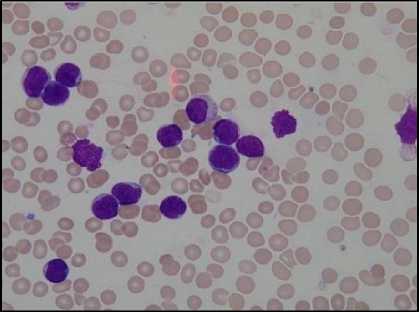
For the experiments, we have used the acute lymphoblastic leukemia image database ALLIDB, proposed by Donida Labati in [10]. It is public dataset which contains blood sample image of normal patient and patient having leukemia. We have used dataset ALL-IDB1 that includes 108 images in JPG format with 24-bit color depth. Most of the images in the dataset were captured with an optical laboratory microscope, with different magnifications ranging from 300 to 500, coupled with a Canon PowerShot G5 camera and their resolution is 2592x1944. The remaining images were acquired with a microscope at a constant magnification, coupled with an Olympus C2500L camera and their resolution is 1712x1368.
-
VI. E xperimental R esults
The given methodology is implemented in MATLAB 2013a having a RAM of 2 GB. Implementation results are taken on randomly selected images from the dataset. Results of RBC segmentation using Circular Hough Transform and Watershed Segmentation are discussed here. Further counting results of WBCs and RBCs are compared with the manual counting of blood cells to analyze the accuracy of the proposed method.
-
A. RBC Segmentation using Circular Hough Transform and Watershed Segmentation
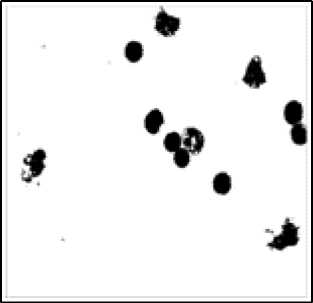
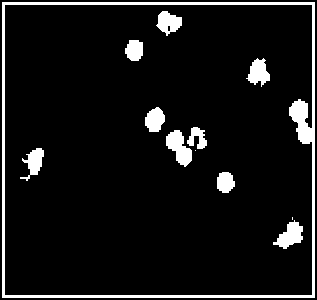
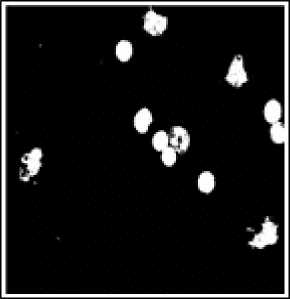
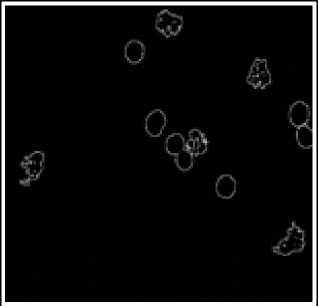
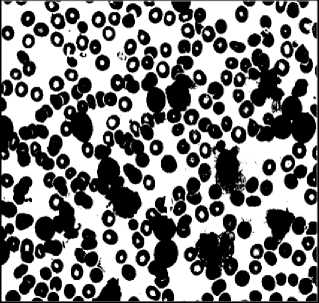
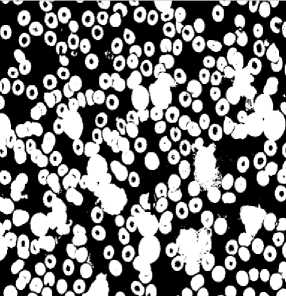
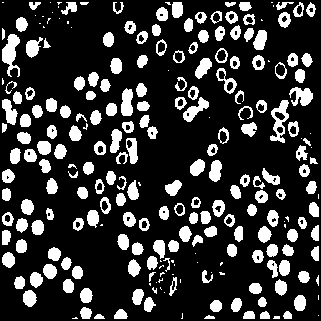
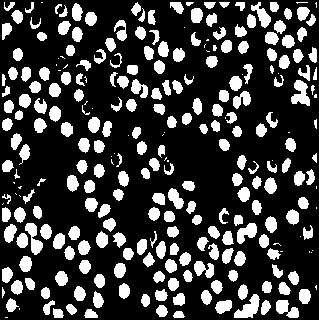
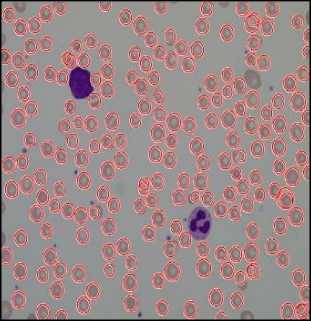
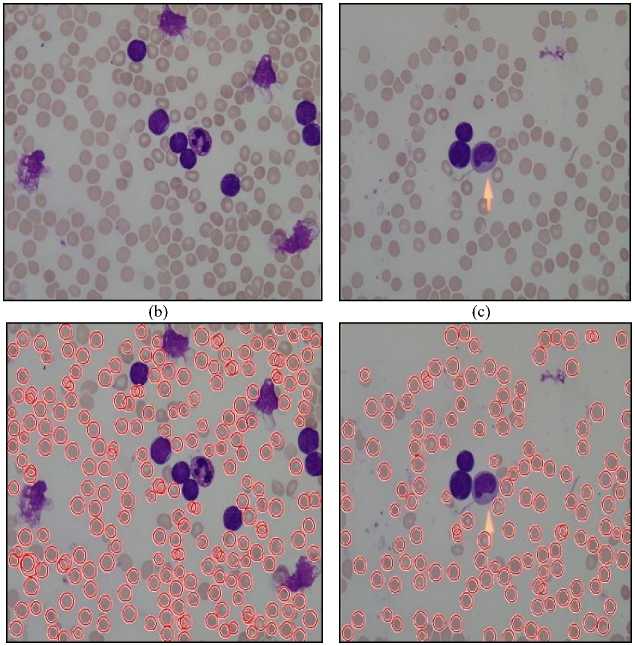
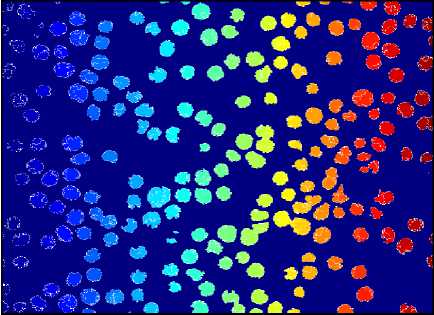
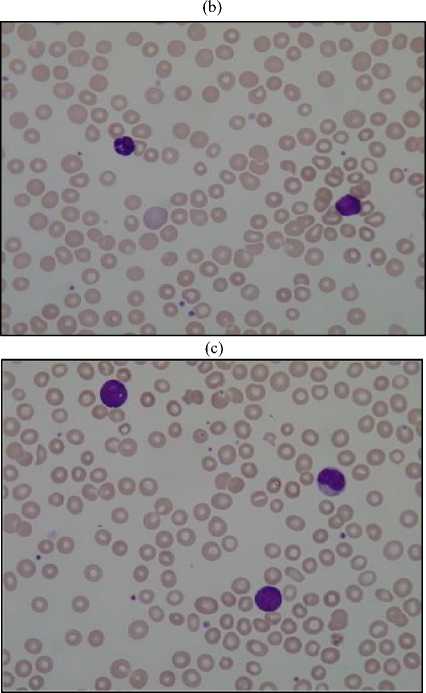
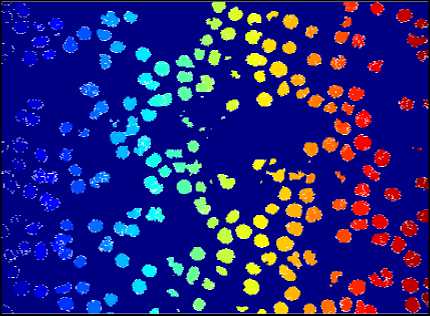
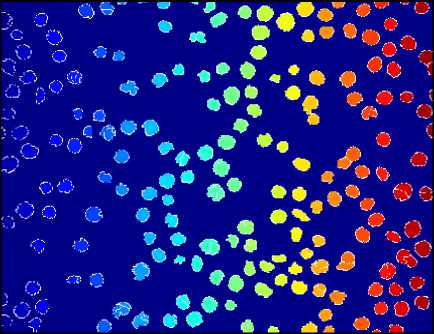
RBC cells segmented using Circular Hough Transform (CHT) after preprocessing steps are shown in fig.10. First-row images are the original images and second-row images show a number of detected RBCs using Circular Hough Transform. The result shows that almost all the blood cells are detected except the cells which are not circular or having morphological abnormalities are not detected.
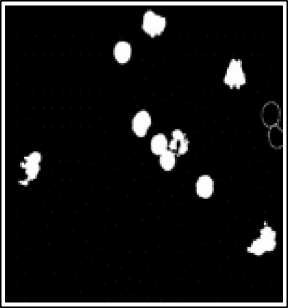
The result of Watershed Segmentation is shown in fig. 11. Figures on the left side show original images and right side images show detected RBCs using watershed segmentation. It shows that this method can detect the RBCs which are having morphological abnormalities. But this method fails when there is a high degree of overlapping.
(d)
(f)
(e)
Fig.10. Results of Circular Hough Transform. Here (a),(b) and (c) are Orignal Image and (d),(e) and (f) are detected RBCs using CHT
(e)
(f)
(d)
Fig.11. Results of Watershed Segmentation. Here (a), (b) , (c) and (d) are Original Image and (e), (f) ,(g) and (h) are detected RBCs using Watershed Segmentation
(g)
(h)
-
B. Counting Results of WBCs and RBCs
Results of proposed method are compared with manual count result of the same dataset. Here images are selected randomly from dataset to analyze obtained results. Table 2 and Table 3 show results of WBC and RBC counting. The accuracy of counting is calculated using Equation (3) shown below.
-
I Се I Ipm—Се 11 cm |\ „алл/
1 - 1--- Cellcm ---L ) *100 % (3)
Here Cellpm is the counted cells using proposed method and Cellcm is the counted cells using the manual method.
It shows that average counting accuracy achieved for WBC is 94.25%. Counting of RBC is performed using two approaches. In the first approach, Circular Hough Transform is applied to the image after preprocessing step. The Number of circles detected is considered as RBC count. The accuracy of which is 92.67%. In second approach marker controlled Watershed Segmentation is applied to the image after preprocessing. The accuracy of this method is 91.07%. Here result shows that Circular Hough Transform gives better result compared to
Table 3. Counting Results of RBCs
|
Image |
Manual Count |
Circular Hough Transform Count |
Watershed Segmentation Count |
% Accuracy of CHT |
% Accuracy of Watershed Segmentation |
|
Image1 |
219 |
216 |
218 |
98.63 |
99.54 |
|
Image2 |
224 |
240 |
241 |
92.86 |
92.41 |
|
Image3 |
230 |
264 |
253 |
85.22 |
90.00 |
|
Image4 |
143 |
159 |
164 |
88.81 |
85.31 |
|
Image5 |
199 |
205 |
237 |
96.98 |
80.90 |
|
Image6 |
195 |
220 |
220 |
87.18 |
87.18 |
|
Image7 |
208 |
210 |
210 |
99.04 |
99.04 |
|
Image8 |
191 |
213 |
208 |
88.48 |
91.10 |
|
Image9 |
198 |
214 |
234 |
91.92 |
81.82 |
|
Image10 |
194 |
205 |
203 |
94.33 |
95.36 |
|
Image11 |
188 |
198 |
188 |
94.68 |
100.00 |
|
Image12 |
175 |
178 |
180 |
98.29 |
97.14 |
|
Image13 |
189 |
200 |
198 |
94.18 |
95.24 |
|
Image14 |
189 |
214 |
227 |
86.77 |
79.89 |
|
Average Accuracy |
92.67% |
91.07% |
|||
VII. C onclusion and future work
Blood cell segmentation and counting using automated method are useful for early diagnosis of diseases. Here the counting of WBCs and RBCs is performed which achieves accuracy more than 90% which can be useful for detecting lower blood cell count. Here watershed segmentation is more accurate in case of morphological abnormalities and to detect overlapped cells while
Circular Hough Transform is useful in case of detecting circular cells and to detect overlapped cells separately. Here the result depends on the dataset selected. This proposed method performed the segmentation and counting of WBCs and RBCs well when results were
Watershed segmentation in terms of accuracy. The accuracy of both the methods can easily detect lower blood cell count of RBC.
Table 2. Counting Results of WBC
References Segmentation and Counting of WBCs and RBCs from Microscopic Blood Sample Images
- Y. M. Alomari, S. N. H. Sheikh Abdullah, R. Zaharatul Azma, and K. Omar, "Automatic Detection and Quantification of WBCs and RBCs Using Iterative Structured Circle Detection Algorithm," Comput. Math. Methods Med., vol. 2014, p. e979302, Apr. 2014.
- P. Maji, A. Mandal, M. Ganguly, and S. Saha, "An automated method for counting and characterizing red blood cells using mathematical morphology," in 2015 Eighth International Conference on Advances in Pattern Recognition (ICAPR), 2015, pp. 1–6.
- J. Hari, A. S. Prasad, and S. K. Rao, "Separation and counting of blood cells using geometrical features and distance transformed watershed," in 2014 2nd International Conference on Devices, Circuits, and Systems (ICDCS), 2014, pp. 1–5.
- S. M. Mazalan, N. H. Mahmood, and M. A. A. Razak, "Automated Red Blood Cells Counting in Peripheral Blood Smear Image Using Circular Hough Transform," in 2013 1st International Conference on Artificial Intelligence, Modelling and Simulation (AIMS), 2013, pp. 320–324.
- K. A. Abuhasel, C. Fatichah, and A. M. Iliyasu, "A commixed modified Gram-Schmidt and region growing mechanism for white blood cell image segmentation," in 2015 IEEE 9th International Symposium on Intelligent Signal Processing (WISP), 2015, pp. 1–5.
- C. Di Ruberto and L. Putzu, "Accurate Blood Cells Segmentation through Intuitionistic Fuzzy Set Threshold," in 2014 Tenth International Conference on Signal-Image Technology and Internet-Based Systems (SITIS), 2014, pp. 57–64.
- H. Tulsani, R. Gupta, and R. Kapoor, "An improved methodology for blood cell counting," in 2013 International Conference on Multimedia, Signal Processing and Communication Technologies (IMPACT), 2013, pp. 88–92.
- X. Chen, L. Lu, and Y. Gao, "A new concentric circle detection method based on Hough transform," in 2012 7th International Conference on Computer Science Education (ICCSE), 2012, pp. 753–758.
- T.-C. Chen and K.-L. Chung, "An Efficient Randomized Algorithm for Detecting Circles," Comput. Vis. Image Underst., vol. 83, no. 2, pp. 172–191, Aug. 2001.
- R. Donida Labati, V. Piuri, F. Scotti, "ALL-IDB: the Acute Lymphoblastic Leukemia Image DataBase for Image Processing," in In Proceedings of the ICIP International Conference on Image Processing, pp. pp. 2045–2048.
- P. Rakshit and K. Bhowmik, "Detection of abnormal findings in human RBC in diagnosing G-6-P-D deficiency Haemolytic Anaemia using image processing," presented at the Condition Assessment Techniques in Electrical Systems (CATCON), 2013 IEEE 1st International Conference on, 2013, pp. 297–302.
- K. Parvati, B. S. Prakasa Rao, and M. Mariya Das,"Image Segmentation Using Gray-Scale Morphology and Marker-Controlled Watershed Transformation," Discrete Dyn. Nat. Soc., vol. 2008, p. e384346, Jan. 2009.
- N. Deb and S. Chakraborty, "A noble technique for detecting anemia through classification of red blood cells in blood smear," in Recent Advances and Innovations in Engineering (ICRAIE), 2014, 2014, pp. 1–9.
- M. A. Mohamed and B. Far, "A Fast Technique for White Blood Cells Nuclei Automatic Segmentation Based on Gram-Schmidt Orthogonalization," presented at the Tools with Artificial Intelligence (ICTAI), 2012 IEEE 24th International Conference on, 2012, vol. 1, pp. 947–952.
- J. Cheewatanon, T. Leauhatong, S. Airpaiboon, M. Sangwarasilp, "A New White Blood Cell Segmentation Using Mean Shift Filter And Region Growing Algorithm," Int. J. Appl. Biomed. Eng., vol. 4, no. 1, pp. 30–35, 2011.
- H. Tulsani, R. Gupta, and R. Kapoor, "An improved methodology for blood cell counting," in 2013 International Conference on Multimedia, Signal Processing and Communication Technologies (IMPACT), 2013, pp. 88–92.
- J. Duan and L. Yu, "A WBC segmentation method based on HSI color space," presented at the Broadband Network and Multimedia Technology (IC-BNMT), 2011 4th IEEE International Conference on, 2011, pp. 629–632.
- H. Berge, D. Taylor, S. Krishnan, and T. S. Douglas, "Improved red blood cell counting in thin blood smears," presented at the Biomedical Imaging: From Nano to Macro, 2011 IEEE International Symposium on, 2011, pp. 204–207.
- F. Scotti, "Robust Segmentation and Measurements Techniques of White Cells in Blood Microscope Images," presented at the Instrumentation and Measurement Technology Conference, 2006. IMTC 2006. Proceedings of the IEEE, 2006, pp. 43–48.
- P. Lorenzo and D. R. Cecilia, "White Blood Cells Identification and Counting from Microscopic Blood Image," 2013 Int. Scolary Sci. Res. Innov., vol. 7, no. 1, pp. 15–23, 2013.
- http://www.mathworks.com/help
- http://homes.di.unimi.it/scotti/all
