Segmentation of abnormal blood cells for biomedical diagnostic aid

Author: Abdellatif Bouzid-Daho, Mohamed Boughazi
Journal: International Journal of Image, Graphics and Signal Processing @ijigsp
Article in issue: 1 vol.10, 2018.
Free access
The aim of our work is to obtain a maximum rate of recognition of abnormal (cancerous) blood cells. We propose the development of a system based on k-means methods, after an RGB channel decomposition by applying the algorithm which can segment our microscopic medical images. It turns out that the proposed system shows better segmentation and classification for the identification and detection of leukemia. The experimental results obtained are very encouraging, which helps hematologists to monitor the evolution of cancerous blood cells and make a good diagnosis.
Abnormal (cancerous) blood cells, k-means, microscopic medical images, segmentation, classification
Short address: https://sciup.org/15015930
IDR: 15015930 | DOI: 10.5815/ijigsp.2018.01.04
Text of the scientific article Segmentation of abnormal blood cells for biomedical diagnostic aid
Image processing is involved in a large number of applications. Biomedical applications is one of the domains that is taking a real advantage of the amazing progress in image processing that help to develop surgery acts, maladies diagnosis, therapeutic practice, and so on. Usually we used microscopic medical images to extract useful information for diagnosis support. This microscopic based image allows us to get more details which are difficult to see within the uncovered eyes. On the other hand, processing tools, methodologies and algorithms are developed in order to increase the visibility of the image being examined, and help doctors to well explore and take the right decision about the diagnosis. Image segmentation is one of the central steps toward getting specific information from a given image.
Image segmentation establishes the core of any vision system; this is an important step in the process of image processing; it was one of the most studied subjects in this field. The segmentation has for the objective the extraction of visual indications in an image. It makes it possible to divide, image set points called regions, homogeneous for one or more characteristics (intensity, color, gray levels or texture).
P. Purohit and R. Joshi [1] introduced a new efficient approach toward k-means clustering algorithm.
A. Jose and all [2] proposed brain tumor segmentation using k-means clustering and fuzzy c-means algorithm and its area calculation. In this work we try to apply an approach of segmentation by region based on the method of k-means for the analysis and processing of medical images textured [3], in the aim to identify anomalies in the general case and detect cancerous cells [4] in the particular case.
One of the fundamental processes in the chain of image processing [5] is the segmentation. The segmentation is a difficult problem [6] because we do not know a priori the type of textures present in the image to be analyzed, how many different textures are present and with which the region associate what texture or color. In fact, it is not necessary to know what exactly the existing textures are and what are the relevant colors?
The method of k-means [7] has been very used in several application and field of research, on the one hand for its simplicity of implementation and on the other hand because it can provide a good approximation of the segmentation sought. Nevertheless this method suffers from a fault that has its importance in segmentation of images: it introduces the spatial discontinuities strong enough to the borders of the classes [8-9]. Of regularization methods are therefore usually employed to strengthen the connectedness and thus reduce the number of related components of each class.
We will first present in the first part of our paper a brief description on the medical context, so the diagram of the method is based on segmentation. We will then present the functioning of the k-means algorithm. We will finally in the application of the algorithm by a series of microscopic medical images the essential characteristic is the texture using the functions implemented under Matlab, we will end by discussing the results, conclusion, perspectives and references.
-
II. Materials and Methods
The methods of analysis of the textures are essentially based on the study of the relationships between each pixel and its neighbors for the fine textures, and on the spatial distribution of the levels of gray. These methods give only statistical [10] information on the images unlike methods such as the segmentation that they give visual information.
In this paper we are interested in segmentation by region using the k-means method, our database is represented together of microscopic medical images.
-
A. Hardware requirements
We have implemented our algorithmic processing using the language MATLAB (R2012a) environment and
tested on a common PC Pentium (R) Dual-Core CPU Processor 2.20 GHz with 4 Go RAM.
-
B. Medical context
The type of microscopic medical images is the blood cells [11], which represents pathology [12]. In this case our goal in algorithmic processing is to segment the set of bio-images based on the relevant element color and texture [13-14].
-
C. Proposed system
Our system proposed in this paper (Fig.1.), contains two essential steps are, pretreatment of microscopic medical images after segmentation to identify abnormal blood cells based on the relevant element color.
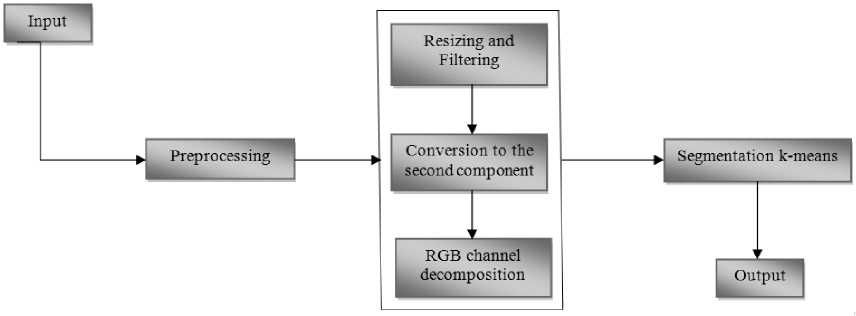
Fig.1. Block diagram of proposed system
The segmentation of a digital image I using a predicate of homogeneity p is commonly defined as A partition S= R1, R2, R3… RN such as:
-
1. 1 = U Ri , i e [1_n]
-
2. Ri is related, V i e [1^n]
-
3. P ( Ri ) = true, V i e [1_n]
-
4. P ( Ri U Rj ) = false, V i g j
As well, a multitude of techniques of segmentation are presented in the literature, they can be grouped into three main families: methods of segmentation by contours, the methods of segmentation by region and the classification methods [15].
-
a. Method k-means
This paper is present the segmentation method by region approach based on the k-means algorithm. K-means is an algorithm for vector quantization and alternating minimization, which, given an integer k , will seek to separate a set of points in k clusters. It is implementing in programming language the algorithm of mobile centers (k-means) for the automatic classification of a set of data (x 1 . . . x n ) k-means minimizes the criterion of error (distortion) depending on the centers of the classes ψ = (μ1. . .µk) and the classes z = (z1. . .zn): (z, ψ):
This corresponds to the Euclidean distance between total each data xi and the Center µzi which it is the closest to the meaning of the Euclidean distance:
Их , - Щ к ^ 2 = d(X t ,M k ) = JX j=i (% ij — ик]У (2)
In the expression of the criterion I , z ik is a binary variable that is 1 if the class of the example x i is k and 0 otherwise.
-
b. General principle algorithm
The algorithm is composed of the three following steps:
-
i. Initialization: it initializes the centers of the classes (µ 1 (0) . . . µ k (0)) (at your choice) to give the no departure of the algorithm (for example choosing randomly to centers that "virtual", or k data among the data to treat). It is therefore to start to the iteration t = 0 with initial values for the model parameters (µ 1 (0) . . . µ k (0)).
-
ii. Step of affectation (Classification): Each data is assigned to the class of the center of which it is the nearest V: i = 1, . . ., n
zW = {1 if к = arg ze{i,™fc” H%i- MfcП2
-
1 I 0 else
-
iii. Step of recalage of the centers: the Center μ of each class k is recalculated as the arithmetic average of all the data apartment in this class (following the step of previous assignment):
Vk = 1. . . k
„ (t+1) _ S ni ZiL^ i ^ k
n (t) ^ 1=1 zik
t being the current iteration.
The convergence can be regarded as reached if the value relative to the level of distortion j (1) becomes less than a threshold small prefixed or if a maximum number of iterations prefixed has been reached.
D. Database
To perform our approach, we consider for study purpose a public supervised image datasets [16] of blood cells provided from the hematology service of the CHU Hospital, Angers, France. This database gives typical blood microscope images obtained from the microscope inspection of blood slides which provides important qualitative and quantitative information concerning the presence of hematological pathologies as shown in the Fig.2. The obtained experimental
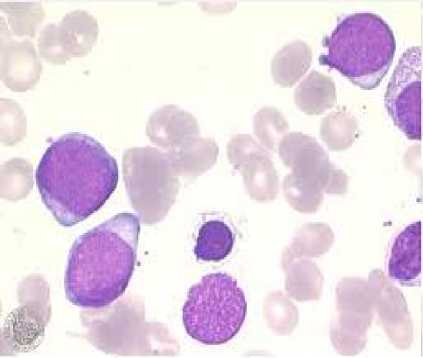
Fig.2. Medical microscopic image (Abnormal Blood Cell)
results described in the following section have been obtained by considering samples of blood cells cancer detected in the Fig.2.
-
III. Results and Discussion
After obtaining the blood cells, the pretreatment is carried out in two following steps:
-
A. Preprocessing step
Before applying our proposed method based on the k-means algorithm, it is necessary to perform a preprocessing which is to convert the matrix of pixels in a vector consisting of the grayscale for each of the basic colors (red, green, and blue). When the algorithm has been applied to the vector, we can then convert into a matrix consisting of the value associated with each cluster, for each pixel in the image; the result is shown in Fig.3.
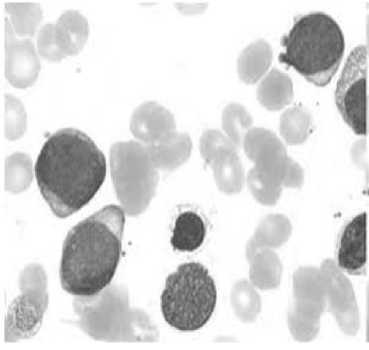
Fig.3. Preprocessing image (Resize + filtering + conversion to second component)
The choice of the conversion to grayscale resides on the second component, when we conducted the decomposition in channel (RGB) it is observed that the information is too clear visually on the green component, the results are illustrated by the figure below:
R G В
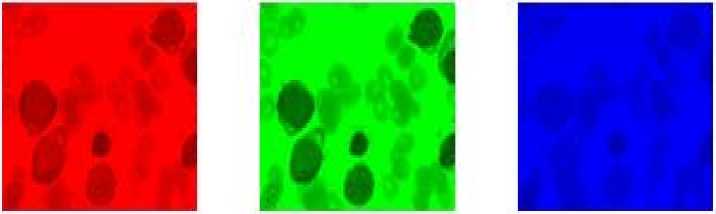
Fig.4. Decomposition in channel (RGB)
The figure above confirms the good choice on the second component because the resolution and better in G compared to (R or B).
-
B. Segmentation step
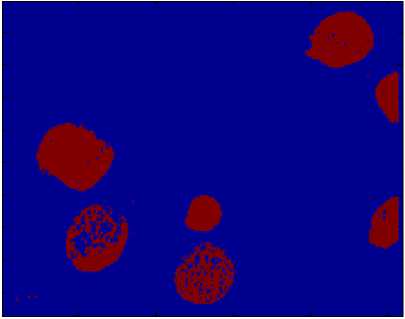
Fig.5. Identification of Abnormal Blood Cells cluster for the merits and a cluster for the other objects. The number of clusters the more logical in this case is therefore k =2. This is confirmed by the results obtained (Fig.5.).
After the segmentation, the abnormal cells of the blood are clearly distinguished.
-
> We conclude that mostly the infected areas or area of interest are segmented from background, the results obtained shows that the segmented images contains two classes are colored according to the membership provided by the k-means algorithm, this segmentation allows you to found the classes (object) correspond to homogeneous regions and remove any unwanted region of the image.
-
C. Application on another image
We have, then, carried out various tests on other image with the same structure of the algorithm proposed in this paper; we had its results illustrated by (Fig.6. and Fig.7.).
We note that the segmented images after pretreatment we give two classes. In effect, it is enough to create a
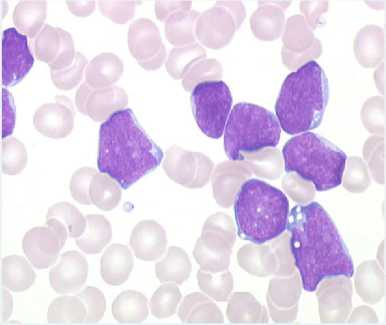
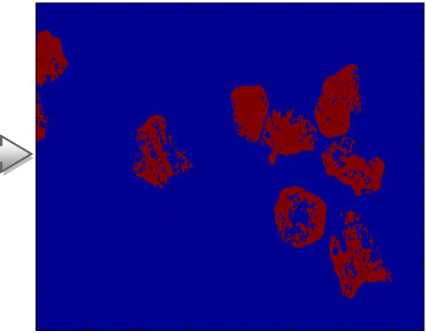
Fig.6. Detection of Abnormal blood cells
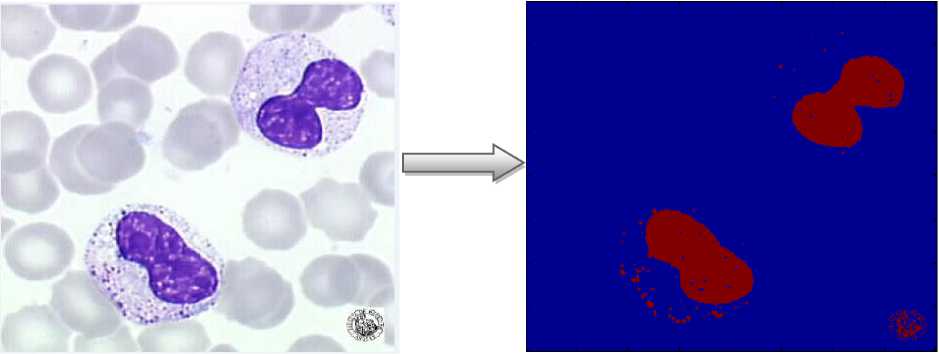
Fig.7. Detection of Abnormal blood cell
Our proposed method is applicable to different image of the blood cells despite the change of the targeted objects which shows the effectiveness of our algorithm.
-
IV. Conclusion
This paper focuses primarily on the description and the characterization of the abnormal blood cells in the bioimages; it is pressing on a mathematical basis based on a k-means method. This last is essentially based on the study of the relations between each pixel and its neighbors for the fine textures, and on the spatial distribution of the gray levels. This article provides aid with biomedical diagnostic of information presented by the extraction of abnormal region of blood cells. The results obtained do not permit the detection of pathologies, but to bring to physicians of the tools in image processing for the purpose of quantifying the various structures cancerous of the blood cell.
In the future we will think use this tool to define other characteristics to know the size of a tumor, the Directorate contours. In the aim of diagnostic aid when the results found in this article are remarkable.
The ideal will be to work in collaboration with the health staff in order to be able to optimize the algorithms of calculations of the parameters of medical images and textured to be able to directly involve the results of these processes to the clinic.
References Segmentation of abnormal blood cells for biomedical diagnostic aid
- P. Purohit and R. Joshi. ‘’A New Efficient Approach towards k-means Clustering Algorithm’’, In International Journal of Computer Applications, Vol.65, N°.11, 2013.
- A. Jose, S. Ravi and M. Sambath. ‘’Brain Tumor Segmentation using k–means Clustering and Fuzzy C -means Algorithm and its Area Calculation’’, In International Journal of Innovative Research in Computer and Communication Engineering, Vol.2, N°.2, 2014.
- S. Mishra, and M. Panda. ‘’A Histogram-based Classification of Image Database Using Scale Invariant Features’’, International Journal of Image, Graphics and Signal Processing (IJIGSP), Vol.9, N°.6, pp.55-64, 2017.
- A. Bouzid-Daho, and all. ‘’Algorithmic Processing to Aid Leukemia Detection’’, In Medical Technologies Journal, Vol.1, N°.1, pp.10-11, 2017.
- K. Bhima, and A. Jagan. ‘’An Improved Method for Automatic Segmentation and Accurate Detection of Brain Tumor in Multimodal MRI’’, In International Journal of Image, Graphics and Signal Processing, Vol.9, N°.5, pp.1-8, 2017.
- T. Kalaiselvi and P. Nagaraja, “A Rapid Automatic Brain Tumor Detection Method for MRI Images using Modified Minimum Error Thresholding Technique” International Journal of Imaging Systems and Technology, Vol.25, N°.1, pp.77–85, 2015.
- S. Selvaraj, and B.R Kanakaraj, ‘‘K-Means Clustering Based Segmentation of Lymphocytic Nuclei for Acute Lymphocytic Leukemia Detection’, International Journal of Applied Engineering Research, Vol.9, N°.21, pp.11423-11432, 2014.
- C. Di Ruberto and L. Putzu, “Accurate Blood Cells Segmentation through Intuitionistic Fuzzy Set Threshold,” in Tenth International Conference on Signal-Image Technology and Internet-Based Systems (SITIS’14), pp. 57–64. 2014
- Q. Wang, L. Chang, M. Zhou, M. and Q, L. ‘‘A spectral and morphologic method for white blood cell classification’’, ELSEVIER: Optics & Laser Technology, Vol.84, pp.144-148, 2016.
- L. A. Bhavnani, U. K. Jaliya and M J. Joshi. ‘’Segmentation and Counting of WBCs and RBCs from Microscopic Blood Sample Images’’, In International Journal of Image, Graphics and Signal Processing, Vol.8, N°.11. pp.32-40, 2016.
- A. Bouzid-Daho, and all. ‘’SEGMENTATION OF ABNORMAL BLOOD CELLS TO AID LEUKEMIA DETECTION’’, In Acta HealthMedica Journal, Vol. 1, N°. 4, pp. 88-92, 2016.
- F. Mashiat, and J. Sharma, J. ‘‘Identification and classification of acute leukemia using neural network.’’ In Medical Imaging, m-Health and Emerging Communication Systems, International Conference on (MedCom) IEEE, pp.142-145, 2014.
- A. Bouzid-Daho, and all. ‘’Textural Analysis of Bio-Images for Aid in the Detection of Abnormal Blood Cells’’, In International Journal of Biomedical Engineering and Technology, Vol.25, N°.1, pp.1-13, 2017.
- X. Wu, and all. ‘‘Differentiation of Diffuse Large B-cell Lymphoma From Follicular Lymphoma Using Texture Analysis on Conventional MR Images at 3.0 Tesla’’, Academic Radiology, ELSEVIER, Vol.23, N°.6, pp.696-703, 2016.
- M. D. Joshi, A. H. Karode, and S. R. Suralkar. ‘’White Blood Cells Segmentation and Classification to Detect Acute Leukemia’’, In International Journal of Emerging Trends & Technology in Computer Science, Vol.2, N°.3, pp.147-151, 2013.
- http://hematocell.univ-angers.fr/index.php/banque-dimages. Cons: 16/03/2017.
