Selecting qualitative features of driver behavior via pareto analysis

Автор: Kawtar Zinebi, Nissrine Souissi, Kawtar Tikito
Журнал: International Journal of Modern Education and Computer Science @ijmecs
Статья в выпуске: 10 vol.10, 2018 года.
Бесплатный доступ
Driver behavior is the main cause of road crashes; it is the key element that insures a better understanding and improves predictions of car accidents. The main goal of our study is to determine the set of driver behavior features that are the most encountered in literature; we were based on behavioral questionnaires as a source for these features. We selected the questionnaires that are most cited in literature and therefore proved their efficiency through many studies they were employed in. Then we extracted the features considered in their items and classified them by rate of appearance according to the Pareto & ABC principle. In the second part of our study we collaborated with the National Committee for Circulation Accident Prevention (CNPAC) of the Ministry of Transportation of Morocco in order to compare the findings we gathered from literature with the researches they administer. We prepared a questionnaire that contains the final set of features and we transmitted it to experts working in the road safety field to rate it according to their knowledge and experience. Data analysis showed significant differences in some features, which demonstrates the gap between theoretical results and field research.
Driver behavior features, behavioral questionnaires, Pareto & ABC analysis, DBQ, DAX, MDSI, DSQ, DBI
Короткий адрес: https://sciup.org/15016797
IDR: 15016797 | DOI: 10.5815/ijmecs.2018.10.01
Текст научной статьи Selecting qualitative features of driver behavior via pareto analysis
Published Online October 2018 in MECS DOI: 10.5815/ijmecs.2018.10.01
-
I. Introduction
Vehicle related causalities are one of the most deadly causes worldwide. According to the World Health Organization, traffic accidents caused about 1.25 million deaths in 2015, 75% are male victims and 49% are among pedestrians, cyclists and motorists. The same report shows that car crashes are the first cause of deaths among population aged between 15-29 years.
Many aspects are taken into account in defining causes of crash frequency and injuries severity, they can be classified into infrastructure, vehicle defects and human faults [1]. The first category consists of road traffic characteristics such as type of road and its conditions, weather and traffic flow, the second one includes conditions of the vehicle, and the last one involves around driver’s characteristics, like driving experience, fatigue, physiological and psychological state, personality traits and attitudes.
Driver behavior proves to be the key element behind car crashes involvement [2], as data show that 70–80% of road accidents were completely the fault of drivers, and this rate is well known to be similar in the majority of countries in the world, which is why vigorous efforts are under way today to fully apprehend and model driver behavior.
The description of such a system is not an obvious task, given the complexity and the diversity of activities and functions performed while driving. Many studies address driver’s poor perception as the main feature for accident involvement [2,3,4,5], others reported about risk taking to have a major impact on road crashes especially among young and male drivers [6,7,8].
The main difficulty that researchers encounter is the absence of a unified definition and a standard method to model driver behavior. We realized that literature lacks a common model; it needs to acquire a universal model given its importance for safety organizations, industrial manufacturers and researchers all around the globe. Research on this topic had increased exponentially during the last decade considering the technological evolution of electronic devices and communication protocols, but still there is a deficiency in terms of standardized models that define driver behavior as a whole system, and not just portions of it. Therefore we decide to address such behavior by adopting a generic approach that doesn’t focus on one or two features, but instead it considers the entirety of its elements in order to represent the multidimensional nature of this phenomenon.
This is why our main objective in this paper is to collect the set of features that control driver behavior as a first step into defining a generic model for it. The main resources we consider for these features are behavioral questionnaires; our methodology is based on these questionnaires as an input in order to extract major features that need to be taken into account in a behavioral model.
Our paper is organized as following; in the second section, we present our research method in details and explain the different steps we followed, next in the third section, we address each questionnaire and classify the features we extracted in them, and finally in the fourth section we conduct a comparative study with the CNPAC of Morocco in order to compare theoretical results from literature with their field projects.
-
II. Research Method
The main reason we chose to work with behavioral questionnaires is the diversity of their items and the large amount of information they contain. They represent many situations that drivers are likely to encounter on the roads, that others collecting methods might miss. They also summarize the circumstances of these situations; their items express explicitly the causes of such behaviors and indicate the intents of the driver behind them. They also question about the driver’s state of mind, feelings, personal motivations and attitudes toward driving, which is a benefit for our research since our main goal is to collect as many features as possible, from quantitative measures (speed, acceleration etc.) to qualitative features (personality, state of mind, fatigue etc.)
In this paper we are interested in analyzing the questionnaires items, their design and the information they include, we will not address the results of such measurements since this topic brings many controversy about reliability and bias.
Step 1: Selecting driver behavior questionnaires
In this step, we represent the questionnaires we selected for our study. The main selection criteria are the number of citation and the diversity of themes. In table 1, we gathered the set of the most cited questionnaires in literature. For this purpose, we used the research motors ScholarGoogle, IEEXplore and ScienceDirect.
Table 1. Most cited driver behavior questionnaires
|
DBQ [9] |
DAX [10] |
MDSI [11] |
Reckless Driving Habit Scale [12] |
|
|
All citations |
1132 |
252 |
201 |
46 |
|
DSQ [14] |
DBI [15] |
DAS [16] |
DVQ [13] |
|
|
All citations |
206 |
240 |
476 |
96 |
This table shows that literature includes eight behavioral questionnaires as the most employed in traffic psychology studies. We chose to eliminate three questionnaires from this list for the main reason of avoiding redundancy; the items presented in the Reckless Driving Habit Scale, the DVQ and the DAS are all reproduced in the others questionnaires.
Finally we ended up with five questionnaires indicated in the list below.
-
• Driver Behavior Questionnaire (DBQ) [9] : is one of the most widely used method to assess self-reported driving behaviors [17,18,19], its main objective is to help understanding the relation between violations, crash involvement and personal driving habits.
-
• Driving Anger Expression Inventory (DAX) [10]: is a measurement developed to evaluate how drivers express their anger on the road, its items describe different situations driven by irritation or frustration form traffic or other drivers behavior.
-
• Multidimensional Driving Style Inventory (MDSI) [11]: it targets eight main styles: “dissociative, anxious, risky, angry, high-velocity, distress reduction, patient, and Carefulness”. It was designed to assess driver’s habitual behaviors and drivingspecific features that can explain accident involvement and traffic law violations, it takes into account general socio-demographic and personality features
-
• Driving Style Questionnaire (DSQ) [14]: it contains 15 items that target what the authors called driving dimensions: speed, calmness, social resistance, focus, planning, and deviance.
-
• Driving Behavior Inventory (DBI) [15]: It is based on four elements which are driving aggression, dislike of driving, tension and frustration connected with successful or unsuccessful overtaking, irritation when overtaken and heightened alertness and concentration. The 35 items of the questionnaire highlights driver stress reactions to different situations.
Step 2: Extracting driver behavior features
After selecting the questionnaires, the next step is to extract behavior features from them. This operation depends on the items of each questionnaire. As an example, the first item in the DBQ is “Attempt to drive away from traffic lights in third gear”; the situation presented in this item contains one behavioral feature which is “Inattention”. Another item from the DBQ is “'Wake up' to realize that you have no clear recollection of the road along which you have just travelled”, it mainly refers to “Day dreaming”. More details of this phase are presented in the third section of our paper.
Step 4: Comparison study with the CNPAC
This step is the final phase of our study, it consists of validating the previous findings from step3. We need to compare our theoretical results with an accredited organization so we can deduce the gap between field studies and theoretical research. For this, we collaborated with the National Committee for Circulation Accident Prevention (CNPAC) of the Ministry of Transportation of Morocco in order to evaluate our findings from literature with their statistical studies.
-
A. Questionnaires Presentation
As mentioned in step1, our analysis is based on five questionnaires which we selected based on many criteria, namely their design and dimensions. We made sure the questionnaires addresses different aspects of driver behavior so we avoid repetitiveness. The main concepts we managed to frame are Risk taking, Anxiety, Anger, Mistakes and Inattention.
These four concepts are a summary of the features presented in the questionnaires items. We created this four-dimension representation in order to demonstrate that these concepts are independently coherent and perpendicular to each other, which implies that they can be seen as independent and distinctive aspects of driver behavior.
On the other hand, even though the questionnaires’ themes are disparate, they have some intersections points as shown in table2.
As an example for the representation of these aspects in the questionnaires items , stress is illustrated in the MDSI by items such as “feel nervous while driving” and by “I feel anxious when overtaken at a junction” from the DBI. Revenge is represented in the DAX by “I do to select the top portions that need to be addressed. We are other drivers what they did to me” and “Angered by another driver's behavior, you give chase with the intention of giving him/her a piece of your mind” from the DBQ.
-
B. Pareto & ABC Analysis
-
1) DBQ:
Table 2. Intersections between questionnaires
|
DBQ |
MDSI |
DAX |
DBI |
|
|
MDSI |
Slips & Mistakes & Lapses & Violations |
* |
* |
* |
|
DAX |
Use of vehicle for aggression |
Angry driving & Careful driving |
* |
* |
|
DBI |
______ |
Anxious driving & angry driving |
Adaptive expression & Use of vehicle for aggression |
* |
|
DSQ |
Deviance & Planning & Speed |
Speed & calmness & Deviance & Focus |
Speed |
Focus & Calmness |
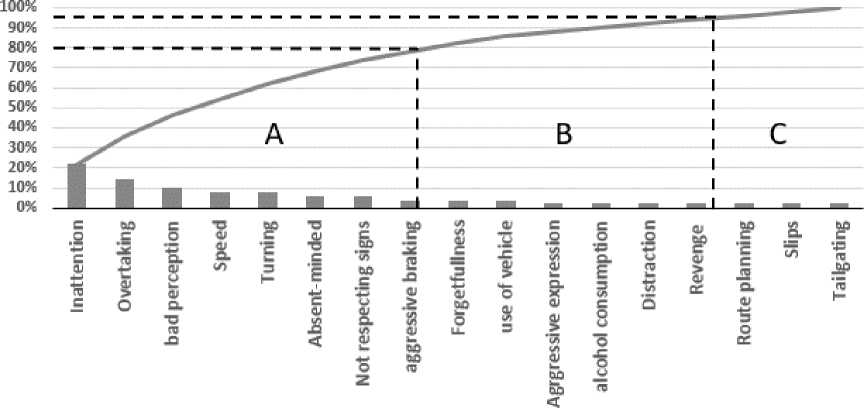
Results of the DBQ show different percentages of various elements; Inattention, Overtaking, Bad perception, Speed, Turning, Absent-minded, Not respecting signs and Aggressive braking have the most rate of appearance as they belong in the class A, they show up in items like “Distracted or preoccupied, realize belatedly that the vehicle ahead has slowed, and have to slam on the brakes to avoid a collision”, “Cut the corner on a right-hand turn and have to swerve violently to avoid an oncoming vehicle” and “Disregard red lights when driving late at night along empty roads”.
We remind that this classification does not mean that features with least rate of appearance are least significant, we don’t judge the features by their importance or impact on accident involvement, we order them according to their appearance frequency in the questionnaire items.
-
2) DAX:
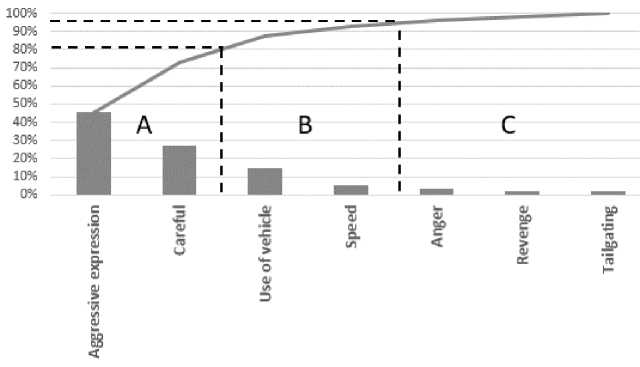
We applied the same Pareto principle as the previous questionnaire. Figure 2 illustrates the results for the DAX.
According to these results, the elements that are most present in the DAX are Aggressive expression and Carefulness. These findings are completely predictable since the questionnaire is orientated toward hostile thinking and assertive behaviors. The aggressive expressions are a combination of many acts like glaring at other drivers, shaking head as an expression of anger, yelling things like “where did you get your license?”, and getting out of the car to tell others to get out of the way, while the careful actions are presented by items such as “I pay even closer attention to being a safe driver” and “I pay even closer attention to other’s driving to avoid accidents”.
-
3) MDSI:
The Multidimensional Driving Style Inventory is originally designed by [11], it has demonstrated its sufficiency through many studies aiming to evaluate the correspondence between personality traits and driving habits [20,21,22] and it has been translated into many languages [23,24]. The Pareto analysis for its items is presented in figure 3.
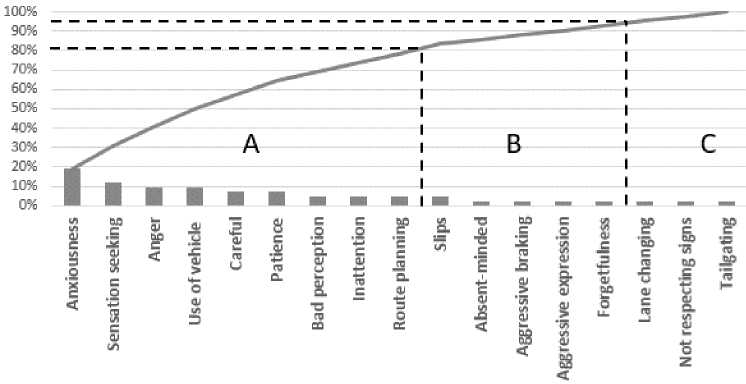
The figure shows that the features most included are Anxiousness, Sensation seeking, Anger, Use of vehicle, Carefulness, Patience, Bad perception, Inattention and Route planning. We can make the first remark about the dominant themes of the MDSI, which are emotion-driven actions. These actions are presented by items such as “blow my horn or “flash” the car in front as a way of expressing frustrations”, “feel nervous while driving” and
“nearly hit something due to misjudging my gap in a parking lot”.
-
4) DSQ:
The Pareto analysis for the DSQ is represented in figure 4.
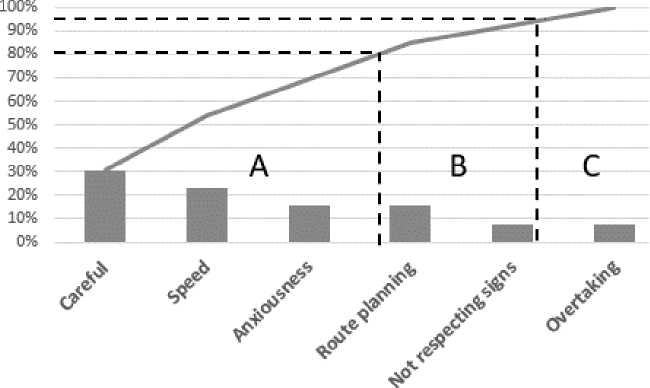
According to these results, the features that appear the most in the DSQ are Carefulness, Speed and Anxiousness. These features are directly related to the objective of the questionnaire, which is modeling decision making of drivers based on their driving style. These features are present in items such as “Do you exceed the speed limit in built up areas”, “Is your driving affected by pressure from other motorists?” and “Do you find it easy to ignore distractions while driving”.
-
5) DBI:
The Pareto analysis for the DBI is represented in figure
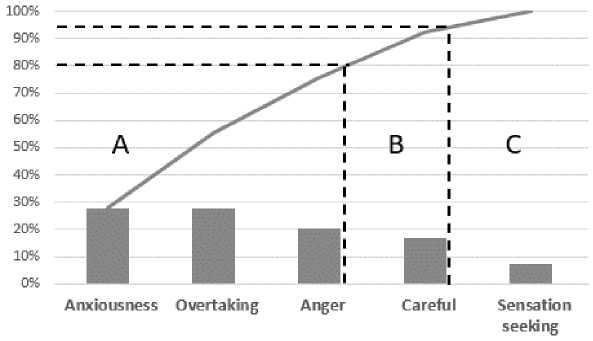
Results show that Anxiousness is the most cited feature, which is entirely predictable since the theme of the DBI is adjusted on driver stress. Overtaking also proves to be much referred to in items such as “I feel angry when overtaken at a junction”, “I feel anxious when overtaken at a junction”, “I do not feel indifferent when overtaking another vehicle”, “I feel satisfied when overtaking another vehicle” and “I feel tense when overtaking another vehicle”.
-
C. Classification and Synthesis
In this section, we gather all the features that we extracted from all the questionnaires above, and we calculate the number of times they occurred as a Class A, Class B, Class C. The results are presented in table 3.
Table 3. ABC classification of driver behavior features
|
Features |
Class A |
Class B |
Class C |
Not mentioned |
|
Anxiousness |
3 |
0 |
0 |
2 |
|
Carefulness |
3 |
1 |
0 |
1 |
|
Anger |
2 |
0 |
1 |
2 |
|
Bad perception |
2 |
0 |
0 |
3 |
|
Inattention |
2 |
0 |
0 |
3 |
|
Overtaking |
2 |
0 |
1 |
2 |
|
Speed |
2 |
1 |
0 |
2 |
|
Absent-minded |
1 |
1 |
0 |
3 |
|
Aggressive braking |
1 |
1 |
0 |
3 |
|
Aggressive expression |
1 |
2 |
0 |
2 |
|
Not respecting signs |
1 |
1 |
1 |
2 |
|
Patience |
1 |
0 |
0 |
4 |
|
Route planning |
1 |
1 |
1 |
2 |
|
Sensation seeking |
1 |
0 |
1 |
3 |
|
Turning |
1 |
0 |
0 |
4 |
|
Use of vehicle |
1 |
2 |
0 |
2 |
|
Alcohol consumption |
0 |
1 |
0 |
4 |
|
Distraction |
0 |
1 |
0 |
4 |
|
Forgetfulness |
0 |
2 |
0 |
3 |
|
Lane changing |
0 |
0 |
1 |
4 |
|
Revenge |
0 |
1 |
1 |
3 |
|
Slips |
0 |
1 |
1 |
3 |
|
Tailgating |
0 |
0 |
2 |
3 |
All of these driving-related features are crucial in predicting driving styles, as they figure in the most cited driving behavior questionnaires. We remind that this classification does not reflect the importance nor the influence of these features on the gravity of accidents, but this categorization illustrates their consideration rate in self-report measures and behavioral studies in traffic safety field.
-
IV. Comparative Analysis: Cnpac Case Study
-
A. Participants and Procedure
The final step of our analysis is to compare theoretical results collected from scientific literature with a real life case of study. To do so, we collaborated with the National Committee for Circulation Accidents Prevention (CNPAC) of the Ministry of Transport in Morocco. We prepared a questionnaire that contains the final set of features mentioned above and we transmitted it to experts working in the road safety field to answer it according to their knowledge and experience.
The questionnaire is a 4 point Likert scale, we chose this scale so we keep coherence between the testing data we get from this questionnaire and the previous theoretical results we had from the literature review. We associated the Class A, Class B, Class C and Not mentioned respectively with the Likert scale choices “4” (almost always), “3” (sometimes), “2” (every once in a while) and “1” (rarely) as shown in table 4.
Table 4. Scaling of driving-related features
|
Theoretical scale |
Not mentioned |
Class C |
Class B |
Class A |
|
Testing data scale |
1 |
2 |
3 |
4 |
The comparison process begins by collecting data from answers of the questionnaire; for each feature we calculated the number of person who checked choices “1” to “4”. The questionnaire we ended up using is presented as following:
“Based on a literature review of driver behavior models, we have identified a list of features considered important for understanding this behavior. Please note, according to your judgment and experience, the involvement degree of each feature in accidents and bad driving habits.”
-
1) To what extent do the following features appear in traffic accident statistics? Responses are on a 4point Likert scale,1 = “rarely”, 2 = “every once in a while”, 3 = “sometimes” and 4 = ‘nearly all the time’.
-
2) To what extent do the following features contribute to dangerous driving and affect driving performance? Responses are on a 4point Likert scale 1=”very mild”, 2 = “mild”, 3 = “moderate”, 4 = “severe”.
1
2
3
4
Bad perception
Inattention
Overtaking
Speed
Aggressive braking
Aggressive expression
Not respecting signs
Turning
Use of vehicle
Alcohol consumption
Distraction
Lane changing
Slips
Tailgating
1
2
3
4
Anxiousness
Carefulness
Anger
Absent-minded
Patience
Route planning
Sensation seeking
Forgetfulness
Revenge
-
B. Statistical Analysis and Results
Table 5. Results of Driving-related features
Data set 1: Literature questionnaires
Data set 2: CNPAC questionnaire
1 SAD
Features
Class A
Class B
Class C
Not mentioned
4
3
2
1
Anxiousness
3/5
0
0
2/5
3/8
5/8
0
0
1,25
Carefulness
3/5
1/5
0
1/5
5/8
3/8
0
0
0,4
Anger
2/5
0
1/5
2/5
4/8
3/8
1/8
0
0,95
Bad perception
2/5
0
0
3/5
8/8
0
0
0
1,2
Inattention
2/5
0
0
3/5
7/8
1/8
0
0
1,2
Overtaking
2/5
0
1/5
2/5
6/8
1/8
1/8
0
0,95
Speed
2/5
1/5
0
2/5
8/8
0
0
0
1,2
Absentminded
1/5
1/5
0
3/5
3/8
5/8
0
0
1,2
Aggressive braking
1/5
1/5
0
3/5
0
3/8
5/8
0
1,6
Aggressive expression
1/5
2/5
0
2/5
0
0
2/8
6/8
1,2
Not respecting
1/5
1/5
1/5
2/5
8/8
0
0
0
1,6
Patience
1/5
0
0
4/5
1/8
7/8
0
0
1,75
Route planning
1/5
1/5
1/5
2/5
0
1/8
4/8
3/8
0,6
Sensation seeking
1/5
0
1/5
3/5
2/8
3/8
2/8
1/8
0,95
Turning
1/5
0
0
4/5
1/8
6/8
1/8
0
1,75
Use of vehicle
1/5
2/5
0
2/5
4/8
2/8
2/8
0
1,1
Alcohol consumption
0
1/5
0
4/5
5/8
3/8
0
0
1,6
Distraction
0
1/5
0
4/5
7/8
1/8
0
0
1,75
Forgetfulness
0
2/5
0
3/5
0
3/8
4/8
1/8
1
Lane changing
0
0
1/5
4/5
3/8
4/8
1/8
0
1,75
Revenge
0
1/5
1/5
3/5
4/8
4/8
0
0
1,6
Slips
0
1/5
1/5
3/5
0
2/8
3/8
3/8
0,45
Tailgating
0
0
2/5
3/5
2/8
2/8
4/8
0
1,2
The main objective of this comparison is to observe the differences between driving behavior questionnaire features presented in literature and the parameters taken into account by the National Committee for Circulation Accidents Prevention (CNPAC) in Morocco. We calculate the sum of absolute differences to measure the statistical difference between the two data sets.
Results of the data analysis are presented in table 5. The P-value of fisher’s exact test expresses the correlation between the findings we concluded from literature and the answers of road safety experts. This test is useful for small simple sizes, which applies in our case . The sum of absolute differences is a second test to uphold the values of the fisher’s exact test. We are not going to consider a threshold for the p-value, but we rather identify the features with the highest p-value.
Not respecting signs, Turning, Alcohol consumption and Lane changing are the features with the highest values of SAD, which means there is a major divergence between data set 1 and data set 2. They are more ranked by the road safety professionals than by driver behavior questionnaires presented in literature. This difference can be explained by the nature of measurement studies of road users conducted by the CNPAC, they primarily depend on an information system that allow following basic law application and geographical monitoring of behavioral indicators, such as the distribution of speed according to different infrastructures, seat belt wearing for different types of road users, crossing light, respect of stop signs panels, helmet wearing etc. These features are selected in order to allow an understanding of accidents trends in different groups.
The results for Patience, Revenge and Distraction also show some significant difference, they have higher scores in data set 2, which is the CNPAC one. This difference demonstrates that these features have severe impacts on the number of accidents, even though they have low appearance in questionnaires.
-
V. Conclusion
This paper analyzes driver behavior from a qualitative approach; we collected the set of driving related features from behavioral questionnaires presented in literature. These features are collected from five questionnaires that have demonstrated their efficiency through many studies they were employed in. For each questionnaire we extracted the features considered in its items and ordered them by rate of appearance according to the Pareto principle. The outcome of this phase shows twenty three main features that have been considered as major aspects in the development of self-reported measurement for driver behavior, which are ; Anxiousness, Carefulness, Anger, Bad perception, Inattention, Overtaking, Speed, Absent-minded, Aggressive braking, Aggressive expression, Not respecting signs, Patience, Route planning, Sensation seeking, Turning, Use of vehicle, Alcohol consumption, Distraction, Forgetfulness, Lane changing, Revenge, Slips, and Tailgating. These features will help create a generic model for driver behavior that includes every aspect of driving situations.
After assembling these features, we collaborated with the National Committee for Circulation Accident Prevention (CNPAC) of the Ministry of Transportation of Morocco. We developed our own questionnaire that includes all previous features, which experts of road safety rated according to their knowledge and experience. The questionnaire was targeted to collect data about the importance of each feature in the unfolding of projects conducted by the CNPAC each year to monitor the evolution of traffic accidents.
From the results, we observed relevant differences between the two data sets. One of the most features to have significant difference is Distraction; it scored more in the CNPAC dataset than in the literature review. This finding shows that field researches give more attention to driver’s state of attention, which translates into distraction. Not respecting signs and Alcohol consumption have also higher rates in the CNPAC data set, which can be justified by their impact on accidents statistics.
This paper may be used as a reference for building a generic model for driver behavior, as we presented a set of important features that were both considered in selfreport measurements researches and in field studies conducted by governmental organizations in Morocco.
Список литературы Selecting qualitative features of driver behavior via pareto analysis
- Wang, B., Hensher, D. A., & Ton, T. (2002). Safety in the road environment: a driver behavioural response perspective. Transportation, 29(3), 253-270. DOI: 10.1023/A:1015661008598.
- de Oña, J., de Oña, R., Eboli, L., Forciniti, C., & Mazzulla, G. (2014). How to identify the key features that affect driver perception of accident risk. A comparison between Italian and Spanish driver behavior., Accident Analysis & Prevention, 73, 225-235. DOI: 10.1016/j.aap.2014.09.020.
- Green, M. (2000). " How long does it take to stop?" Methodological analysis of driver perception-brake times. Transportation human features, 2(3), 195-216. DOI: 10.1207/STHF0203_1.
- Olson, P. L., Dewar, R., & Farber, E. (2010). Forensic aspects of driver perception and response.
- Bella, F. (2013). Driver perception of roadside configurations on two-lane rural roads: Effects on speed and lateral placement., Accident Analysis & Prevention, 50, 251-262. DOI: 10.1016/j.aap.2012.04.015.
- Guo, F., & Fang, Y. (2013). Individual driver risk assessment using naturalistic driving data. Accident Analysis & Prevention, 61, 3-9. DOI: 10.1016/j.aap.2012.06.014.
- Jonah, B. A. (1986). Accident risk and risk-taking behaviour among young drivers. Accident Analysis & Prevention, 18(4), 255-271. DOI: 10.1016/0001-4575(86)90041-2.
- J. P. F. &. D. P. (. Cestac, Young drivers’ sensation seeking, subjective norms, and perceived behavioral control and their roles in predicting speeding intention: How risk-taking motivations evolve with gender and driving experience, Safety science, 49(3), 424-432. DOI: 10.1016/j.ssci.2010.10.007.
- Reason, J., Manstead, A., Stradling, S., Baxter, J., & Campbell, K. (1990). Errors and violations on the roads: a real distinction?. Ergonomics, 33(10-11), 1315-1332. DOI: 10.1080/00140139008925335.
- Deffenbacher, J. L., Lynch, R. S., Oetting, E. R., & Swaim, R. C. (2002). The Driving Anger Expression Inventory: A measure of how people express their anger on the road., Behaviour research and therapy, 40(6), 717-737. DOI: 10.1016/S0005-7967(01)00063-8.
- Taubman-Ben-Ari, O., Mikulincer, M. and Gillath, O. (2004)a. The multidimensional driving style inventory—scale construct and validation. Accident Analysis & Prevention, 36(3), pp.323-332. DOI: 10.1016/S0001-4575(03)00010-1.
- Taubman-Ben-Ari, O., Mikulincer, M., & Iram, A. (2004)b. A multi-featureial framework for understanding reckless driving—appraisal indicators and perceived environmental determinants., Transportation Research Part F: Traffic Psychology and Behaviour, 7(6), 333-349. DOI: 10.1016/j.trf.2004.10.001.
- Wiesenthal, D. L., Hennessy, D., & Gibson, P. M. (2000). The Driving Vengeance Questionnaire (DVQ): The development of a scale to measure deviant drivers' attitudes. Violence and Victims, 15(2), 115.
- French, D. J., West, R. J., Elander, J., & Wilding, J. M. (1993). Decision-making style, driving style, and self-reported involvement in road traffic accidents. Ergonomics, 36(6), 627-644. DOI: 10.1080/00140139308967925
- Gulian, E., Matthews, G., Glendon, A. I., Davies, D. R., & Debney, L. M. (1989). Dimensions of driver stress. Ergonomics, 32(6), 585-602. DOI: 10.1080/00140138908966134.
- Deffenbacher, J. L., Oetting, E. R., & Lynch, R. S. (1994). Development of a driving anger scale. Psychological reports, 74(1), 83-91.
- Lucidi, F., Mallia, L., Lazuras, L., & Violani, C. (2014). Personality and attitudes as predictors of risky driving among older drivers. Accident Analysis & Prevention, 72, 318-324. DOI: 10.1016/j.aap.2014.07.022.
- Mallia, L., Lazuras, L., Violani, C., & Lucidi, F. (2015). Crash risk and aberrant driving behaviors among bus drivers: the role of personality and attitudes towards traffic safety. Accident Analysis & Prevention, 79, 145-151., DOI: 10.1016/j.aap.2015.03.034.
- Rowe, R., Roman, G. D., McKenna, F. P., Barker, E., & Poulter, D. (2015). Measuring errors and violations on the road: A bifeature modeling approach to the Driver Behavior Questionnaire.,Accident Analysis & Prevention, 74, 118-125. DOI: 10.1016/j.aap.2014.10.012.
- Wickens, C. M., Mann, R. E., Stoduto, G., Butters, J. E., Ialomiteanu, A., & Smart, R. G. (2012). Does gender moderate the relationship between driver aggression and its risk features?, Accident Analysis & Prevention, 45, 10-18. DOI: 10.1016/j.aap.2011.11.013.
- Zhang, T., Chan, A. H., & Zhang, W. (2015). Dimensions of driving anger and their relationships with aberrant driving. Accident Analysis & Prevention, 81, 124-133. DOI: 10.1016/j.aap.2015.05.005.
- Feature, R., Mahalel, D., & Yair, G. (2008). Inter-group differences in road-traffic crash involvement. Accident Analysis & Prevention, 40(6), 2000-2007. DOI: 10.1016/j.aap.2008.08.022.
- Poó, F.M., Taubman - Ben-Ari, O., Ledesma, R.D., Díaz-Lázaro, C.M., 2013. Reliability and validity of a Spanish-language version of the multidimensional driving style inventory., Transp. Res. Part F: Traffic Psychol. Behav. 17, 75–87. DOI: 10.1016/j.trf.2012.10.003.
- Holman, A.C., Havârneanu, C.E., 2015. The Romanian version of the multidimensional driving style inventory: psychometric properties and cultural specificities, Transp. Res. Part F: Traffic Psychol. Behav. 35, 45–59. DOI: 10.1016/j.trf.2015.10.001.
