Self-organization and entropic s-lines

Author: Korablev Grigoriy Andreevich, Zaikov Gennadiy Efremovich, Kodolov Vladimir Ivanovich, Vasilyev Yuriy Gennadyevich, Maksimov Pavel Leonidovich, Petrova Natalya Grigoryevna
Journal: НБИ технологии @nbi-technologies
Section: Технико-технологические инновации
Article in issue: 2 (21), 2016.
Free access
The concept of the entropy of spatial-energy interactions is used similarly to the ideas of thermodynamics on the static entropy. The idea of entropy appeared on the basis of the second law of thermodynamics and ideas of the adduced quantity of heat. Such rules are general assertions independent of microscopic models. Therefore, their application and consideration can result in a large number of consequences which are most fruitfully used in statistic thermodynamics. In this research we are trying to apply such regularities to self-organization assessing the degree of spatial-energy interactions using their graphic dependence in the form of S-lines. The nomogram to assess the entropy of different processes is obtained. The variability of entropic S -line demonstrations is discussed, in biophysical processes and engineering systems, as well.
Self-organization, s-lines, entropy, spatial-energy parameter, biophysical processes, engineering systems, s-кривые
Short address: https://sciup.org/14968424
IDR: 14968424 | UDC: 101.1 | DOI: 10.15688/jvolsu10.2016.2.3
Самоорганизация и энтропические s-кривые
Аналогично представлениям термодинамики о статистической энтропии использовано понятие энтропии для пространственно-энергетических взаимодействий. Само понятие энтропии возникло на основе второго закона термодинамики и представлениях о приведенном количестве теплоты. Эти положения являются общими утверждениями, не зависящими от микроскопических моделей. Поэтому их применение и рассмотрение может иметь большое число следствий, которые наиболее плодотворно используются также статистической термодинамикой. В данном исследовании делается попытка применения таких закономерностей к оценке степени пространственно-энергетических взаимодействий с использованием их графической зависимости и в других областях. Получена номограмма для оценки энтропии различных процессов. Обсуждается многоплановость проявлений энтропии, в том числе в биофизических процессах, экономике и технических системах.
Text of the scientific article Self-organization and entropic s-lines
DOI:
Over 50 years ago at the contest of witty graphs a future academician and director of Institute of Biochemical Physics Prof. N.M. Emanuel draw an S -curve and wrote down only one word – “foster-mother”. Such curve can be frequently found in many processes of chemical kinetics in general regularities of biosystem formation, as well as at the development stages of engineering systems. At the same time, the curves with one or more steps can be seen [8; 9] and each subsystem corresponds to common progressive development of the initial system (Fig. 1).
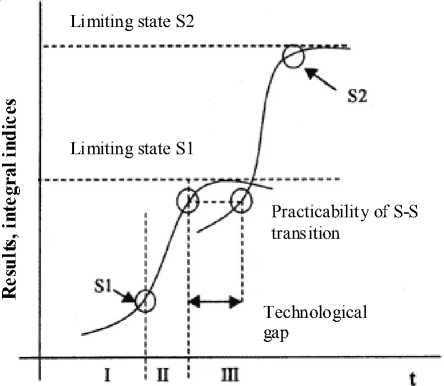
Fig. 1. System transitions by time t
In this Figure the period of “technological gap” corresponds to the transition to a new more rational organizational system. Thus, the process of system self-organization is reflected, which is the main process of structure formation by time. Such systems can comprise live systems at the cellular level or structures formed due to interatomic interactions, e. g. in the process of crystal formation.
“Joint (cooperative) movement of large groups of molecules is common in all phenomena of ordered structure formation during irreversible processes in strongly non-equilibrium systems” [3]. The areas of particles statistically different by their characteristics appear and disappear, i. e. the fluctuation takes place. With such collective interactions the resonance interactions of two or more particles called “bifurcation” are possible. “This process is no longer microscopic and results in macroscopic effect – self-organization” [1].
According to the evolution criterion of Glensdorf-Prigozhin, the speed of change in entropy production, conditioned by the changes in thermodynamic forces, decreases and tends to zero, thus leading to the formation of ordered structures [3].
Consequently, the concept of entropy can be a quantitative and functional characteristic of S -lines.
In statistic thermodynamics the entropy ( S ) of the closed and equilibrious system equals the logarithm of the probability of its definite macrostate:
S = k ln W , (1)
where W – number of available states of the system or degree of the degradation of microstates; k – Boltzmann’s constant.
This correlation is a general assertion of macroscopic character and does not contain any references to the structure elements of the systems considered and it is completely independent of microscopic models [1].
Therefore the application and consideration of these laws can result in a large number of consequences. The thermodynamic probability
W is the main characteristic of the process. The thermodynamic probability equals the number of microstates corresponding to the given macrostate. In actual processes in the isolated system the entropy growth is inevitable – disorder and chaos increase in the system, the quality of internal energy goes down.
Since the system degradation degree is not connected with the physical features of the systems, the entropy statistic concept can also have other applications and demonstrations (apart from statistic thermodynamics).
“It is clear that out of the two systems completely different by their physical content, the entropy can be the same if their number of possible microstates corresponding to one macroparameter (whatever parameter it is) coincides. Therefore the idea of entropy can be used in various fields. The increasing selforganization of human society... leads to the increase in entropy and disorder in the environment that is demonstrated, in particular, by a large number of disposal sites all over the earth” [1].
In this research we are trying to apply the concept of entropy to assess the degree of spatial-energy interactions using their graphic dependence (in the form of S -lines) and in other fields (engineering systems, self-organization).
1. Entropic nomogram of the degree of spatial-energy interactions
The idea of spatial-energy parameter (P-parameter) which is the complex characteristic of the most important atomic values responsible for interatomic interactions and having the direct bond with the atom electron density is introduced on the basis of the modified Lagrangian equation for the relative motion of two interacting material points [2].
The value of the relative difference of P -parameters of interacting atoms-components – the structural interaction coefficient a is used as the main quantitative characteristic of structural interactions in condensed media:
α=
P 1 - P 2
( P 1 + P 2 ) / 2
100%
Based on this equation the maximum effectiveness of structural conformations takes place at paired interaction under the condition of approximate equality of parameters Р 1 and Р 2 that corresponds to the resonance state of this process.
Applying the reliable experimental data we obtain the nomogram of structural interaction degree dependence (ρ) on coefficient a, the same for a wide range of structures (Fig. 2). This approach gives the possibility to evaluate the degree and direction of the structural interactions of phase formation, isomorphism and solubility processes in multiple systems, including molecular ones.
Such nomogram can be demonstrated [2] as a logarithmic dependence:
α = β (ln ρ ) - 1, (3)
where coefficient β – the constant value for the given class of structures. β can structurally change mainly within ± 5 % from the average value. Thus coefficient β is reversely proportional to the logarithm of the degree of structural interactions and therefore can be characterized as the entropy of spatial-energy interactions of atomic-molecular structures.
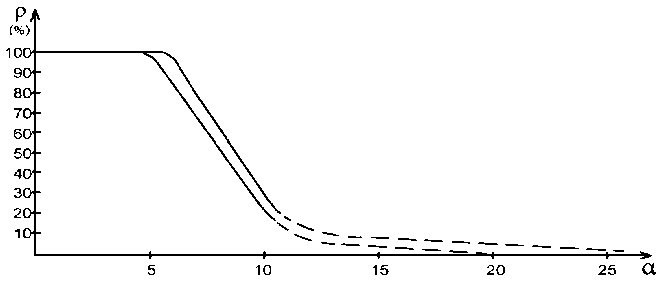
Fig. 2. Nomogram of structural interaction degree dependence ( ρ ) on coefficient α
Actually the more is r, the more probable is the formation of stable ordered structures (e. g. the formation of solid solutions), i. e. the less is the process entropy. But also the less is coefficient a.
The equation (3) does not have the complete analogy with Boltzmann’s equation (1) as in this case not absolute but only relative values of the corresponding characteristics of the interacting structures are compared which can be expressed in percents. This refers not only to coefficient a but also to the comparative evaluation of structural interaction degree (p), for example – the percent of atom content of the given element in the solid solution relatively to the total number of atoms. Therefore in equation (3) coefficient k = 1.
Thus, the relative difference of spatial-energy parameters of the interacting structures can be a quantitative characteristic of the interaction entropy: a S .
2. Entropic nomogram of surface-diffusive processes
As an example, let us consider the process of carbonization and formation of nanostructures during the interactions in polyvinyl alcohol gels and metal phase in the form of copper oxides or chlorides.
The values of the degree of structural interactions from coefficient a are calculated,
i. e. p2 = f ^^ J — curve 2 given in Fig. 3. Here, the graphical dependence of the degree of nanofilm formation (to) on the process time is presented by the data from [4] – curve 1 and previously obtained nomogram in the form
3. Nomograms of biophysical processes
( J
P i = f ^ К J - curve 3.
The analysis of all the graphical dependencies obtained demonstrates the practically complete graphical coincidence of all three graphs: to = f ( t ), P i = f (^/ J , p 2 = f (^/ J with slight deviations in the beginning and end of the process. Thus, the carbonization rate, as well as the functions of many other physical-chemical structural interactions, can be assessed via the values of the calculated coefficient a and entropic nomogram.
-
1) On the kinetics of fermentative processes:
The formation of ferment-substrate complex is the necessary stage of fermentative catalysis... At the same time, n substrate molecules can join the ferment molecule [6, p. 58].
For ferments with stoichiometric coefficient n not equal one, the type of graphical dependence of the reaction product performance rate (ц) depending on the substrate concentration (с) has [6] a sigmoid character with the specific bending point (Fig. 4).
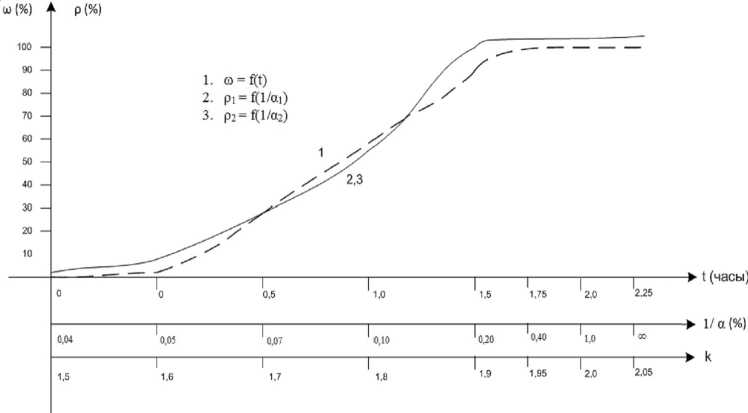
Fig. 3. Dependence of the carbonization rate on the coefficient a
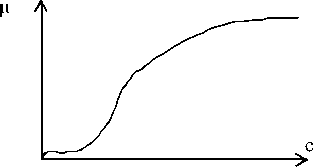
Fig. 4 . Dependence of the fermentative reaction rate ( ц ) on the substrate concentration (с)
“have the form of Lorentz curve” [5]. In this graph, the fluctuation spectral density (p) is plotted on the coordinate axis, and the frequency logarithm function (logo) - on the abscissa axis.
The type of such curve also corresponds to the entropic nomogram in Fig. 2.
4. Lorentz curve of spatial-time dependence
In Fig. 4 we can see that this curve generally repeats the character of the entropic nomogram in Fig. 3.
The graph of the dependence of electron transport rate in biostructures on the diffusion time period of ions is similar [6, p. 278].
In the methodology of P -parameter, a ferment has a limited isomorphic similarity with substrate molecules and does not form a stable compound with them, but, at the same time, such limited reconstruction of chemical bonds which “is tuned” to obtain the final product is possible.
-
1) Dependence of biophysical criteria on their frequency characteristics:
a) the passing of alternating current through live tissues is characterized by the dispersive curve of electrical conductivity – this is the graphical dependence of the tissue total resistance (z-impedance) on the alternating current frequency logarithm (log o). Normally, such curve, on which the impedance is plotted on the coordinate axis, and logo - on the abscissa axis, formally, completely corresponds to the entropic nomogram (Fig. 2);
b) the fluctuations of biomembrane conductivity (conditioned by random processes)
5. S-curves (“life lines”)
In Lorentz curve [10] the space-time graphic dependence (Fig. 5) of the velocity parameter (q) on the velocity itself (b) is given, which completely corresponds to the entropic nomogram in Fig. 3.
Already in the last century some general regularities in the development of some biological systems depending on time (growth in the number of bacteria colonies, population of insects, weight of the developing fetus, etc.) were found [8; 9]. The curves reflecting this growth were similar, first of all, by the fact that three successive stages could be rather vividly emphasized on each of them: slow increase, fast burst-type growth and stabilization (sometimes decrease) of number (or another characteristic). Later it was demonstrated that engineering systems go through similar stages during their development. The curves drawn up in coordinate system where the numerical values of one of the most important operational characteristics (for example, aircraft speed, electric generator power, etc.) were indicated along the vertical and the “age” of the engineering system or costs of its development along the
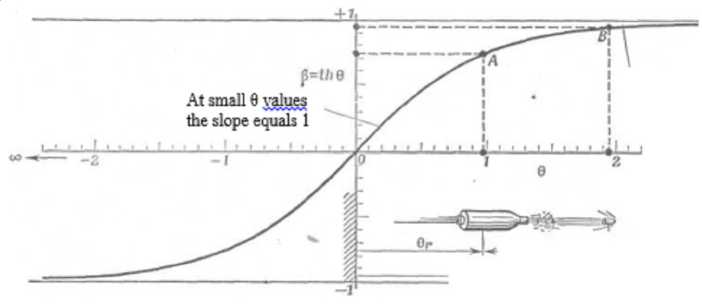
Fig. 5. Connection between the velocity parameter 0 and velocity itself p = th ©
horizontal, were called S -curves (by the curve appearance), and they are sometimes also called “life lines”.
As an example, the graph of the changes in steel specific strength with time (by years) is demonstrated [8] (Fig. 6).
Thus, the similarity between S -curves and entropic nomogram in Fig. 3 is observed.
And in this case, the same as before, the time dependence ( t ) is proportional to the entropy reverse value (1/α).
6. Entropic transitions in physiological systems
In actual processes the resources often come to an end not because the system spent them, but because the new system appeared which starts to more effectively perform the similar function and attracts the resources to itself [9] (Fig. 1).
This is characteristic not only for short-term acting processes but also for general development of interstructural and cellular interactions.
It is much more complicated to consider and mathematically analyze heteromorphic and rather dynamic intercellular and cellular-cellular interactions.
Neurogenesis can serve as an example of such structural transformations in the organization of biological system [11]. In particular, let us consider the neurogenesis on the example of motor nucleus of trifacial nerve. It is know that on the 10-12th day of embryogenesis rats are characterized by high mitotic activity. In this period the afterbrain is composed of externally isomorphic populations of medulloblasts different on molecular and submolecular levels. During the indicated period, the size and shape of cells are approximately the same and variety of sizes of cellular populations in mantle layer is limited. From the 12th day the processes of neuroblast immigration become activated that are followed by the end of their proliferative activity and activation of axon growth.
At this moment, the entropy is demonstrated in dividing the cell groups into mitotically active populations and neuroblasts with different number of arms, which stopped splitting. As a result, at the moment of birth the variety of sizes of nerve cells reach considerable values from 7-8 mcm in diameter in small neurons and neuroblasts and up to 25-30 mcm in large neurons. The differences are also revealed in the number of arms, degree of morphological maturity of nerve cells. By the age of 9 months a pubertal animal demonstrates the stagnation processes with externally rich variety of neurons inside the nucleus. This tendency of anti-entropy growth proceeds in accordance with Fig. 2 and is demonstrated in Table. The factors are compared with a pubertal rat. At the same time, there are vividly expressed methods inside each population with the distribution curve close to a normal one.
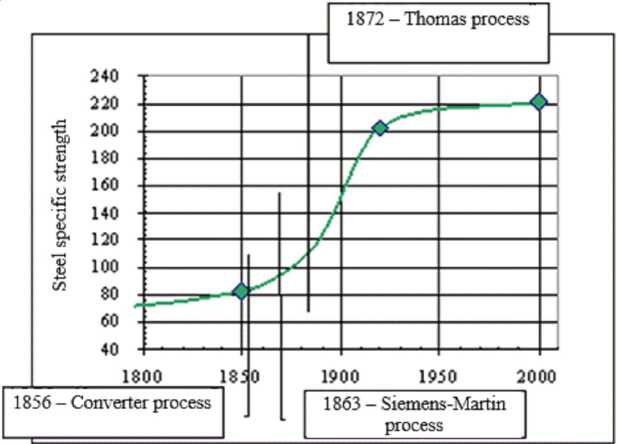
Fig. 6. Dependence of steel specific strength on time
Ratio of types of neuroblastic cells in motor nucleus of trifacial nerve for medium rats (M ± m)
|
Development periods |
Percentage of cell type ratio |
|
Newly born |
59,0 ± 2,6 *** |
|
1 week |
67,4 ± 3,2 *** |
|
1 month |
40,8 ± 3,2 *** |
|
Pubertal |
26,6 ± 2,3 |
Thus, in a complex biological object – a mammal brain – the moments in the development of cellular populations are found when the significant dispersion is observed followed by temporary manifestations of entropy increase, which is in compliance with node points of accelerated development and transition to new qualitative change in the population composition (Fig. 1).
It is the increase in the structure variety, and thus, controllable transient enhancement of the system chaotic character that can be the basis initiating the transition to new states, to the development of certain cells, cell populations in general (in accordance with Fig. 1).
Apparently, the self-organizing processes generally follow the same principle: slow development from the structural variety, fast growth and stabilization of the renewed biosystem. In such way the nature is struggling with entropy development in organism, maintaining it on the constant level as the main condition of stationary state.
Conclusion
Entropic S -lines have two variants: the first (Fig. 2) characterizes the entropy growth with the decreased efficiency of conformation interactions, and the second (Figs. 3, 4) corresponds to the changes in process indexes with the increased anti-entropy (1/ S ).
It is known that the entropy of isolated systems does not decrease. The entropy growth in open systems is compensated by the negative entropy due to the interaction with the environment. All the above systems can be considered as open ones. This also refers to spatial-energy processes, when any changes in dimensional energy characteristics are conditioned by the interaction with external systems.
It is obviously observed in engineering and technological systems, the dynamics development of which is followed by additional innovations, modifications and financial investments.
The entropy in thermodynamics is considered as the measure of nonreversible energy dissipation. From the point of technological and economic principles, the entropy is mainly the measure of irrational energy resource utilization. With the time dependence increase, such processes stabilize in accordance with the nomogram to more optimal values – together with the growth of anti-entropy, i. e. the value 1/α = 1/ρ.
The similar growth with time of rationality of technological, economic and physical and chemical parameters proves that such nomograms are universal for the majority of main processes in nature and technology.
General conclusion
Entropic S -lines have diversified manifestation in self-organization, in physical and chemical, engineering and other natural processes that is confirmed by their nomograms.
References Self-organization and entropic s-lines
- Bakhracheva Yu.S. Operativnaya otsenka sklonnosti materialov k khrupkomu razrusheniyu pri staticheskom i tsiklicheskom nagruzhenii: dis.... kand. tekhn. nauk . Velikiy Novgorod, 2004. 126 p.
- Bakhracheva Yu.S. Otsenka vyazkosti razrusheniya staley po rezultatam kontaktnogo deformirovaniya. Vestnik Volgogradskogo gosudarstvennogo universiteta. // Seriya 10, Innovatsionnaya deyatelnost. 2012. № 7. P. 53 DOI: 10.15688/jvolsu10.2012.2.9
- Bochkarev A.I., Bochkareva T.S., Saksonov S.V. Concept of modern natural science. Textbook. Tolyatti. Available at: http://allrefs.net/c12/4e3ae/p94.
- Gribov L.A., Prokofyeva N.I. Basics of physics. Мoscow, Vysshaya shkola Publ., 1992. 430 p.
- Kodolov V.I., Khokhriakov N.V., Trineeva V.V., Blagodatskikh I.I. Activity of nanostructures and its manifestation in nanoreactors of polymeric matrixes and active media. Chemical physics and mesoscopy, 2008, vol. 10, no. 4, pp. 448-460.
- Structures Formation. Brill Academic Publishers and VSP, Netherlands, 2005. 426 р. (Monograph).
- Kuzin A.V., Vasilyev Yu.G., Chuchkov V.M., Shorokhova T.G. Ensemble interactions in central nerve system. Izhevsk, Berlin, ANK Publishers, 2004. 160 p.
- Kynin А.Т., Lenyashin V.A. Evaluation of parameters of engineering systems with growth curves. Available at: http://www.metodolog.ru/01428/01428.html.
- Lyubomir sky А., Litvin S. Laws of engineering system development. Available at: http://www.metodolog.ru/00767/00767.html.
- Rubin A.B. Biophysics. Book 1. Theoretical biophysics. Мoscow, Vysshaya shkola Publ., 1987. 319 p.
- Rubin A.B. Biophysics. Book 2. Biophysics of cell processes. Мoscow, Vysshaya shkola Publ., 1987. 303 p.
- Taylor E., Wheeler J. Spacetime physics. Мoscow, Mir Publishers, 1987. 320 p.
