Self-organizing feature map and k-means algorithm with automatically splitting and merging clusters based image segmentation

Author: Tamanna Yesmin Rashme, Mohammed Nasir Uddin
Journal: International Journal of Image, Graphics and Signal Processing @ijigsp
Article in issue: 10 vol.10, 2018.
Free access
Image segmentation plays the significant roles in image processing, computer vision and as well as in pattern recognition. The Segmentation process subdivides an image into its constituent parts or objects, such that level of subdivision depends on the problem to be solved. The aim of image segmentation is partitioning an image within homogeneous regions that are significantly meaningful concerning some characteristics like intensity or texture. Based on clustering, a large number of researches have been done in the area of image segmentation. This paper presents an efficient image segmentation method in which the self organizing feature map (SOFM) is used for initial segmentation. After the initial segmentation, the segmented image is used by the K-means algorithm for further segmentation. Finally, the procedures for automatic splitting and merging the cluster are applied to obtain the appropriate number of segments in segmented image and as well as better segmented results. For analyzing the performance, we calculate the statistical measure named as Davies-Bouldin index (DB-index). The observation shows that, this method gives the better segmented results compared with K-Means algorithm, linear discriminant analysis (LDA) and K-Means based image segmentation method and also SOFM and K-Means based image segmentation approach.
K-Means, Self Organizing Feature Map, DB-Index, Automatic Splitting and Merging
Short address: https://sciup.org/15016005
IDR: 15016005 | DOI: 10.5815/ijigsp.2018.10.07
Text of the scientific article Self-organizing feature map and k-means algorithm with automatically splitting and merging clusters based image segmentation
For human interpretation the enhancement of pictorial information and processing of image data for storage, transmission and depiction for autonomous machine perception are two principal application areas of image processing methods. Segmentation refers to the process of discovering the superior positions of the shape factors reliable with arrival records. More precisely image segmentation provides the way of technology which decomposes the image into a sequence of significant and characteristics regions to extract the concerned targets in image[15,16]. The main motivation behind the image segmentation is to lessen the information for the easy scrutiny of the image for several purposes. Some of the realistic example of image segmentation includes locate tumors and other pathologies in medical imaging, video surveillance, measurement of the tissue volume, object detection and recognition, object tracking in satellite images, and so on[6].
Several researchers have been extensively worked to develop the better image segmentation method. Tian, X., and Yu, W.,[3], proposed an algorithm for image segmentation by the watershed transform and feature clustering. Initially, input image is preprocessed to restrain the noise and smooth the fin details. Then, to obtain the segmentation of image into watershed regions a marker-based watershed transform is applied on the preprocessed image. Finally, for clustering the watershed regions into the ultimate segmentation the mean shift algorithm is exploited. The experimental results have shown that their proposed algorithm provides better results compared with the state of the art works. Pham, V. H., and Lee, B. R.,[5], proposed a hybrid algorithm for image segmentation based on split and merge approach to detect fruit defect. In their approach, K-means algorithm is used for splitting the original image into region based on Euclidean color distance in L∗a∗b space that fabricate an over segmentation result. After that, graph depiction minimum spanning tree has been used for iteratively merge the related regions into new homogenous ones. The experimental result shows that their proposed approach provide good outcomes in terms of human observation and processing time to make use of the local and global characteristic of image. Halder, A., et al. [6], proposed a technique in which self-organizing feature map (SOFM) is used for initial segmentation of the image in unsupervised manner. Then the sampled image pixels of the segmented image are used for better segmented results through the linear discriminant analysis (LDA).
The experimental results have shown that proposed technique outperforms many other clustering based image segmentation methods.
In this paper, we proposed an efficacious image segmentation method based on unsupervised learning approaches. In our proposed method, initial segmentation of the image is performed by self organizing feature map (SOFM). Finally to get the better segmented results with appropriate number of segments, the K-Means algorithm and the procedures of automatic splitting and merging cluster are applied. The analytical observations indicate that our proposed method performs favorably against the currently available benchmarks.
The remainder of the paper is organized as follows. In section Ⅱ, a review of the necessary background required to effectively implement our algorithm is presented. The proposed algorithm is described in Section Ⅲ. After that, application of the proposed algorithm is discussed in section Ⅳ, and we draw our conclusion in the last section.
-
II. Background
Image segmentation provide a process for an image to be partitioned into distinct regions[4]. For images a huge diversity of diverse segmentation approaches have been developed and for image analysis image segmentation plays an important role. To obtain desired segmented image the whole image can be splitted or large number of small regions can be merged together until a precise condition is fulfilled. In this paper for segmenting the image Self Organizing Feature Map (SOFM) and K-Means algorithm are applied. The procedures of automatically splitting and merging the clusters are applied to obtain the efficient segmentation with the optimal number of segments in the segmented image. For statistical measurement of different image segmentation methods for images Davies-Bouldin Index (DB-Index) has used.
-
A. Self Organizing Feature Map
Self organizing feature map is a type of unsupervised neural network model. The major two categories it consists are reduced dimension of data and grouped together the samples which are similar. The central property of the self organizing feature map is to transform an incoming signal pattern of arbitrary dimension into a one or two dimensional discrete map and to carry out this transformation adaptively in a topologically ordered manner.
The self organizing feature map consists of an input layer and an output layer. Let m be the dimension of the input space and an input pattern is denoted as X = {xx, x2, X3.......xm } . Let the synaptic weight vector for an output neuron j is denoted by Wj = {w, 1,Wj2,Wj3,......wjm} where j = 1,2,3,.....,l and l is the total number of neurons in the output layer. If the synaptic weight vector Wk of neuron к is the best fitted one with the input pattern X then the error ek is defined as follows:
e k = argmin| X - W ||, j = 1,2,.... l (1)
The neuron k is then called the wining neuron for the input pattern X . Let hj ^( n ) be the topological neighborhood function which indicates the influence of the winning neuron k to its topological neighbor j at epoch number n and likewise dj k denotes the lateral distance between the winning neuron k and its neighbor j .The neighborhood function h ( nn ) is defined in such a way that it attains the maximum value at the winning neuron k for which d is zero and decreases monotonically with increasing the lateral distance d . Typically, the neighborhood function h ( nn ) is denoted as follows:
h j , k ( n ) = exp
j ,
2 ^ 2 ( n ) ,
Where cr(n ) represents the width of the topological neighborhood at epoch n .When the epoch number n increases, the width cy(n ) decreases at an exponential rate and the topological neighborhood shrinks in a corresponding manner. The updating process of the synaptic weights can be accomplished by the following equation:
Wj (n + 1) = (Wj (n) + n (n) hj,k (n) X - Wj (n)) (3)
Where j is the excited neuron, k is the winning neuron and n ( n ) is the learning rate. The updating process moves the weight vector W towards the input pattern
——
X . So presenting repeatedly the training patterns tries to make the synaptic weight vectors tend to follow the ordination of the input patterns[7,8,9].
-
B. K-Means Algorithm
K-Means is the well known cluster analysis algorithm that aims is to find the correct approximation which minimizes the sum of the criterion .
k
J=ZZIк-m, Il (4)
j=1 PESj where, x is a vector representing the pth ata point and
^ is the geometric centriod of the data pints in Sj [10].The objective of K-Means clustering is to partition n objects into k clusters, each of them define its center. The method initializes cluster centroids where data points are selected randomly. After that data points are iteratively assigns to their closet cluster and the centroids to the mean of the respective data points [11, 12].
The algorithm is composed of the following steps:
-
i. For the dataset X = { x I " initialize the number
p p = 1
of cluster k .
-
ii. Select k initial cluster centers in some random manner, denoted by { mt } k t.
-
iii. Allocate each data object in the dataset to the center of the cluster to which the data object is neighboring mostly, denote.
c-={ xp :l x - mi hlx - m II,1 - j - k} (5)
-
iv. For each cluster, calculate the mean value of the data objects and updating the centers of the clusters respectively.
-
v. Step (iii) and step (iv) are repeated until the convergence criterion is satisfied.
-
C. Automatic Splitting and Merging of Clusters
As we all known, intra-cluster dissimilarity should be as small as possible and inter-cluster dissimilarity should be as big as possible. The inter-cluster dissimilarity should be greater than the intra-cluster dissimilarity [10]. In the extreme case, the minimum inter-cluster dissimilarity equals to the maximum intra-cluster dissimilarity. Therefore, we propose the idea that two clusters should be merged when the dissimilarity between the two clusters is less than the minimum inter-cluster dissimilarity. Similarly, one cluster should be split into two clusters when the dissimilarity of the cluster is greater than the maximum intra-cluster dissimilarity.
In the proposed method, we need to compare the intracluster dissimilarity and inter-cluster dissimilarity with ^ (minimum inter-cluster dissimilarity or maximum intracluster dissimilarity). Figure.1 shows the empirical observation which reveals that, if we consider the value greater than ^ with comparison to the intra-cluster dissimilarity and inter-cluster dissimilarity for splitting and merging the clusters respectively, then the proposed method yields to inconsistent and/or inefficient clustering outcomes. The observation is done through different images and the statistical measurement known as Davies-Bouldin Index (DB-Index) [14].
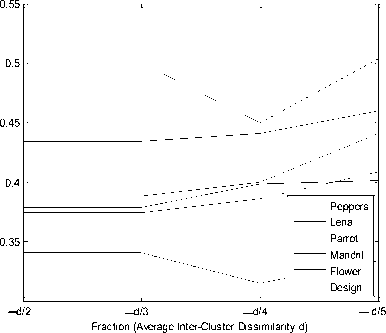
f ig .1. e xploration for effectiveness of splitting and merging factor .
The procedures of automatically splitting and merging of clusters are formalized as follows:
-
a. Procedure for Splitting Clusters:
-
i. Estimate the average inter-cluster dissimilarity using the following equation:
mm
d=4HIki-qj II m i=1 i=1
where the cluster centers are represented by q and q , number of clusters is represented by m .
-
ii. For each cluster, estimate the intra-cluster dissimilarity d using the following equation:
d int ra =[ max {| q , - x p |} + min {| \q- x p || ] (7)
Where q represents the center of the i cluster and x represents the data in the particular cluster.
-
iii. If d ^ d , then the cluster need to be splitted
into two clusters. The two initial cluster centers are chosen as the nearest and utmost values of the data with respect to the corresponding center of the cluster.
-
iv. Updated the centers of the cluster and the number of the clusters m .
-
v. If m remains the unchanged, stop. Otherwise back to step C. a. ( i) .
-
b. Procedure for Merging Clusters:
-
i. Estimate the average inter-cluster dissimilarity d by the equation which is mentioned in the procedure for splitting clusters.
-
ii. For each cluster center, estimate the inter-cluster dissimilarity between the cluster center and any other cluster center by the following equation:
d in ra =| \q.- q j\\ (8)
Where q and q represent the centers of i and j clusters respectively.
-
iii. The clusters need to be merged if d t ( d .
-
iv. Updated the number of the clusters m and the
cluster centers.
-
v. If m remains the equivalent, stop. Otherwise, back to step C. b. (i).
Until both the splitting and merging procedures of clustering produce the equal number of clusters which is essential for the efficient clustering of data, both these procedures would be functional continually.
-
III. Proposed Method
In the proposed method, at first read the 2D input image and initialize the number of clusters. The initial cluster centroids should be selected in such a way that every centroid is far away from each other. With these initial cluster centroids, Self Organizing Feature Map (SOFM) is then applied over the extracted data to perform the initial image segmentation. After initial segmentation, the updated centroids matrix of clusters is obtained. The input image is then preprocessed. Subsequently, using the updated centroids matrix as the initial cluster centers, the K-means algorithm is applied over the preprocessed input image for further segmentation. Finally, the procedures of automatically splitting and merging of clusters are applied to achieve the optimal number of segments in the segmented image as well as more effective image segmentation.
The proposed algorithm is formalized as follows:
-
i. Read the 2D image.
-
ii. Initialize the number of clusters and select the initial cluster centers in some appropriate manner.
-
iii. Apply self organizing feature map (SOFM) for initial segmentation and get the updated cluster centroids.
-
iv. With the updated centroids, apply the K-means algorithm over the preprocessed input image to obtain the updated clusters.
-
v. Apply the procedures II.C.a and II.C.b forautomatically splitting and merging of clusters to obtain the optimal number of segments in the
segmented image and as well as more efficient clustering result.
-
vi. Finally, produce the segmented image using the utmost clustering result.
The flow chart of the proposed method is formalized through the following figure:
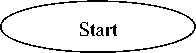
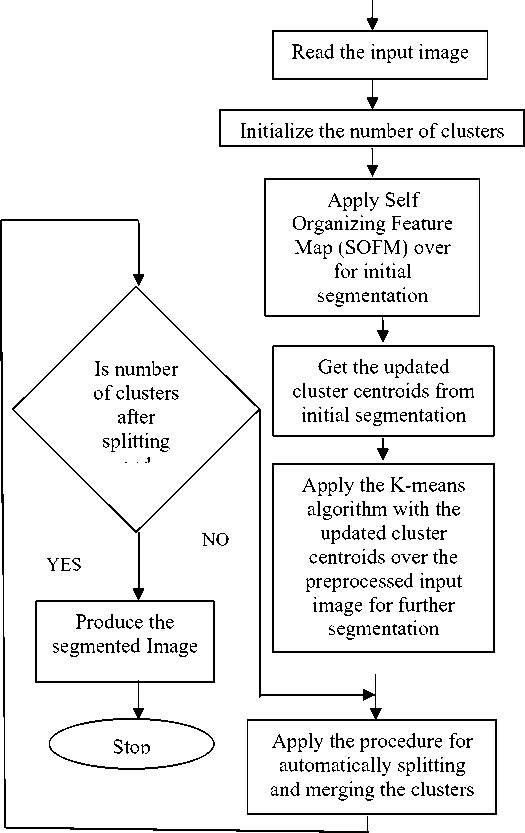
Fig.2. Flow chart of the Proposed Method
-
IV. Experimental Criterion and Results Analysis
This section describes the performance of different clustering based image segmentation methods which is advantageous to evaluate the quantitative results of image segmentation and the statistical criterion known as Davies-Bouldin index (DB-index) is used to evaluate the performance of different image segmentation methods. The proposed method is applied on natural images where clusters values are between 3 to 8. A line graph has also showed to compare the results of images after applying the proposed method.
-
A. Davies-Boudlin Index
To analyze the performance of different clustering based image segmentation methods, it is desirable to assess the quantitative of image segmentation. For this function, to evaluate the performance of different image segmentation methods Davies-Bouldin index (DBI) is used for the statistical criterion.
The DBI measure is based on the proportion of within-cluster and between-cluster intervals. The DBI is defined as follows:
k
DBI = S max y * x H, y } (9)
k x = 1
Where CT ., is the proportion of within-to-between x,y cluster distance for x and y cluster k is used to represent the clusters number.
In mathematical terms, CT „ is defined as, x,y
П , y
5' x + 5' y 5.
(d)
(e)
Where S' * is represented the average distance among each data in the x th cluster and the core of the x th cluster, is represented the average distance among each data in the y t h cluster and the core of the y th cluster and 8 xy is shown the Euclidean distance among the centers of the and y th clusters. The utmost value of a x-y represents worst case for cluster x within-to-between cluster proportion. The finest clustering solution has the nominal value of the DBI that indicates, the lower the value, represent the superior the separation of the clusters and the tightness within the clusters [6,13,14].
To perform experimental analysis we used MATLAB 8.0 (R2012b) which in windows-7 operating system and processed in 32-bit, core i3 2.40 GHz, 4GB RAM.
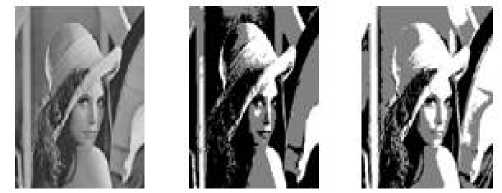
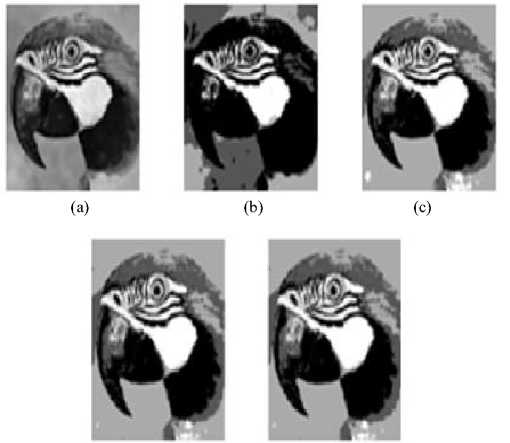
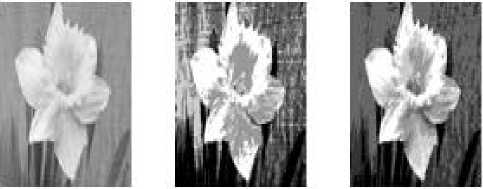
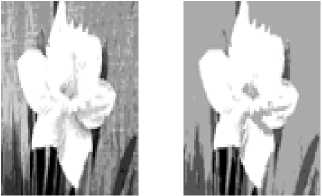
Fig. 3, Fig. 4 and Fig. 5 show the segmented outcomes of Leena, Parrot and Flower Images using K-Means algorithm, LDA and K-Means based image segmentation method, SOFM and K-Means based image segmentation method and the proposed method.
(a) (b) (c)
Fig 3. Segmentation of Leena image using different approaches (a) Original image (b) K-Means (c) LDA and K-Means (d) SOFM and K-Means (e) Proposed method
(d) (e)
Fig 4. Segmentation of Parrot image using different approaches (a) Original image (b) K-Means (c) LDA and K-Means (d) SOFM and K-Means (e) Proposed method
(a) (b) (c)
(d) (e)
Fig 5. Segmentation of Flower image using different approaches (a) Original image (b) K-Means (c) LDA and K-Means (d) SOFM and K-Means (e) Proposed method
The proposed method have experimented on various natural images with 3 to 8 number of clusters and also compared with diverse segmentation techniques by calculating Davies-Bouldin index (DBI) which is shown on Table 1(a) and Table 1(b) for representation of superior analysis.
Table 1(a). Comparison of different methods.
|
У М Я 8 |
о £ Z 2 3 1 S "5 |
i |
S F |
= 2 §С |
Й ° 2 5 у у 2 § v |
Q |
|
cd |
3 |
K-Means |
× |
× |
3 |
0.4017 |
|
LDA and K-Means |
× |
× |
3 |
0.4015 |
||
|
SOFM and K-Means |
× |
× |
3 |
0.4288 |
||
|
Proposed |
√ |
× |
5 |
0.3884 |
||
|
У У Он |
8 |
K-Means |
× |
× |
8 |
0.5087 |
|
LDA and K-Means |
× |
× |
8 |
0.5082 |
||
|
SOFM and K-Means |
× |
× |
8 |
0.4959 |
||
|
Proposed |
× |
√ |
4 |
0.4338 |
Table 1(b). Comparison of different methods.
|
У м я 8 |
о £ Z 2 S ‘S |
i |
^£ ^° |
Й ° у у $85 и = « |
а Q |
|
|
о Е |
6 |
K-Means |
× |
× |
6 |
0.5047 |
|
LDA and K-Means |
× |
× |
6 |
0.5004 |
||
|
SOFM and K-Means |
× |
× |
6 |
0.4960 |
||
|
Proposed |
× |
√ |
4 |
0.3742 |
||
|
5 |
5 |
K-Means |
× |
× |
5 |
0.5128 |
|
LDA and K-Means |
× |
× |
5 |
0.5041 |
||
|
SOFM and K-Means |
× |
× |
5 |
0.4998 |
||
|
Proposed |
× |
× |
5 |
0.4998 |
||
|
Он |
4 |
K-Means |
× |
× |
4 |
0.3991 |
|
LDA and K-Means |
× |
× |
4 |
0.3827 |
||
|
SOFM and K-Means |
× |
× |
4 |
0.3784 |
||
|
Proposed |
× |
× |
4 |
0.3784 |
||
|
.^ Q |
4 |
K-Means |
× |
× |
4 |
0.3404 |
|
LDA and K-Means |
× |
× |
4 |
0.3994 |
||
|
SOFM and K-Means |
× |
× |
4 |
0.3996 |
||
|
Proposed |
√ |
× |
5 |
0.3712 |
Our proposed method automatically splits the cluster from 3 to 5 and from 4 to 5 respectively for Leena and Design images, whereas proposed method merges the cluster of Flower and Peepers images from 6 to 4 and from 8 to 4 respectively. Neither splitting nor merging occurs For Parrot and Mandrill images by the proposed method.
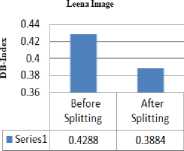
The scatter diagram of Leena image before splitting the cluster has shown in Fig. 6 in which the segmented images are formed by SOFM and K-Means based image segmentation method and through the proposed method Fig. 7 shows scatter diagram of the segmented Leena image after splitting the clusters.
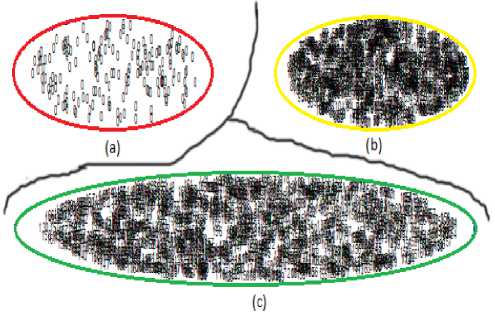
Fig.6. Scatter diagram for segmented Leena image before splitting the clusters. (a) Cluster no 1: Data Range(0-0) (b) Cluster no 2: Data Range(50-125) (c) Cluster no 3: Data Range(126-249)
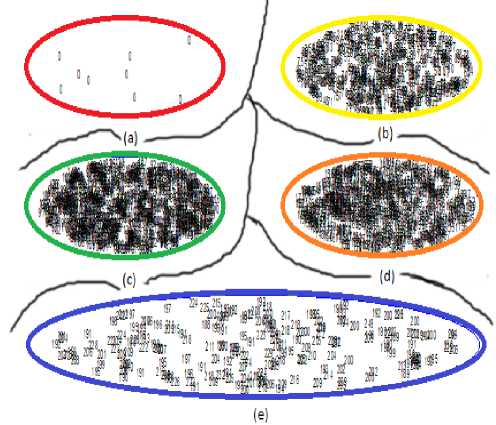
Fig.7. Scatter diagram for segmented Leena image after splitting the clusters. (a) Cluster no 1: Data Range(0-0) (b) Cluster no 2: Data Range(31-90) (c) Cluster no 3: Data Range(91-143) (d) Cluster no 4:
Data Range(144-187) (e) Cluster no 5: Data Range(188-249)
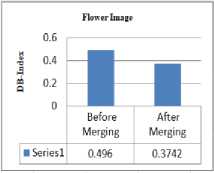
The scatter diagram of Flower image before merging the cluster has shown in Fig. 8 in which the segmented images are formed by SOFM and K-Means based image segmentation method and through the proposed method Fig. 9 shows scatter diagram of the segmented Leena image after merging the clusters.
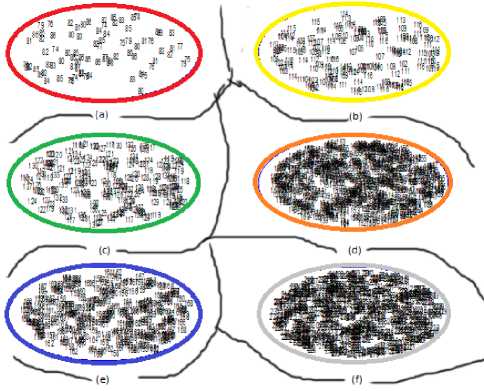
Fig.8. Scatter diagram for segmented Flower image before merging the clusters. (a) Cluster no 1: Data Range(0-86) (b) Cluster no 2: Data Range(87-116) (c) Cluster no 3: Data Range(117-137) (d) Cluster no 4: Data Range(138-155) (e) Cluster no 5: Data Range(156-190) (f) Cluster no 6: Data Range(191-254

Fig.10. Scatter diagram for segmented Parrot image. (a) Cluster no 1: Data Range(0-0) (b) Cluster no 2: Data Range (50-120) (c) Cluster no 3:
Data Range(121-184) (d) Cluster no 4: Data Range(185-255)
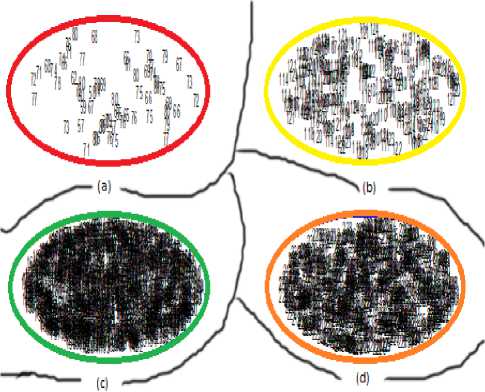
Fig.9. Scatter diagram for segmented Flower image after merging the clusters. (a) Cluster no 1: Data Range(0-80) (b) Cluster no 2: Data Range(81-124) (c) Cluster no 3: Data Range(125-181) (d) Cluster no 4:
Data Range(182-254)
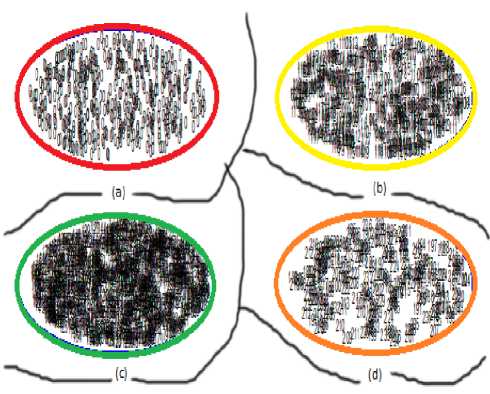
Fig.11. Scatter diagram for segmented Parrot image. (a) Cluster no 1: Data Range(0-0) (b) Cluster no 2: Data Range(50-120) (c) Cluster no 3:
Data Range(121-184) (d) Cluster no 4: Data Range(185-255)
The scatter diagram of Parrot image has shown in Fig. 10 in which the segmented images are formed by SOFM and K-Means based image segmentation method and through the proposed method Fig. 11 shows scatter diagram of the segmented Parrot image. But neither splitting nor merging occurs for Parrot image as a result number of clusters remain same for both situations.
The line graphs has showed for the images of Leena, Flower and Parrot to represent the differentiate between the DB-index values of two circumstances where Leena image is splitted , Flower image is merged but neither splitting nor merging occurs for Parrot image.
(a)
(b)
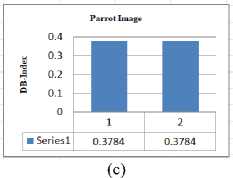
Fig.12. Graphical representation of DB_index value obtained by SOFM and K-Means based segmentation method and proposed method (a) Leena Image (b) Flower Image (c) Parrot Image
-
V. Conclusion
This works represents an efficient image segmentation method that can determine the appropriate number of segments in the segmented image. In this paper, different clustering based image segmentation methods such as K-Means algorithm, LDA and K-Means based segmentation method, SOFM and K-Means based segmentation method are used to compare with the proposed method. And the outcomes of the segmentation shows that proposed method gives better quality of the segmented image compared with different clustering based image segmentation method. The proposed method is capable for automatically splitting and merging the clusters or segments of image if it is required where other methods cannot. The experimental results have explored that the proposed method is much more effective and efficient to produce the segmented image in respect of quantitative performance metrics. In future this proposed method can be used on MRI, CT and Satellite Images etc with numerous objects.
This paper is fully supported by the department of Computer Science and Engineering, Jagannath University, Bangladesh.
feature map and linear discriminant analysis based image segmentation ”, In Futuristic Trends on Computational Analysis and Knowledge Management, International Conference on IEEE, pp. 394-399.
-
[7] Dongxiang Chi, “Self-Organizing Map-BasedColor
Image Segmentation with k-Means Clustering and Saliency Map,” ISRN Signal Processing, vol.2011,
Article ID 393891, 18 pages,2011.
-
[17] Er. Anjna, Er. R. Kaur, “Review of Image Segmentation Technique”, Journal of ARCS , Volume 8, No. 4, May 2017.
-
[18] D. M. Ristić, M. Pavlović, and I. Reljin, “Image segmentation method based on self-organizing maps and K-means algorithm,” Neural Network Applications in Electrical Engineering (NEUREL '08) , pp. 27–30, Belgrade, Serbia, Oct. 2008.
-
[19] Yu. H. Wang, “Tutorial-Image Segmentation”, Graduate Institute of Communication Engineering .
-
[20] H.D. Cheng, X.H. Jiang, Y. Sun, et al. “Color image segmentation: advances and prospects”. Pattern
Recognition, 2001, pp. 2259- 2281
-
[21] Haykin. S, 2003, “Neural Networks & Learning Machines”, PHI Learning Pvt. Ltd.
-
[22] B.Sathya, R.Manavalan., 2011,” Image Segmentation by Clustering Methods: Performance Analysis” Volume 29– No.11, September 2011.
-
[23] GONZALEZ, R. C., WOODS, R. E., & EDDINS, S. L. “ Digital Image Processing Using Matlab”, United States: Gatesmark Publishing, 2009.
Authors’ Profiles

Tamanna Yesmin Rashme , is a lecturer at the Department of Computer Science & Engineering, Uttara University, Dhaka- Bangladesh. She completed her B.Sc & M.Sc from the department of Computer Science and Engineering, Jagannath University, Dhaka- Bangladesh. Her research interest include Image Processing, Cyber Security and Digital Forensic.
Her teaching interest also Image Processing. Computer security.

References Self-organizing feature map and k-means algorithm with automatically splitting and merging clusters based image segmentation
- Debasish. C, Goutam. K. Sen, Sugata H. “Image Segmentation Techniques”.
- Rafael C. Gonzalez & Richard E. Woods. Digital Image Processing, Pearson Education, 3rd edition, 2008.
- Tian. X, and Wangsheng. Yu, “Color image segmentation based on watershed transform and feature clustering”, IEEE advanced Con. on IMCEC, Oct. 2016.
- Saka Kezia, I. Santi Prabha, Vakulabharanam Vijaya Kumar,"A Color-Texture Based Segmentation Method To Extract Object From Background", IJIGSP, vol.5, no.3, pp.19-25, 2013.DOI: 10.5815/ijigsp.2013.03.03
- Pham, V.H. and Lee, B.R, “An image segmentation approach for fruit defect detection using k-means clustering and graph-based algorithm”, Vietnam J Comput Sci, Volume 2, Issue 1, pp 25–33, Feb. 2015.
- Halder, A, and S. S. Hassan, 2015, “Self-organizing feature map and linear discriminant analysis based image segmentation”, In Futuristic Trends on Computational Analysis and Knowledge Management, International Conference on IEEE, pp. 394-399.
- Dongxiang Chi, “Self-Organizing Map-Based Color Image Segmentation with k-Means Clustering and Saliency Map,” ISRN Signal Processing, vol. 2011, Article ID 393891, 18 pages, 2011. doi:10.5402/2011/393891.
- T. Kohonen, Self-Organizing Maps, Springer, 3rd edition, 2001.
- J. Vesanto and E. Alhoniemi, “Clustering of the self-organizing map,” IEEE Transactions on Neural Networks, vol. 11, no. 3, pp. 586–600, 2000.
- Liu. J, Guo. L,”An Improved K-means Algorithm for Brain MRI Image Segmentation”, 3rd ICMRA, Jan. 2015.DOI.10.2991/icmra-15.2015.210.
- B. Subbiah, S.C. Christopher,”Image Classification through integrated K- Means Algorithm”, International Journal of Computer Science Issues(IJCSI), Vol. 9, Issue 2, No 2, Mar. 2012.
- Lei. J, Jiang. T, Wu. K, Du. H., Zhu. G, and Wang, Z., 2016, “Robust K-means algorithm with automatically splitting and merging clusters and its applications for surveillance data”, Multimedia Tools and Applications, Vol. 75, Issue 19, pp. 12043-12059.
- Deng. A, Xiao. B, Yuan. H,"Adaptive K-Means Algorithm with Dynamically Changing Cluster Centers and K-Value", Advanced Materials Research, Vols. 532-533, pp. 1373-1377, June 2012.
- Maulik. U, Bandyopadhyay. S, “Performance Evaluation of Some Clustering Algorithms & Validity Indices”. Journal. IEEE transactions on Pattern Analysis and Machine Intelligence, Volume 24,Issue 12, December 2002
- D. L. Davies and D. W. Bouldin. "A Cluster Separation Measure" ,IEEE Transactions on Pattern Analysis and Machine Intelligence, Vol. PAMI1,No.2,1979,pp.224–227.
- Kaur. A, Kumar. R, Kainth. K, “Review Paper on Image Segmentation Techniques ” ,Journal of ARCSSE,Volume 6, Issue 7, July 2016.
- Er. Anjna, Er. R. Kaur, “Review of Image Segmentation Technique”, Journal of ARCS, Volume 8, No. 4, May 2017.
- D. M. Ristić, M. Pavlović, and I. Reljin, “Image segmentation method based on self-organizing maps and K-means algorithm,” Neural Network Applications in Electrical Engineering (NEUREL '08), pp. 27–30, Belgrade, Serbia, Oct. 2008.
- Yu. H. Wang, “Tutorial-Image Segmentation”, Graduate Institute of Communication Engineering.
- H.D. Cheng, X.H. Jiang, Y. Sun, et al. “Color image segmentation: advances and prospects”. Pattern Recognition, 2001, pp. 2259- 2281
- Haykin. S, 2003, “Neural Networks & Learning Machines”, PHI Learning Pvt. Ltd.
- B.Sathya, R.Manavalan., 2011,” Image Segmentation by Clustering Methods: Performance Analysis” Volume 29– No.11, September 2011.
- GONZALEZ, R. C., WOODS, R. E., & EDDINS, S. L. “ Digital Image Processing Using Matlab”, United States: Gatesmark Publishing, 2009.
