Sentiment analysis on mobile phone reviews using supervised learning techniques

Author: Momina Shaheen, Shahid M. Awan, Nisar Hussain, Zaheer A. Gondal
Journal: International Journal of Modern Education and Computer Science @ijmecs
Article in issue: 7 vol.11, 2019.
Free access
Opinion Mining or Sentiment Analysis is the process of mining emotions, attitudes, and opinions automatically from speech, text, and database sources through Natural Language Processing (NLP). Opinions can be given on anything. It may be a product, feature of a product or any sentiment view on a product. In this research, Mobile phone products reviews, fetched from Amazon.com, are mined to predict customer rating of the product based on its user reviews. This is performed by the sentiment classification of unlocked mobile reviews for the sake of opinion mining. Different opinion mining algorithms are used to identify the sentiments hidden in the reviews and comments for a specific unlocked mobile. Moreover, a performance analysis of Sentiment Classification algorithms is performed on the data set of mobile phone reviews. Results yields from this research provide the comparative analysis of eight different classifiers on the evaluation parameters of accuracy, recall, precision and F-measure. The Random Forest Classifiers offers more accurate predictions than others but LSTM and CNN also give better accuracy.
Sentiment Classification, NLP, Opinion Mining, NB-SVM, Random Forest, LSTM, CNN, Phone Reviews
Short address: https://sciup.org/15016864
IDR: 15016864 | DOI: 10.5815/ijmecs.2019.07.04
Text of the scientific article Sentiment analysis on mobile phone reviews using supervised learning techniques
Published Online July 2019 in MECS DOI: 10.5815/ijmecs.2019.07.04
Opinion Mining has become a center of attention for the information retrieval and linguistics. Not only the opinion of whole review but also the expressions and sentiments behind an opinion or a review statement are analyzed through sentiment analysis techniques. The two terminologies we are discussing are; Sentiment Analysis (SA) and Opinion Mining (OM); used in the literature interchangeably many times. However, many authors argued that both Sentiment Analysis and Opinion Mining have slightly dissimilar concepts. When we talk about opinion mining, it analyzes the individuals' feedback or opinion or reviews after extracting those reviews from different platforms. Whereas, when we learn about Sentiment Analysis, it identifies the sentiments, which are expressed through text and then we analyze it. The main objective of Sentiment Analysis is to deduce opinions and ideas.
There are many components used in opinion mining but the three core modules of Opinion Mining are as follows:
The person with his opinions:
Opinion holder is the organization or person that gives the opinion.
Opinion Object: It is a feature on which, opinions are being taken from the person.
Opinion Orientation: It is for the positive, neutral or negative determination (polarity) of an opinion.
For instance, “This mobile was of excellent voice quality”. In the client review, the person with its opinion is the other users who have already wrote the reviews. Now, Voice quality of the mobile phone is the Opinion object. Opinion word is “excellent” which is completely positive. Determination of semantic orientation is a task of concluding whether a sentence or document has either positive or negative orientation[1].
The Sentiment Analysis is used to classify the polarity (positivity or negativity behind the opinion) of the reviews. There are three main categories in sentiments analysis: sentence-level, unit aspect-level and documentlevel Sentiment Analysis. When we perform documentlevel sentiment analysis, then it is expressed as neutral, negative or positive. Further when we study Sentencelevel Emotions Analysis it aims to classify emotions that are expressed in each sentence. The foremost work is to check whether these sentences are objective or subjective. On the off probability, if the sentence is subjective, then the Sentence-level emotional analysis can decide in spite of whether the sentence communicates positive or negative opinion. When we classifying the manuscript at the sentence or document level, it does not offer the important detail that we needed to do suppositions which is required in several applications. In order to extract these details; we have to move towards the feature level.
At the document-level, sentiment classification deals with the sentiments exhibited in whole document through precise features of models. The principal thing is to find the models and their features[2]. Opinion Mining contains a wide range of applications, starting from following the users’ opinions concerning product or concerning political candidates as expressed in on-line forums and for client relationship management[3]. Opinions can be obtained through various ways about many areas like a product or a service. Opinion Mining may be valuable in different ways. For instance, it judges and tracks the success rate of launching a new item or a commercial drive, focuses prevalence of administrations and items with it forms. It also gives us knowledge about demographics of specific characteristics are being liked or hated.
This research is aimed at performing an exploratory analysis of unlocked mobile reviews, collected from Amazon.com, to find out interesting facts, trends, figures and the relationship among different attributes of reviews, such as its length, number of reviews ratings with the price of the mobile phone. This can help the mobile phone manufacturers in decision making for their future products. Moreover, Sentiment Classification Algorithms were executed over this dataset to formally compare the performance of those algorithms, in order to determine the more accurate technique for the sentiment classification of such type of data.
-
A. Objectives and Rationale
Mobile phones have revolutionized the way we purchase products online, making all the information available at our doorstep. As the access to information becomes easier, more and more consumers seek product information from other consumers apart from the information provided by the seller. Reviews and ratings submitted by consumers are examples of such types of information and this has already been an integral part of customer’s buying-decision process. The e-commerce players created platforms for reviews and ratings, which is transparent and help consumer to take the guidance from reviews and ratings given by other consumers that will lead them to take a well-informed decision, thus providing a mental satisfaction to the consumers to take informed decision of purchasing confidently.
These statistical analyses had the following goals, which are:
-
• To perform exploratory analysis of ratings and reviews to find different relationships between reviews and ratings.
-
• To find out association amongst review length and invention rating.
-
• To find out relationship between product price and product rating.
-
• To find the popular brands of mobile phones based on their ratings.
-
• To find the words, which are frequently used in the reviews.
-
• To find which sentiments are mostly expressed by the customers in the reviews.
-
• To find out techniques or classifiers that can help to find these results.
-
• To find out the better classifier to classify this kind of data.
-
• To find the appropriate Preprocessing to get better results.
Which parameters can be used to distinguish between the techniques to reach out a conclusion of suggesting a better technique for this kind of data?
-
B. Research Questions
Objectives of this research can be transformed into some research questions to give a definite direction for the exploration of the whole study.
Table 1 Research Questions
|
Sr. # |
Questions |
|
RQ1 |
How the ratings, length of reviews, Price and ratings are associated? |
|
RQ2 |
How frequent words can help to judge the sentiment polarity of reviews? |
|
RQ3 |
How preprocessing can affect the accuracy of different classifiers upon the performance measures of parameters? |
|
RQ4 |
How the sentiment classifiers can help to find these results and which is the better classifier to classify this kind of data? |
-
C. Background
Mining opinions from this large dataset is a challenging task. Efficient opinion mining algorithms are required to process large datasets of product reviews. For the processing of these large datasets various sentiment analysis algorithms are being used. But it is unclear that which sentiment analysis algorithm should be used for a certain data and it is also required to identify appropriate algorithms and techniques for a specific kind of data, so that the product reviews can be mined more effectively and efficiently.
In this study, the techniques used for sentiment analysis are deeply applied on mobile reviews data. This research is more focused on the sentiment classification and its techniques. The performance of these techniques is examined to find out the most appropriate technique among the rest.
-
II. Related Work
A lot of work on Sentiment Analysis have been recorded in the literature. Some of the related works are included in this paper.
Pang et al [4], utilize the techniques of machine learning for analyzing the emotion. They used three basic algorithms of machine learning Support Maximum Entropy, Vector Machine and the Naïve Bayes on unigrams and bigrams options and weights, these are taken out from the dataset of movie reviews. The accuracy improves slightly for Naive Bayes. In terms of relative performance, Naive Bayes tends to try to the worst and SVM produces better results in their opinion, though the variations aren’t very enormous. Experiments and studies confirmed that the techniques of machine learning outperformed the social made baselines for emotional analysis on their dataset.
For supporting the decision analysis of opinion mining from the user reviews has been explored by many works. In 2004, Hu et. al planned a system of opinion mining in [5,6]. They used dataset of Amazon and CNET. They used WordNet [7] to see whether or not the extracted adjective shows a positive or negative polarity. They used the Lexicon based technique to seek out linguistics orientation for adjectives. Hu et. al. used NLP parser program that employed Part-Of-Speech (POS) tagging to break the sentence into its constituents. They utilized algorithms of their own for frequent feature identification, opinion word extraction and orientation determination.
Ohana and et.al. demonstrates the outcomes of using the SentiWordNet verbal source to the problem of sentiment classification of data fetched from movie reviews [8]. Their analysis evaluates the employment of SentiWordNet to the text level classification by means of the dataset exhibited in [9]. Their approach involves summing up positive and negative term scores to evaluate sentiment orientation, and change is shown by fetching a dataset of related options victimization SentiWordNet, and practiced to a machine learning classifier. This study additionally confessed opportunities wherever any linguistic process yields gains in classification accuracies[8].
Prabowo and et al. [9] has mutual imperative based mostly arrangement, machine learning and supervised learning methodology. This methodology is verified on movie assessments, invention assessments and MySpace remarks.
Ghag et al [10] also performed sentiment analysis. For sentiment classification they used different Classifier. Techniques compared on the basis of language dependency, Usage of lexicon and training sets. Major challenges include handling negation and language generalization.
In 2014, Gupte et al. [11] published a paper in which they have done comparative study of most commonly used algorithms, usually the classification of different algorithms for emotion analysis. Their sentiment analysis techniques are Text Extraction, Text Refinement, Test Classification and Score Aggregation. They present a study of algorithms viz. The purpose for choosing just the previously mentioned algorithm is the extensive use in various errands of sentiment analysis. Their study describes that Random Forest classifier clearly has high accuracy and performance, simplicity in understanding, and incremental in results over a period of time, although it requires high training time. They did prefer a classifier model like Random Forest that consumes high learning time but has best accuracy, if accuracy is the highest priority. If processing and memory is a preference then NB classifier should be taken into account because of its lesser memory consumption and training time. Maximum Entropy is used when they have less training time but powerful processing system and memory. Boosted Tress might be used if they select a classifier that is average on all aspects.
There is an oversized volume of printed studies describing the role of Sentiment Analysis (SA). Bhadane et.al planned a system in 2015 [12]. The Analysis is of two steps: Aspect Identification and Sentiment Classification. They actualized an arrangement of systems for feature polarity documentation and classification of invention evaluation by means of learning (SVM) shared with area dictionaries. Their test demonstrated that the recommended procedures have accomplished around “78%” precision and are extremely encouraging in performing their tasks[11].
In 2016, Mandal and et.al [13] proposed an algorithm based on Lexicon text classification. They have considered the degree of comparisons via Positive, Comparative and Superlative. The Dictionary based method uses emotions lexis with both negative and positive words to match the word within sentences to find out their polarity. This dictionary may offer helpful options of polarity to machine learning approaches and once information is spare, and it’s vitally necessary to think about other effective options. Lexis based text classification method is performing genuinely well after adding negations. This approach tends to supply an improved and easy architecture for performing Sentiment Analysis on on-line reviews. Future work is to develop corpus based on mostly text classification algorithmic rule to investigate its performance to existing algorithmic rule. They Further anticipated test datasets for various supervised machine learning classifiers. They additionally went forward to test various supervised machine learning classifiers on these datasets. Their point likewise intended in words to form their framework more practical.
Pasarate et.al [14] had made a reasonable revision of extraction techniques of features used in Emotions Analysis. They used movie reviews and parsed it into Stanford parser. This paper has 4 feature extraction techniques. Total Weighted Score Computing Method, Classification Model, Aggregation and the Weighing Scheme, Intrinsic Extrinsic Relevance Approach. Intrinsic Extrinsic Domain Relevance Approach (IEDR) is an inter corpus method to the feature extraction. The IEDR approach produce good results as compared to other approaches proposed in this paper. IEDR is not designed for a certain domain. This technique indicates feature extraction for the improvement of performance enhancements in the comparison of other alternative strategies used for the sentiment classification and analysis.
In 2016, Rana and et.al made a Proportional Examination of Emotional Location By means of SVM and Naïve Bayes Techniques. They used dataset of film user reviews. They distinguish the opinion of people. Naïve Bayes using synthetic word approach and linear SVM resulted to provide best accuracy. Movie genre drama stand for its increased accuracy among the several genres of movies. They also showed Polarity of different words in graph. In further they want to explore this data with different products and areas. Day by day people prefer to buy online products, so in this way accuracy rate of products can easily be identified [17].
-
III. Methodology
In this classification task, the data is needed to be divided in two parts: test set and training set. The training set is used to learn the classifier and the other set is further used to test the performance of the classifiers. Large number of ML techniques are available which categorizes the sentiments.
-
A. Dataset
The employed data set contains the customer reviews about the Unlocked Mobile phones, which are taken from amazon.com. The Web Network of Amazon.com is a treasure trove of product reviews and their review system is accessible across all channels presenting reviews in an easy-to-use format. The product reviewer submits a rating on a scale of 1 to 5 and provides own viewpoint according to the whole experience. The mean value is calculated from all the ratings to arrive at the final product rating. Other visitors can also mark yes or no to a review depending on its helpfulness – adding credibility to the review and reviewer. In this study, we analyzed more than the 400 thousand reviews on unlocked cell phones that are traded on Amazon.com to discovery visions with esteem to their relationships, price, reviews and ratings.
The dataset is taken from “”. The data set contains the following information or attributes from the ‘unlocked phone’ category of
-
1. Product Title
-
2. Brand
-
3. Price
-
4. Rating
-
5. Text of the review
-
6. Number of persons who initiate the appraisal helpful.
The total number of reviews extracted were more than 413,840 covering close to 4,400 unlocked mobile phones. And the given data is stored in a .csv file of size 125 MBs. This data is used to predict that what rating a customer would probably give, based on the sentiments hidden in their reviews. The dataset is distributed into training data and test data of 289,688+ records and 124,152+ records respectively. The attribute “Rating” of the data set is the Target class of this classification task.
-
B. Preprocessing
Preprocessing can increase the performance and accuracy of a classifier. The dataset is comprised of exclusively English reviews. Reviews contain information which are not clearly expressive and needed to be removed.
Remove punctuations: All punctuations, which are removed.
Stop Word Removal: Some words are called stop word. These pronouns, prepositions, conjunctions have no specific meanings. “I", "a", "an",” is”, "are", "as", "at", "from", "in", "this", "on", "or", "to", "was", "what", "will”, “with" etc. are example of stop word, so these types of words have been vanished.
Case-folding is applied. All text is converted into lower case.
Stemming: It converts word into its grammatical root form. Stemming technique converts word like “teach”,” teacher”,” teaching”,” teaches” to root word teach. M.F Porter stemming algorithm is used for this task.
It minimizes the feature set and increase the accuracy of classification.
POS Tagging: The Part-Of-Speech of an expression is a philological group, which is distinct by its morphological behavior. Noun, verb, interjection, pronoun, conjunction, preposition, adverb and adjective are POS common categories. SentiWordNet dictionary calculates score to tagged words and score is given to Proposed SVM to classify Reviews. Every word has positive and negative score already defined in the SentiWordNet dictionary so with help of that score, weighted score is assigned to tagged word to calculate its sentiment score.
Using these steps of Pre-processing and feature extraction brought an improvement in performance measure during this study. This study found the RQ4 and the remaining answer has got in the Section 3.8.
-
C. Level of analysis
Sentence level is done for the mining of customer reviews; the core job is to checked whether every stretch expressed an optimistic and undesirable view. This smooth examination is carefully connected to prejudice organization, which differentiates impartial verdicts that debauched factual substantial from personal verdicts that express subjective opinions and estimation. For the classification of reviews unigram classifiers will be used to figure out the polarity of either positive or negative subjectivity of a certain sentence.
-
D. Feature Extraction
The creation article removal theaters an important part inside the examination of the creation, meanwhile we are able to understand the standing of the statistics of the choices and their relations for the improved promoting set up. For this research the data is vectorized and then classified with classifiers.
-
E. Word Cloud
Data visualizations, such as charts, graphs, infographics and others give a valuable way to communicate the features of a data in a glance. Important textual data points are highlighted by Word Cloud specific format, tedious or boring data can be converted into sputter and instantly convey key information. Text clouds or tag clouds work the same way Word Cloud does. From textual data like speech, database, blogpost etc. specific words appear in a bigger and bolder way.
-
F. Classification
When it comes to text mining classification is among the most significant segments, image processing and in other relevant fields. In our case of text mining without classification, it is very difficult to analyze the tweets sentiment. For this study, seven different classifiers such as Gradient Boosting, SGD, Multinomial NB, LSTM, Random Forest, NB-SVM and CNN. Some of the classifiers are mostly used for the text mining and then compare the results with each other. The dataset of 413000+ reviews was divided into the ratio of 70% and 30%. The target Class is “Rating” which ranges from 1 to 5. Classifying the reviews according to the ratings helped to understand what kind of reviews, which users gives, when they rate the products.
-
G. Classifer for Sentiment Analysis
Traditionally, for the sake of opinion mining, these sentiment classifier techniques area unit largely ordinarily use. So, for this study given classifier techniques are:
-
1) NB-SVM
Intended for the Support Vector Machine, “x(k) = ˆf (k)”, and w, b: are gotten by diminishing “ wT w + C ∑i max(0, 1 - y (i) (wT ˆf (i) + b))2 (1)
Novelty this L2-regularized L2-loss SVM to exertion the unsurpassed and L1-loss SVM to be fewer steady. The LIBLINEAR lending library [19] is rummage-sale here.
x (k) = ˜f (k), where ˜f (k) = ˆr ◦ ˆf (k) is the division sensible creation. Whereas, it produces good results in long documents.
wt = (1 - β) ώ + βw (2)
Anywhere, “ ώ = ||w||1/|V |” is the nasty greatness of w, and “ β ∈ [0, 1]” is the exclamation stricture.
-
2) Random Forest
In machine learning approaches Random forest classification one of the best learning algorithm [18], which uses unpruned classification trees created after using bootstrap sampling and random feature[19]. Input sample is assigned with a class or label by this algorithm. Random forest classifier is being in use by many domains which ranges from proteomics [20] to ecological researches [21,22]. It has also been used for medical imaging and diagnosis [21], character recognition[22], malware detection [23] and traffic accident detection [24].
-
3) Multinomial Naïve Bayes
Where, N+, N- represent positive training data and negative training data respectively.
where 1 is the indicator function. ˆp, ˆq, ˆr are calculated using ˆf (i) instead of f (i).
-
4) Gradient Boosting Classifier
The idea of Gradient Boosting Classifier was originally from AdaBoost Algorithm presented by (Freund and Schapire, 1996) this classifier was the iterative construction of weak learners, while “boosting”[25]. Decision trees were the weak learners in AdaBoost and due to their shortness, they were distributed over a single split. Predictions are made through majority vote of prediction of the weak learners’ predictions, on the basis of their accuracy weight.
-
5) Convolutional Neural Networks
Convolutional Neural Networks (CNN) is widely being used in the state of art these days such as in [28,29] and [26]. The architecture of CNN is composed of convolutional, pooling layers and fully connected layers[27]. a convolutional layer is to detect distinctive local motif-like edges, lines, and other visual elements. The parameters of specialized filter operators, termed as convolutions, are learned. This mathematical operation describes the multiplication of local neighbors of a given pixel by a small array of learned parameters called a kernel. By learning meaningful kernels, this operation mimics the extraction of visual features, such as edges and colours, similar to that noted for the visual cortex. This process can be performed by using filter banks. Each filter is a square-shaped object that travels over the given image. The image values on this moving grid are summed using the weights of the filter. The convolutional layer applies multiple filters and generates multiple feature maps. Convolutions are a key component of CNN, and are vital for success in image processing tasks such as segmentation and classification.
-
6) Long Short-Term Memory
This is a class of recurrent neural networks (RNN), long short-term memory (LSTM) networks perform very well when dealing with sequence data like speech and video recognition and classification [28]. LSTM Networks also works as a fundamental building block of several sequence learning tasks, including language modelling, question answering and machine translation [29]. The training procedure for LSTMs, takes a lot of time to train, usually more than for feedforward networks [30]. LSTM can also be used with text data.
The n-gram assumption leads to an inaccuracy, when LMs are used as feed-forward neural network. According to the chain rule of probability theory, all predecessor words (w1m-1) needs to be noticed to predict the m-th word of a sentence.
-
7) SGD Classifier
Stochastic Gradient Descent (SGD) classifier is among the most popular methods for training deep learning models across various modalities including computer vision, NLP, and reinforcement learning [29]. The SGD algorithm is extensively used to train ML algorithms such as SVM or DNN [31]and others. In this research SGD Classifier is used to determine the classes in which a review can give a certain rating.
-
H. Evaluation Measures
As with the problems of the other classification, the accuracy is the core measure in this research. The confidential appraisals will be associated with the definite class where they plummet in. Correctness is deliberate as the relation amongst the statistics of appraisals. For assessment, the manuscript data would be more than the 124,134 reviews.
The performance of a classifier is often described as the confusion matrix. This confusion matrix shows how many predicted results of test data falls exactly same with the actual class. Moreover, how many records of test data have classified to wrong target classes, as shown in Figure. 2. The data, we put according to Confusion Matrix, is helpful to find the evaluation measures (such as, Accuracy, Precision, Recall etc.) of classifier.
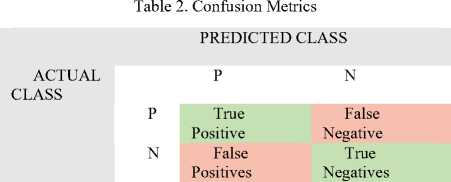
Accuracy: It represents the proportion of total variety of correct predictions amongst total variety of correct additionally as incorrect predictions. It's conjointly referred as preciseness in bound studies.
In some cases, accuracy can be deceptive. Sometimes it may be needed to choose a model with relatively lower accuracy due to greater predictive power it offers on a certain problem. So, it is good to use other performance parameters such as Precision or recall.
Precision: It represents the proportion of properly classified fault prone categories amongst total range of classified fault prone categories. Precision is measured as the ratio of the total number of reviews classified correctly to the total number of reviews in that certain category.
Recall: It represents the proportion of properly classified fault prone categories amongst total range of classified fault prone categories. Recall is measured by “the ratio of the number of reviews correctly classified into a category to the total number of reviews belonging to that category”. This measure indicates the aptitude to recall things in the certain category.
F1-Score: The F1 score can be inferred as “a weighted average of the precision and recall, where an F1 score reaches its best value at 1 and worst score at 0”. As the accuracy is in percentage then the F1 score from 0 to 1 can depict 0 to 100% measure.
Table 3. Evaluation measures with their formulae
|
Evaluation Measure |
Formulae |
|
Accuracy |
(True Positives + True Negative) / (True Positives + True Negative + False Positives + False Negative) |
|
Precision |
(True Positives) / (True Positives + False Positives) |
|
Recall |
(True Positives) / (True Positives + False Negatives) |
|
F1- Measure |
(2 x Precision x Recall) / (Precision + Recall) |
-
IV. Analysis And Results
Data analysis was performed with Python and presented in the charts in each sub section, which answers research questions (Table I). The Amazon review data required for this analysis was extracted by Prompt Cloud’s Data-as-a-Service solution.
-
A. Exploratory Analysis
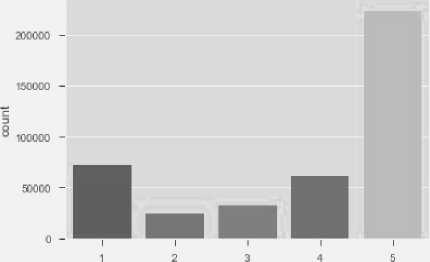
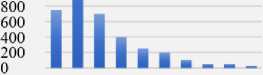
This section covers one of the objectives of this study, stated by RQ1 from Table I. First let’s look at the distribution of ratings among the reviews. Most of the reviewers have given 4-star and 3-star rating with relatively very few giving 1-star rating. The mean value of all the ratings comes to 3.62. Now let’s consider the distribution of the length of the review. We can see that maximum reviews contain less than 300 characters. The mean length of all the reviews comes to 230 characters, which means most people usually tend to write short reviews within one to two sentences. The reviews are classified into the rating stars of their corresponding rating in Fig.1 . The exploratory analysis shows that there are more 4 and 5 ratings in the data set than 3- star rating. And 1-3 rating shows negative results. This rating class will work as the target class of the dataset. In figure Fig. 2. reviews are distributed over their respective lengths in characters. This Section partially answers the RQ1 of Table 1. Section B, C, D and E answers it wholly.
B. Vote Distribution with respect to Product Price and Product Rating
Here we plot the average length of reviews and the average number of votes based on the helpfulness. Let’s see if a greater number of people finds longer reviews more helpful. There is an acceptable positive correlation (r = 0.30) between the two as supported by the trend line below.
Rating
Fig.1. Distribution of reviews with respect to their ratings
Review Length Distribution
rd rd rd <-d rd rd rd rd rd rd
4? c^s^
Fig.2. Distribution of number of Reviews with their Length
Review Length Distribution
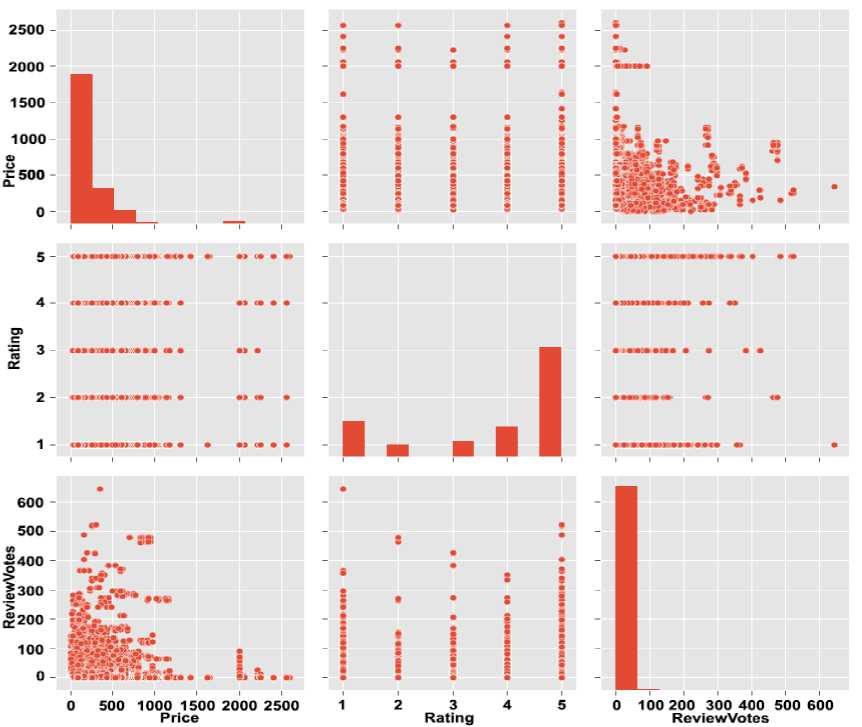
Fig.3. Vote Distribution with respect to Product Price and Product Rating
C. Relationship between Review Length and Product Price
Now we’ll explore relationship between the average length of the reviews and phone price. The plot shows that there is no increment in the length of the reviews with increase in the price. The correlation is very close to zero and by removing the outliers the correlation remains weak (r = 0.01).
According to the mean rating it can be said that the Otter-box is more positively assessed brand of all. Samsung Apple, and LG are also positively reviewed by the customers as shown in Table 4. This is how the answer of RQ2 is found.
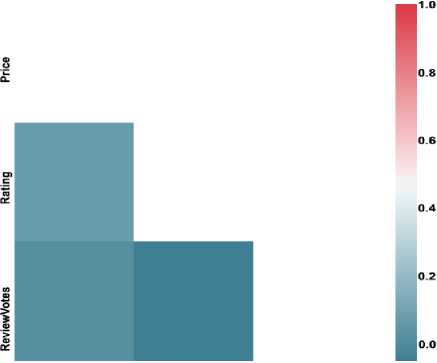
Price Rating ReviewVotes
Fig.4. Relationship between Reviews, Product Price and Product Rating
Table 4. Top 10 brands according to their mean ratings
Brand Name
Mean
Rating
Std Rating
1
Otter-Box
4.383778
1.164561
2
Samsung
3.924415
1.485313
3
Apple
3.841460
1.576060
4
LG
3.841460
1.534323
5
Nokia
3.819291
1.490946
6
Motorola
3.812849
1.524914
7
BLU
3.792262
1.524914
8
BlackBerry
3.741465
1.599935
9
HTC
3.465420
1.660243
10
CNPGD
3.106002
1.618294
F. Word clouds of different Mobile brands
-
D. Relationship between Reviews, Product Price and Product Rating
Now we’ll find out if costlier products have better ratings. This plot shows (in Figure 4)there is some correlation (r = 0.26) between rating and price. When consumers pay more for a product, they also expect better quality and sellers need to meet this expectation. It can be considered that with cost the product quality increases, which in turn leads to higher rating.
-
E. Average rating of top 10 brands
Mobile brands can be ordered upon their rating mean. The brand with highest rating can be numbered as 1, on the basis of reviews and ratings. This can easily provide the customer the insight about the market value of a brand, as shown in Figure 5.
The reviews are separated according to their ratings – positive reviews of rating 4 star OR 5 star and negative reviews of rating 1 or 2 star. In both type of reviews there are certain common words like “work” , “battery” and “screen” . The most frequently used words in positive reviews are: “great”, “good”, “camera”, “price”, “excellent”, etc. In case of negative reviews words such as “return”, “back”, “ problem ”, “charge” is prevalent.
atlsfled day ЬоД„огк5 small "МГ&Ц. ama,^,n8 p price П L .jr.i:
used i usin§ great phone ba
"r^t g-turn nlcegot < monthS problem® come ^НС^-^йй^^ case
^r vs phone g^ awesome _ locked oj_u
t£ljrclerl
£ ar back
apple
everytj^g pleased
T d seller took work app J time went Q-oouBrii prearw best need
working ' 1
• ^У-— Ь^^египГо^™1
Brea"tSorder«lloS!5, brand (android charger ^^ F
iSP^JjL wi 3mesim card
" seern bet ter,;.
bough tknow new phone
- ° exoerience1
CarCsV happy device week p poduc t

excellentS description -=
= prober ' -LVCU
S°Saa₽ho^ скарне
' iphone
refurbishedi
Fig.6. Word Clouds generated from the dataset of Mobile reviews
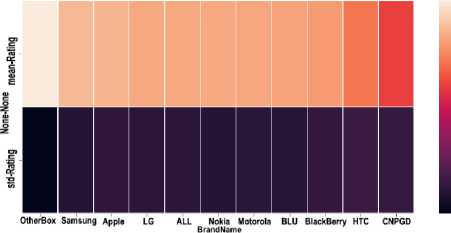
Fig.5. Average rating of top 10 brands
G. Sentiment Analysis and Mean clustering use to find out important words in top ten Brands
This section and section F answers the question RQ3 in Table 1. The sentiment analysis shows that the majority of reviews have positive sentiment and comparatively, negative sentiment is close to half of positive. Among the eight emotions, “trust”, “joy” and “anticipation” have topmost scores. High scores for “joy” and “anticipation” could be because of the newly delivered phones. Also, the highest score for “trust” among all the emotions shows that the reviewers are writing the reviews with conviction and they trust the product.
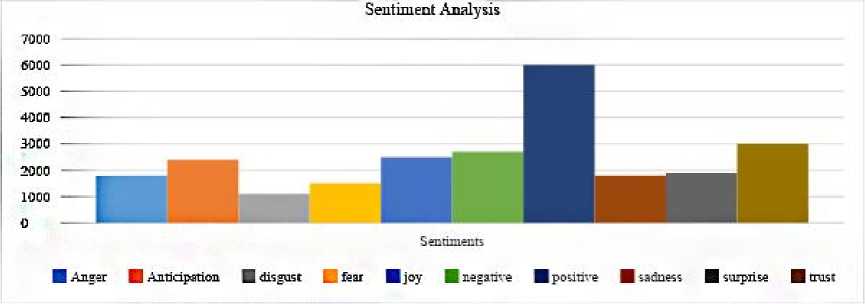
Fig.7. Sentiment Analysis on the given 10 words which are most likely to show the sentiments behind the reviews
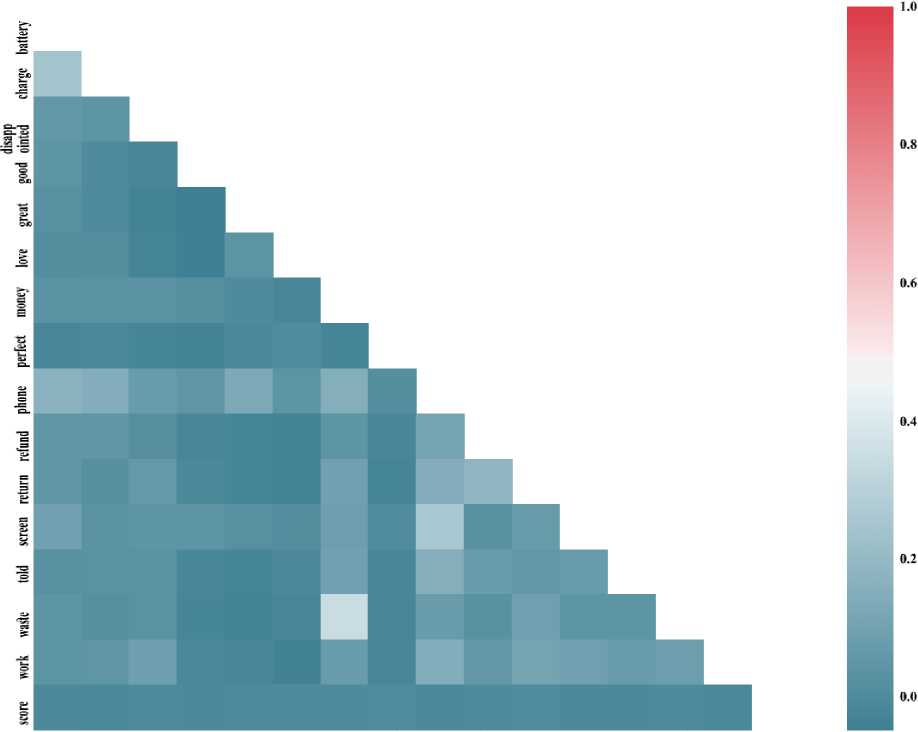
battery charge disapp good greate love money perfect phone refund return screen told waste work score " ointed
Fig.8. Mean Clustering to find the important words in the reviews of a specific brand
-
Mean Clustering w.r.t these 10 brands have also been done to find the important words used in the reviews and the results are shown in Figure. The mean clustering shows the words which have been used by most of the viewers. This shows the sentiments of the most user about a certain brand. Many words such as “Battery”, “phone”, “waste” , “work”, “disappointment”, “good” are mostly used for the mobile phones of the brand Apple. Similarly some words are clustered for the Samsung as shown in Figure 8.
H. Confusion matrix with normalization
The performance of the chosen 7 classifiers are fetched as the confusion matrix. The confusion matrix for each classifier described how many predicted results of test data falls exactly same with the actual class of Rating from 1-star to 5-star. And how many records of test data have classified to wrong target classes (e.g. rating was 5 but it was categorized in 3-star rating or any other class), as shown in Fig. 9. The data, we put in the Confusion
Matrix of each classifier, is helpful to find the evaluation measures (such as, Accuracy, Precision, Recall etc.) of classifier.
Confusion Matrix SGDCIassifier
|
1 - |
18,241 |
36 |
87 |
198 |
3,098 |
|
4,158 |
640 |
203 |
487 |
1954 |
|
|
Ф 3 S H |
2,732 |
74 |
1,068 |
1,142 |
4,498 |
|
4- |
1220 |
24 |
171 |
2.403 |
14,396 |
|
5- |
1029 |
11 "U accuracy- |
52 Predicted label =0.7071; misclass |
795 =0.2929 |
■ |
(a) SGD Classifier
Confusion Matrix RandomeForest
|
i |
19 778 |
221 |
212 |
264 |
1358 |
|
2- |
1493 |
4,685 |
165 |
200 |
739 |
|
3- |
1144 |
135 |
5,974 |
492 |
1755 |
|
4- |
596 |
100 |
278 |
10,922 |
6,473 |
|
1211 |
|||||
|
■■ |
|||||
|
accuracy: |
Predicted label =0.8552; misclass |
=0.1448 |
(b) Random Forest Classifier
Fig.9. Confusion matrix of different classifiers with 5 target classes of ratings 1-5 star
Table 5. Results produced by each classifier with respect to their Evaluation measures
|
Sr # |
Classifier |
Accuracy |
Precisi on |
Recall |
F1-Measure |
|
1 |
SGD Classifier |
70.70 |
68 |
71 |
64 |
|
2 |
Gradient Boosting Classifier |
65.5 |
63 |
66 |
58 |
|
3 |
Multinomi al NB |
70.55 |
69 |
71 |
64 |
|
4 |
NB-SVM |
73.51 |
71 |
74 |
69 |
|
5 |
LSTM |
73.7 |
71 |
74 |
70 |
|
6 |
CNN |
77.5 |
76 |
78 |
74 |
|
7 |
Random Forest |
85.50 |
86 |
86 |
85 |
The result of the performance measures shows that, all the classifiers did predict the test data according to the rating class of 1 to 5 stars. Gradient Boosting, Multinomial NB and SGD Classifier performed not well on the data set of mobile reviews. Gradient Boosting Classifier found to be the least appropriate for the classification of such dataset with many target classes. Random Forest Classifier outperformed all other classifier and showed 85% accuracy for the given dataset of Mobile Reviews. Convolutional Neural Networks (CNN) are also found to be appropriate as it showed 77% of the accuracy. NB-SVM and Long-Short-Term Memory (LSTM) performed equally as they showed similar accuracy of 73%. LSTM is designed to classify sequential data such as speech and videos (Zeyer et al., 2017) and that is the reason of its inaccuracy for this dataset. The objectives of this research were formulated in Research Questions and the last Research Question, RQ5, is finally described by the study.
Precision, Recall, F1-score are also comprehensively examined and compared according to each classifier and the results are shown in the graph chart (given in Figure 10).
The confusion matrix of two classifier is shown as a sample of describing the confusion matrix of 5 different classes of ratings.
I. Comparative Analysis of all Machine Learning Techniques
Confusion metrics were used to find out the performance of the classifier according to their evaluation measures, accuracy, recall, precision and F1 score. These measures presented the comparison of these classifiers as shown in Table 5. This Table 5 shows the Evaluation Measures, Accuracy, Precision and other, measures to evaluate each classifier. Training Set was of 70% of the whole data set which was used to train up to 50 epochs. The test data of 124,152 (30% of the whole dataset of 413840 reviews) was taken.
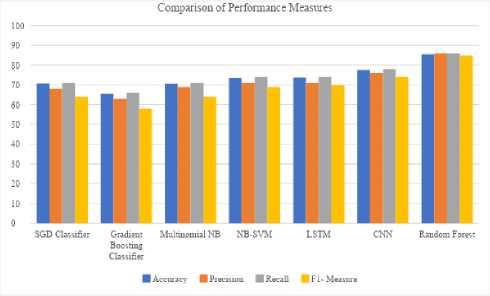
Fig.10. Graphical representation of the comparison of performance measure of the classifiers
-
V. Conclusion
Product review platform, provided by Amazon, describes that major number of reviewers have set 4-star and 3-star ratings to the unlocked phones. The average length of the reviews comes close to 230 characters. It can be seen that review with more lengthy text tends to be more useful and there is a direct correlation between rating and price. Sentiment analysis shows that positive sentiment is established among the reviews and in terms of emotions, ‘trust’, ‘anticipation’ and ‘joy’ have highest scores. Confusion metrics were used to find out the performance of the classifier according to their evaluation measures, accuracy, recall, precision and F1 score. These measures presented the comparison of these classifiers. The result of the performance measures shows that, Random Forest Classifier outperformed all other classifier and shows 85% accuracy for the given dataset of Mobile Reviews. Gradient Boosting Classifier found to be the least appropriate for the classification of such dataset with many target classes. However, CNN also found to be useful for this certain dataset. These results give the researchers and data scientist a platform to find their desirable classifier for the sentiment Classifiers.
-
VI. Future Work
In the Future, it would be interesting to perform further analysis based on the brand (example: Samsung vs. Apple). We can also look at building a model to predict the helpfulness of the review and the rating based on the review text. Corpus-based and knowledge-based methods can be used to determine the semantic similarity of review text. There are many more insights to be unveiled from the Amazon reviews. One of those can be the mining the top products of each brand and mining their reviews. Moreover, a classifier can be used with different preprocessing and feature extractions to gain better performance.
References Sentiment analysis on mobile phone reviews using supervised learning techniques
- R. Sharma, S. Nigam, and R. Jain, “Supervised Opinion Mining Techniques : A Survey,” vol. 3, no. 8, pp. 737–742, 2013.
- W. Medhat, A. Hassan, and H. Korashy, “Sentiment analysis algorithms and applications: A survey,” Ain Shams Eng. J., vol. 5, no. 4, pp. 1093–1113, 2014.
- A. Esuli and F. Sebastiani, “SENTIWORDNET: A high-coverage lexical resource for opinion mining,” Evaluation, pp. 1–26, 2007.
- B. Pang and L. Lee, “A Sentimental Education: Sentiment Analysis Using Subjectivity Summarization Based on Minimum Cuts,” 2004.
- M. Hu and B. Liu, “Mining and summarizing customer reviews,” Proc. 2004 ACM SIGKDD Int. Conf. Knowl. Discov. data Min. - KDD ’04, p. 168, 2004.
- M. Hu and B. Liu, “Mining Opinion Features in Customer Reviews,” 19th Natl. Conf. Artifical Intell., pp. 755–760, 2004.
- G. A. Miller, R. Beckwith, C. Fellbaum, D. Gross, and K. J. Miller, “Introduction to wordnet: An on-line lexical database,” Int. J. Lexicogr., vol. 3, no. 4, pp. 235–244, 1990.
- B. Ohana and B. Tierney, “Sentiment classification of reviews using SentiWordNet,” Sch. Comput. 9th. IT T Conf., p. 13, 2009.
- R. Prabowo and M. Thelwall, “Sentiment analysis: A combined approach,” J. Informetr., vol. 3, no. 2, pp. 143–157, Apr. 2009.
- K. Ghag and K. Shah, “Comparative analysis of the techniques for Sentiment Analysis,” Int. Conf. Adv. Technol. Eng., no. 124, pp. 1–7, 2013.
- A. Gupte, S. Joshi, P. Gadgul, and A. Kadam, “Comparative Study of Classification Algorithms used in Sentiment Analysis,” Int. J. Comput. Sci. Inf. Technol., vol. 5, no. 5, pp. 6261–6264, 2014.
- C. Bhadane, H. Dalal, and H. Doshi, “Sentiment analysis: Measuring opinions,” Procedia Comput. Sci., vol. 45, no. C, pp. 808–814, 2015.
- E. K. Fi et al., “a Lexicon-Based Text Classification,” 2016.
- S. Pasarate and R. Shedge, “Comparative study of feature extraction techniques used in sentiment analysis,” 2016 Int. Conf. Innov. Challenges Cyber Secur., no. Iciccs, pp. 182–186, 2016.
- I. Journal, “Sentiment Classi fi cation using Decision Tree Based Feature Selection,” no. January 2016, 2017.
- A. J. Singh, “Sentiment Analysis : A Comparative Study of Supervised Machine Learning Algorithms Using Rapid miner,” vol. 5, no. Xi, pp. 80–89, 2017.
- S. Rana and A. Singh, “Comparative analysis of sentiment orientation using SVM and Naive Bayes techniques,” in 2016 2nd International Conference on Next Generation Computing Technologies (NGCT), 2016, pp. 106–111.
- L. Breiman, “Random Forests,” Mach. Learn., vol. 45, no. 1, pp. 5–32, 2001.
- Vladimir Svetnik, Andy Liaw, Christopher Tong, J. Christopher Culberson, and Robert P. Sheridan, and B. P. Feuston, “Random Forest: A Classification and Regression Tool for Compound Classification and QSAR Modeling,” 2003.
- G. IZMIRLIAN, “Application of the Random Forest Classification Algorithm to a SELDI-TOF Proteomics Study in the Setting of a Cancer Prevention Trial,” Ann. N. Y. Acad. Sci., vol. 1020, no. 1, pp. 154–174, May 2004.
- M. Mursalin, Y. Zhang, Y. Chen, and N. V Chawla, “Automated epileptic seizure detection using improved correlation-based feature selection with random forest classifier,” Neurocomputing, vol. 241, pp. 204–214, Jun. 2017.
- C. W. Jian, M. Z. Ibrahim, W. Thum, T. Seong, W. Ei, and S. Khatun, “Embedded Character Recognition System using Random Forest Algorithm for IC Inspection System.”
- S. Joshi, H. Upadhyay, L. Lagos, N. S. Akkipeddi, and V. Guerra, “Machine Learning Approach for Malware Detection Using Random Forest Classifier on Process List Data Structure,” in Proceedings of the 2nd International Conference on Information System and Data Mining - ICISDM ’18, 2018, pp. 98–102.
- N. Dogru and A. Subasi, “Traffic accident detection using random forest classifier,” in 2018 15th Learning and Technology Conference (L&T), 2018, pp. 40–45.
- L. Saitta, R. E. European Coordinating Committee for Artificial Intelligence., and Associazione italiana per l’intelligenza artificiale., Machine learning : proceedings of the Thirteenth International Conference (ICML ’96). Morgan Kaufmann Publishers, 1996.
- C. Muramatsu, S. Higuchi, H. Fujita, T. Morita, and M. Oiwa, “Similarity estimation for reference image retrieval in mammograms using convolutional neural network,” in Medical Imaging 2018: Computer-Aided Diagnosis, 2018, vol. 10575, p. 101.
- U. R. Acharya, S. L. Oh, Y. Hagiwara, J. H. Tan, H. Adeli, and D. P. Subha, “Automated EEG-based screening of depression using deep convolutional neural network,” Comput. Methods Programs Biomed., vol. 161, pp. 103–113, Jul. 2018.
- J. Hyeon and Y. M. Communications Business, “Large-scale Video Classification guided by Batch Normalized LSTM Translator.”
- S. Merity, N. Shirish Keskar, and R. Socher, “Regularizing and Optimizing LSTM Language Models,” 2017.
- A. Zeyer, P. Doetsch, P. Voigtlaender, R. Schlüter, and H. Ney, “A COMPREHENSIVE STUDY OF DEEP BIDIRECTIONAL LSTM RNNS FOR ACOUSTIC MODELING IN SPEECH RECOGNITION.”
- S. K. Gonugondla, M. Kang, and N. Shanbhag, “A 42pJ/decision 3.12TOPS/W robust in-memory machine learning classifier with on-chip training,” Dig. Tech. Pap. - IEEE Int. Solid-State Circuits Conf., vol. 61, pp. 490–492, 2018.
