Shadow Economy in Russia: Economic and Statistical Assessment of Its Scale and the Ways of Its Reduction in the Country and Regions

Author: Berkovich M.I., Shurygin A.A.
Journal: Economic and Social Changes: Facts, Trends, Forecast @volnc-esc-en
Section: Regional economy
Article in issue: 5 т.14, 2021.
Free access
The shadow economy is one of the most complex socio-economic phenomena in almost any state. The shadow economy, which has become an integral structural element of an economic system, has a diverse and sometimes ambiguous impact on it. The nature and assessment of this phenomenon and the ways to deal with it have been in the focus of attention of scientists, government authorities, trade unions, and economic entities for a long time. Having reviewed the definitions of the shadow (underground) economy that are suggested by modern domestic and foreign sources, we consider this phenomenon as an economic activity of actors that are hidden from the influence of state control. In this regard, we can highlight the following priority areas of research: identification of factors that have a significant impact on the volume and nature of the shadow economy, development of measures to overcome it, and search for more adequate quantitative methods for its assessment at different levels of public administration. Of particular interest is the regional aspect of the shadow economy, which is not given due attention in publications. The article presents an attempt to compensate for this lack of attention. The aim of the work is to assess the scale of the shadow economy nationwide and in Russia’s individual constituent entities on the basis of generalization of the methods applied and with the use of official statistical information of all- Russian agencies: the Federal State Statistics Service, the Federal Tax Service and their regional offices. Scientific novelty of the study lies in adjusting the traditional approach to the assessment of the shadow economy by the tax method, which consists in eliminating the amount of depreciation deductions from the indicators of gross profit of the economy and gross mixed income. The proposed method has been tested on the economy of Russia and several regions of the Central Federal District. We have revealed significant differences in the estimation of the scale of this phenomenon if various calculation methods are used. We review a set of measures aimed at reducing hidden income at the federal and regional levels, taking into account the current socio-economic situation complicated by the coronavirus pandemic.
Shadow economy, indirect methods, hidden income, macro-level, meso-level, regional economy.
Short address: https://sciup.org/147234808
IDR: 147234808 | UDC: 330 | DOI: 10.15838/esc.2021.5.77.4
Text of the scientific article Shadow Economy in Russia: Economic and Statistical Assessment of Its Scale and the Ways of Its Reduction in the Country and Regions
The influence of the “shadow economy expansion” has a negative impact on the entire socio-economic system of the country and its institutional foundations. The shadow economy has a negative impact on the overall structure of production and consumption, the competitive environment, the existing conditions of labor reproduction, the distribution of the tax burden, the budget process, the biosphere, and deforms social and psychological relations.
Since the concept of “shadow economy” is a complex and multicomponent term, there is a variety of approaches to its definition. It can be assumed that the diversity of positions on this issue is due, in particular, to differences in the nature of the theoretical and applied issues addressed by the authors, as well as in the research methodology and technique used by them, and the setting of objectives1.
A significant contribution to the study of the problem was made by Russian scientists A.O. Afanas’eva [1], A.K. Bekryashev, V.Yu. Burov [2], E.V. Drobot [3], V.M. Zarubinskii, K.A. Seme- renko [4], I.C. Ignat’ev2, N.V. Kapitonova, A.A. Kapitonova [5], A.P. Kireenko [6], A.V. Kostin3, N.P. Kupreshchenko [7], Yu.V. Latov [8], A.S. Men’shikov [9], D.Yu. Fedotov, E.N. Nevzorova, E.N. Orlova [10], A.Z. Noven’kova [11], B.T. Rya-bushkin, E.Yu. Churilova [12] and others.
A content analysis of individual approaches to defining the term “shadow economy” is presented in Table 1 .
The signs of the shadow economy in terms used in foreign scientific literature are highlighted by A.P. Kireenko [6].
A number of studies devoted to theoretical, methodological and practical aspects of the definition and assessment of the shadow economy were conducted by H. Enste [13], F. Schneider [14; 15], E. Friedman, S. Johnson, D. Kaufmann, P. Zoido-Lobaton [16], Y. Eilat, C. Zinnes [17], R. Goel, J.W Saunoris [18], V Almenar, J. Sanchez, J. Sapena [19], A.N. Berdiev, J.W. Saunoris [20].
Generalization of these positions allows defining the shadow economy as a phenomenon of
Table 1. Approaches to the definition of the “shadow economy”
Author Approach to the definition H. de Soto The shadow economy is defined as a special type of economic activity that evades official accounting and control and is often (but not always) illegal in nature1) B.T. Ryabushkin, E.Yu. Churilova The shadow economy is viewed from different perspectives: – As a prohibited type of economic and non-economic activity; – hidden production; – economic activity that, for one reason or another, is not accounted for by official statistics or escapes taxation; – hidden or prohibited economic activity2) V.Yu. Burov The shadow economy includes only economic activities permitted by law, i.e., not including the completely criminal (“black”) part of the economy. At the same time, shadow economic activity must meet the following criteria: – it is carried out without official registration of the business entity (legal approach); – it is concealed from accounting (statistical approach); – it is socially and ethically harmful to society (social and ethical approach); – it causes economic damage to the state (economic approach) 3) Yu.V. Latov According to such attributes as the hidden nature of economic activity and the strength of the connection with the formal economy, there are three types of shadow economy: the second or “white-collar” economy, the informal economy, the “black” economy4) Compiled according to: 1) Latov Yu.V. The informal economy: The mysteries of three worlds. A review of Hernando de Soto’s The Other Path. Ekonomicheskaya teoriya prestuplenii i nakazanii. Referativnyi zhurnal. Neformal’nyi sektor ekonomiki za rubezhom=Economic Theory of Crime and Punishment. Abstract Journal. The Informal Sector of the Economy Abroad. 2009, no. 3. Available at: (accessed: August 10, 2020). 2) Ryabushkin B.T., Churilova E.Yu. Metody otsenki tenevogo i neformal’nogo sektorov ekonomiki: monografiya [Methods for Assessing the Shadow and Informal Sectors of the Economy: Monograph]. Moscow: Finansy i statistika, 2003. 142 p. 3) Burov V.Yu. Tenevaya ekonomika i maloe predprinimatel’stvo: teoreticheskie i metodologicheskie osnovy issledovaniya: monografiya. [Shadow Economy and Small Business: Theoretical and Methodological Foundations of Research: Monograph]. Chita: Transbaikal State University, 2014. 204 p. 4) Latov Yu.V. Ekonomika vne zakona. Ocherki po teorii i istorii tenevoi ekonomiki: monografiya [Economics outside the Law. Essays on the Theory and History of the Shadow Economy: Monograph]. Moscow: Moscow Public Scientific Fund, 2001. 284 p.
the socio-economic sphere, which is the economic activity of business entities, hidden from the tools of state control.
Despite the apparent simplicity of determination, the parameters of the shadow economy cannot be accurately measured, since practically all the information needed by the researcher is classified or confidential. In such cases, indirect methods (micromethods) of estimation are applied, when open information is used, which allows applying the available information reflecting a certain correlation with the unrecorded volumes of production of goods and services.
The problem of determining the scale of the shadow economy at the level of individual territorial units of the country is even more significant. The specifics of the currently existing methods for assessing this phenomenon, as a rule, limit the possibilities of their application at the meso-economic level.
In Russia, official assessment of the shadow economy is carried out by authorized public authorities, such as the Federal Tax Service, the Federal State Statistics Service, the Federal Financial Monitoring Service, the Federal Service for Labor and Employment, etc. Various nongovernmental organizations, news and analytical agencies (including foreign ones) also conduct their own studies of the shadow economy broken down by country and sector.
In 2018, the volume of the shadow economy reached 20% of GDP (103.6 trillion rubles), increasing in absolute terms by 1.8 trillion rubles (according to Rosfinmonitoring)4. By comparison, this volume exceeds planned expenditures of the entire federal budget in 2019 (18 trillion rubles) by 2.7 trillion rubles, and in 2020 (19.5 trillion rubles) by 1.2 trillion rubles5.
Indeed, state budget losses from unrecorded economic activity of economic entities are very large. Only due to informal employment the lost revenue of the budget system of Russia is estimated annually at almost 3 trillion rubles (about 3% of GDP), of which 0.9 trillion rubles – losses due to non-payment of individual income tax from hidden income, 2.1 trillion rubles – insurance contributions to non-budgetary funds (according to the rating agency National Credit Ratings)6.
In 2019, the Research Center for Social and Political Monitoring of the Institute of Social Sciences (ISS) of RANEPA conducted a sociological survey, according to which 32.5% of Russian residents (about 25 million people) are involved in some form in the “shadow” labor market. Over the past fourteen years the number of unofficially employed people has decreased markedly (by 12.6%, down from 45.1% in 2006)7.
In addition to current and retrospective estimates of the scale of shadow economic activity and losses from it, there are studies devoted to the dynamics of its change in the future. A study on prospective estimates of the scale of the shadow economy by country, conducted by the International Association of Chartered Certified Accountants (ACCA) in 2017, showed that the shadow economy in Russia is estimated at 39.37% of GDP in relation to the year 2020. In terms of the shadow economy size in 2011, Russia ranked fifth among the top five largest shadow economies in the world (39.33%) after Sri Lanka (39.5%). ACCA forecasts that in 2025 Russia will improve its ranking in this rating by one position, almost maintaining the scale of the shadow economy at the same level (39.3%) – fourth place after Ukraine (45.98% of GDP)8.
In the recent past, the Kaufman–Kaliberd method, or the energy consumption method, has been widely used to estimate the level of the shadow economy. It is based on the assumption that the dynamics of energy consumption should correspond to the dynamics of GDP. In this case, if there is a clear difference between the volume of energy consumption and the volume of GDP for a certain period, then this difference is associated with hidden production and is a shadow part of the economy.
A.V. Kostin9 made a contribution to the research and development of this approach. In his work, he proposed a modification of the Kaufman–Kaliberd method and estimated the proportion of the shadow economy in Russia (% of GDP), which allowed establishing the level of 45–54% in 2002–2011.
Another method, which among statisticians is considered an indispensable sign of high statistical culture, is the “commodity flow” method (cargo and commodity turnover). Its essence consists in the fact that for a particular commodity group the change in its value throughout the entire production path – up to the end use.
The purpose of applying the method is to discover weaknesses in the information base by constructing a balance model. The logic of the approach is as follows:
-
1. Determination of the total resources for the production of a particular commodity (production + import).
-
2. Determination of the total use of resources (final and intermediate consumption + accumulation + export).
-
3. If there is a difference between the obtained indicators, it is necessary to decide which part of the information – the data on production or on imports – is more reliable, and use it to calculate the other part.
The principle of the method is very simple, but it is difficult to put it into practice. Virtually, the widespread implementation of the “commodity flows” method means that the balance method should be applied at the level of branch statistics.
In the Russian practice of assessing the shadow economy, this method is used quite rarely due to the complexity of its implementation.
The tax method (as a variation of the indirect method of discrepancies) makes it possible to estimate relatively fully and accurately the shadow money income in the GDP of the country as a whole. Also due to the availability of detailed information published in open sources with a sufficient level of detail, this method can also be used to estimate the shadow economy of individual regions, since, as a rule, there are no special assessments of the scale of the shadow economy at the regional level.
The tax method is based on the comparison of Rosstat data on the income received by the officially employed population with the data of the Federal Tax Service (FTS) of Russia on the tax base, from which taxes were actually paid to the corresponding budgets of the country. The volume of the shadow economy is calculated separately according to the Rosstat information on the profit received by all organizations in a particular year. Similarly, the hidden part of the economy is calculated on the basis of the Federal Tax Service data. The formula for calculating the scale of the shadow economy by the tax method is presented below (Formula 1):
GDp = GdP V.^..^:. x o% = л GDP
= P-tWst) x 100% ,
where:
GDP – gross domestic product;
GDPS– proportion of the shadow economy in the country’s GDP, %;
W – wages of employees (excluding hidden wages and mixed income), that is, legal wages (without the shadow component);
P – gross profit of the economy and gross mixed income;
TPr – Net production taxes (corporate property tax, transport tax and land tax paid by legal entities, license fees);
PT – legal profit included in the corporate income tax base;
PSt – profits recorded in the statistical reports of organizations.
The Federal Tax Service collects and analyzes information on the tax base and structure of corporate income tax accruals provided by economic entities in a report of the same name (Form No. 5–P). Aggregate information for the Russian Federation as a whole and by constituent entities is published on the FTS website10. The value of the tax base for calculating the tax in the report is taken as a PT indicator to estimate the scale of the shadow economy of the country by the tax method.
A similar calculation is carried out using data from the official statistical yearbook and other publications of the Federal State Statistics Service (Rosstat, FSSS). In this case, the PSt indicator is taken as the amount of profit (loss) before taxation according to the accounting data on the full range of organizations of all forms of ownership (the relevant information is provided in the Unified Interagency Information and Statistical System (EMISS)). Rosstat publishes information on all of the above-mentioned indicators that make up the GDPS formula.
The above information, according to some authors [10], is sufficient to estimate the scale of shadow economy. However, the proposed methodology does not consider that the indicator of gross profit of the economy and gross mixed income (P) in its net form does not reflect the real volume of profit which can potentially be involved in the shadow economic turnover. This is due to the features of the Rosstat methodology used to calculate GDP “by income” (income approach). According to the accepted methodology, the indicator of gross profit and gross mixed income represents the part of value added that remains with producers after deduction of expenses related to salaries of employees and net taxes on production and imports. Consequently, this indicator includes the amount of consumption of fixed capital (consumption, depriciation), which overstates the possible amount of shadow turnover in the P indicator.
Thus, in order to improve the objectivity of the shadow economy assessment using the tax method, it is advisable to adjust the parameter P by the amount of depreciation of fixed assets of commercial and non-commercial organizations (this indicator is published in statistical yearbooks of Rosstat and is also recorded in the EMISS). One should note that this value reflects mainly the activity of large and medium-sized businesses, because it does not include the depreciation of fixed assets of small businesses (including individual entrepreneurs). In this case the formula will take the following form:
GDPS =
GDP-W-Tpr-Ac0-ANC0-PT(Pst)
GDP x 100% = P' PT(Pst) X 100%, GDP
X
where:
АCO – amortization of fixed assets accrued for the reporting year in commercial organizations (without small business entities);
АNCO – accrued accounting amortization of fixed assets for the year (amortization and depreciation recorded in accounting and reporting) of non-commercial organizations;
P’ – gross profit of the economy and gross mixed income adjusted for depreciation.
Let us consider the application of the tax method for the analysis of shadow economic activity at the level of Russia as a whole, as well as individual regions (in the case of the Kostroma Oblast).
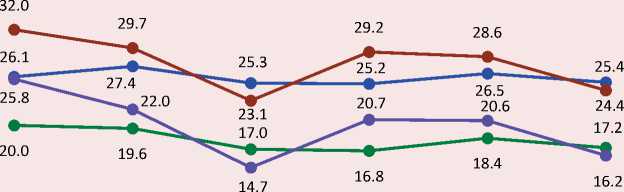
The results of calculating the volume of shadow income by the tax method before and after the adjustment (GDPS1 and GDPS2) according to the information of the Federal Tax Service and Rosstat are presented in Table 2 and Figure 1 .
Figure 1 clearly shows how the scale of Russia’s shadow economy has changed as a percentage of GDP, calculated by the tax method. At the same time, adjustment for the amount of accrued depreciation of fixed assets (depreciation) made it
Table 2. Application of the tax method to estimate the scale of Russia’s shadow economy for the period 2014–2019
|
Indicator |
2014 |
2015 |
2016 |
2017 |
2018 |
2019 |
|
GDP, billion rubles |
79 030.00 |
83 087.40 |
85 616.10 |
91 843.20 |
104 629.60 |
110 046.00 |
|
W, billion rubles |
37 439.00 |
39 748.90 |
41 237.50 |
43 897.50 |
47 107.30 |
50 321.10 |
|
TPr, billion rubles |
10 998.40 |
9 263.80 |
9 405.00 |
9 973.10 |
11 906.20 |
12 526.10 |
|
P, billion rubles |
30 592.60 |
34 074.70 |
34 973.60 |
37 972.60 |
45 616.10 |
47 198.80 |
|
АCO, billion rubles |
4 751.93 |
5 297.69 |
5 823.77 |
6 300.56 |
7 009.97 |
7 379.86 |
|
АNCO, billion rubles |
126.75 |
1 145.90 |
1 350.60 |
1 457.51 |
1 427.68 |
1 629.58 |
|
P’, billion rubles |
25 713.92 |
27 631.11 |
27 799.23 |
30 214.53 |
37 178.45 |
38 189.36 |
|
PT, billion rubles |
9 943.26 |
11 330.24 |
13 282.70 |
14 830.09 |
17 940.46 |
19 234.19 |
|
PSt, billion rubles |
5 341.79 |
9 366.04 |
15 178.37 |
11 169.99 |
15 658.62 |
20 373.24 |
|
GDPS1 (according to the FTS), % of GDP |
26.1 |
27.4 |
25.3 |
25.2 |
26.5 |
25.4 |
|
GDPS1 (according to the FTS), % of GDP |
32.0 |
29.7 |
23.1 |
29.2 |
28.6 |
24.4 |
|
GDPS2 (according to the FTS), % of GDP |
20.0 |
19.6 |
17.0 |
16.8 |
18.4 |
17.2 |
|
GDPS2 (according to the FTS), % of GDP |
25.8 |
22.0 |
14.7 |
20.7 |
20.6 |
16.2 |
|
Compilation according to: Rosstat data, EMISS, FTS. |
||||||
Figure 1. Dynamics of the shadow economy in Russia in 2014–2019 (before and after adjustment), % of GDP
35.0
30.0
25.0
20.0
15.0
10.0
5.0
0.0
2014 2015 2016 2017 2018 2019
-
• GDP S1 (FTS), %
-
• GDP S2 (FTS), %
—•— GDPS1 (FSSS), %
—•— GDPS2 (FSSS), %
Source: own compilation.
possible to clarify the estimate of Russia’s shadow economy and avoid its overestimation by 6% to 8.5%. Further analysis was carried out on the basis of the adjusted GDPS2 indicators.
The data in Figure 1 shows that the indicators of the volume of the shadow economy, calculated using Rosstat information, differ more from the indicators calculated on the basis of tax reporting data (except for 2016), due to differences in the methodology of formation of the indicator reflecting the officially registered profit of economic entities.
The largest fluctuations of latent GDP are shown in the graph based on Rosstat data. The graph of the dynamics of the analyzed indicator calculated on the basis of the FTS data is more logical and demonstrates insignificant changes since 2016. Since 2014, there has also been a general downward trend in the volume of the shadow economy as calculated by the FSSS.
Researchers of the tax method believe that the data recorded in the tax, rather than statistical reporting is more reliable, because there are penalties for misrepresentation of tax data, which encourages organizations to provide reliable information.
Over the 2014–2019 period under review, the shadow part in the total amount of profits in Russia’s GDP is estimated to vary between 14–26%, and 16– 20%, using data from the FSSS. In 2019, the volume of shadow income in GDP is estimated to be about 17.8 trillion rubles, and 18.9 trillion rubles, based on data from the Federal Tax Service.
For the period 2014-2019 under review, the shadow part of the total profit in Russia’s GDP varies in the range of 14–26% according to estimates using FSSS data, 16–20% using FTS data. In 2019, the volume of shadow incomes in GDP amounted to about 17.8 trillion rubles according to calculations based on FSSS data, and 18.9 trillion rubles, based on data from the FTS.
Further, we carried out an assessment of the shadow economy at the meso-level (in the case of the Kostroma Oblast) using the tax method. The calculation was carried out similarly according to the methodology and formulas presented above. However, the sources of the basic statistical information about the volumes and structure of GRP of the region were collections, reports and publications of the corresponding territorial body of the Federal State Statistics Service (in our case
Kostromastat). The information about the tax base for the profit tax calculation according to the FTS data is also presented in the reports according to the form of statistical tax reporting No. 5–P by subjects.
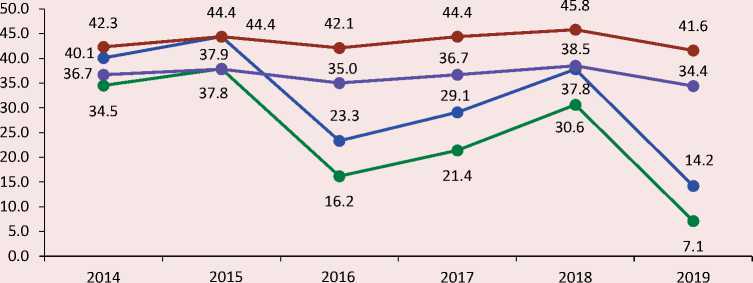
The calculation results of the shadow economy scale of Kostroma Oblast before and after the adjustment are shown in Table 3 and Figure 2 .
The values of the proportion of shadow income in GRP of the Kostroma Oblast vary considerably depending on the source of information about the profit of organizations for the year. The adjustment of the gross profit indicator of the economy and gross mixed income by the volume of depreciation of the main funds of commercial and non-commercial organizations noticeably decreased the resulting indicator by the amount from 5.6 to 7.7% depending on the specific period.
Table 3. Application of the tax method to determine the scale of the shadow economy in the Kostroma Oblast for the period 2014–2019
|
Indicator |
2014 |
2015 |
2016 |
2017 |
2018 |
2019 |
|
GRP, million rubles |
146 731.50 |
160 579.80 |
158 127.50 |
166 945.30 |
180 287.20 |
191 450.801 |
|
W, million rubles |
70 428.80 |
72 624.80 |
73 833.40 |
80 202.60 |
87 546.90 |
95 038.101 |
|
TPr, million rubles |
2 288.90 |
2 440.20 |
2 329.70 |
2 474.20 |
2 755.10 |
2 761.501 |
|
P, million rubles |
74 013.80 |
85 514.80 |
81 964.40 |
84 268.50 |
89 985.20 |
93 651.201 |
|
АCO, million rubles |
7 914.00 |
8 293.00 |
8 965.00 |
10 291.12 |
10 487.38 |
11 449.18 |
|
АNCO, million rubles |
321.00 |
2 258.00 |
2 294.00 |
2 640.27 |
2 638.84 |
2 197.43 |
|
P›, million rubles |
65 778.80 |
74 963.80 |
70 705.40 |
71 343.11 |
76 858.98 |
80 004.59 |
|
PT, million rubles |
15 105.78 |
14 154.20 |
45 066.77 |
35 684.86 |
21 757.06 |
66 448.89 |
|
PSt, million rubles |
11 894.49 |
14 235.65 |
15 421.20 |
10 089.37 |
7 363.95 |
14 096.75 |
|
GRPS1 (according to the FTS), % of GDR |
40.1 |
44.4 |
23.3 |
29.1 |
37.8 |
14.2 |
|
GRPS1 (according to the FSSS), % of GDR |
42.3 |
44.4 |
42.1 |
44.4 |
45.8 |
41.6 |
|
GRPS2 (according to the FTS), % of GDR |
34.5 |
37.9 |
16.2 |
21.4 |
30.6 |
7.1 |
|
GRPS2 (according to the FSSS), % of GDR |
36.7 |
37.8 |
35.0 |
36.7 |
38.5 |
34.4 |
|
1 according to the first estimate of Rosstat. Compilation according to Rosstat, Kostromastat, EMISS, FTS data. |
||||||
Figure 2. Dynamics of the shadow economy in the Kostroma Oblast in 2014–2019 (before and after adjustment), % of GRP
—е— GRP S1 (FTS), % • GRP S1 (FSSS), %
• GRP S2 (FTS), %__________ • GRP S2 (FSSS), %
Source: own compilation.
The calculation of the volume of the region’s shadow economy according to the FTS of Russia shows a clear downward trend (from 34.5% in 2014 to 7.1% in 2019), while the graph of the shadow part of the region’s GRP, obtained using data from the FSSS and Kostromastat on profit before taxation, shows less variability. According to the data adjusted for depreciation, the value of the shadow part of the GRP of the region for the period under consideration was in the corridor of 34.4–38.5%.
In 2019 the value of shadow profit in GRP of the Kostroma Oblast was about 65.9 billion rubles according to calculations based on data from FSSS and Kostromastat, and 13.6 billion rubles based on data from the FTS.
For comparison, we present calculations of the dynamics of the shadow part of GRP by the tax method for four regions (Vladimir, Ivanovo, Yaroslavl, and Kirov oblasts), adjusted for the value of depreciation according to the FTS (Fig. 3) and the FSSS (Fig. 4).
The data presented in Figures 3 and 4 clearly demonstrate a significant difference in the results depending on the selected data source. Thus, Figure 3 shows a clear preponderance in the volume of the shadow part in the GRP of the region in the Yaroslavl Oblast in 2016–2018. At the same time, over the same period the Kostroma Oblast shows an improvement in the size of the shadow economy (reduction of the indicator, especially in 2016 – 16.2%). The histogram of the Vladimir Oblast also shows the most stable downward dynamics.
The histogram in Figure 4, constructed using data from the FSSS on profit before taxation, shows a different situation. Relative to other regions, the volume of shadow income in the GRP of the Kostroma Oblast is quite high, but the largest proportion of “shadow” in the region’s GRP was recorded in 2017 in the Vladimir Oblast (43.1%). According to Figure. 3, the shadow income in the GRP of the Kirov Oblast shows a more stable dynamic.
The calculation results show that the value of the shadow part of GDP in percentage terms at the macro-level is lower than the same indicator in the GRP of the territorial constituent entities under consideration. At the same time, while for Russia as a whole there is a positive dynamics (i.e., reduction of the shadow part of GDP), broken down by region not everything is so unequivocal, therefore, it is
Figure 3. Dynamics of the shadow economy broken down by oblast in 2014–2018 (using data from the FTS), % of GRP
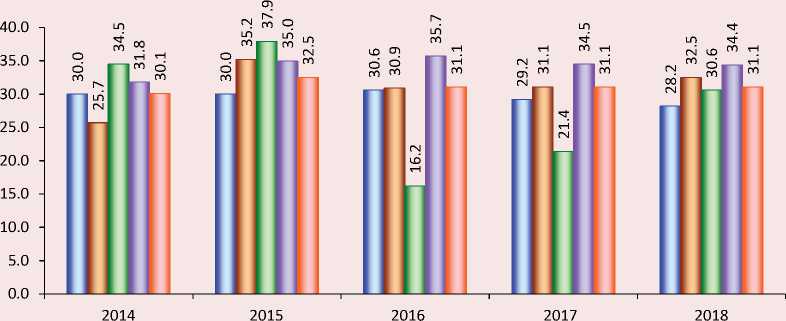
□ Vladimir Oblast о Ivanovo Oblast □ Kostroma Oblast о Yaroslavl Oblast □ Kirov Oblast
Source: own compilation.
Figure 4. Dynamics of the shadow economy broken down by oblast in 2014–2018 (using data from the FSSS), % of GRP
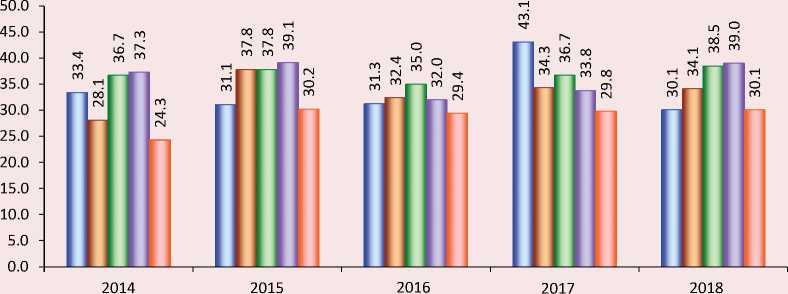
□ Vladimir Oblast □ Ivanovo Oblast □ Kostroma Oblast
□ Yaroslavl Oblast о Kirov Oblast
Source: own compilation.
necessary to pay extra attention to particular regions with the highest proportion of the shadow economy in the country’s GDP (GRPS).
Active work of political and socio-economic institutions of the state is required to develop effective measures to counteract the expansion and further reduction of the shadow economy. Particularly promising are preventive measures to encourage economic agents to come out of the “shadow” on their own and to conduct their activities legally. The most important measures currently being taken include the following (Tab. 4).
Table 4. Measures to reduce the shadow economy
|
Measure |
Purpose |
Concept |
Result |
|
Bank of Russia regulation |
Reducing capital outflows from the country, accompanied in parallel by ridding the system of weak players or those with risky credit policies |
Currency regulation and control1), revocation of licenses from unscrupulous banks |
Over the period of 2005–2016, more than 750 licenses were revoked by the Bank of Russia. The capital outflow from the country due to dubious transactions decreased to 0.5 billion USD by 20162) |
|
Providing necessary information about the risk level of involvement in dubious transactions of potential and existing clients of banks |
Launch in the latter half of 2021 a platform for banks “Know Your Customer” |
The platform will allow allocating bank customers to risk zones based on objective criteria in terms of transactions for the purposes of money laundering and terrorist financing |
|
|
Federal Law No. 115– FZ, dated August 7, 2001 “On countering the legalisation (laundering) of criminally obtained incomes and the financing of terrorism” 3) |
Protecting the rights and legitimate interests of citizens, society and the state by creating a legal mechanism to counter the legalization (laundering) of proceeds of crime, terrorist financing and the financing of proliferation of weapons of mass destruction. |
Regulation of issues in the field of countering money laundering, financing of terrorism, proliferation of weapons of mass destruction |
Reduction in the volume of dubious transactions: in 2020, the volume of money withdrawal abroad in the banking sector decreased from 816 billion rubles in 2014 to 53 billion rubles. The volume of cashout transactions in the banking sector also decreased, from 681 billion rubles in 2014 to 78 billion rubles in 20204) |
Continuation of Table 4
|
Measure |
Purpose |
Concept |
Result |
|
Federal Law No. 376–FZ, dated November 24, 2014 “On amending Parts I and II of the Russian Federation Tax Code (in respect of taxation of the profits of controlled foreign companies)”5) |
Increasing tax collection, making it harder to launder criminal money, and greater clarity about business owners |
The law for the first time: – introduces a mechanism of taxation in Russia of controlled foreign companies’ profits (primarily offshore companies); – changes the rules for recognizing organizations as tax residents of the Russian Federation by introducing the criterion of “place of actual management”; – substantially supplements the norms of the Tax Code of the Russian Federation on the taxation of income of foreign organizations; – restricts the application of international double taxation treaties by means of the “actual recipient of income” rule6) |
Adjustment of the existing tax legislation partially allowed increasing tax collection |
|
Federal Law No.129– FZ, dated August 8, 2001 “On state registration of legal entities and individual entrepreneurs” |
Reducing the number of fly-by-night companies |
Updating the FTS registry information on invalid data, mass addresses and “mass signers” |
By early 2016, the number of fly-by-night companies had dropped from 45% to 15% of the number of registered companies; in 2018, the proportion of such companies in Russian business fell to an all-time low of 7%7) |
|
Federal Law No. 54–FZ, dated May 22, 2003 “On the use of cash registers for settlements in the Russian Federation”8) |
Reduction of unrecorded physical cash flow and the practice of payment of under-the-table wages by organizations and individual entrepreneurs |
Introduction of mandatory online cash registers |
As a result of these measures, unaccounted physical cash flow is disappearing, both in retail and at all suppliers and manufacturers. Gray wages are also becoming a thing of the past: businesses are depleting their sources of unaccounted cash to pay backdoor salary. |
|
Digitalization |
Increasing state control over the cash flow. Increasing transparency of transactions and the ability to fight corruption, illegal transactions, and tax evasion by citizens |
Avoiding cash in settlements; Blockchain Technology; Cryptocurrency. |
In 2020, the Federal Law No. 259–FZ, dated July 31, 2020 “On digital financial assets, digital currency and on amendments to certain legislative acts of the Russian Federation”9) was adopted, which at the legislative level secured the use of such funds. |
|
Federal Law No. 172– FZ, dated June 8, 2020 “On amending Part II of the Russian Federation Tax Code”10) |
Support and economic recovery during the COVID-19 pandemic. Economic support for economic entities (especially small and medium-sized enterprises (SMEs)) |
Expansion of economic assistance measures and tax relief from the state for business entities most affected by the COVID-19 pandemic |
The following categories of taxpayers are exempted: – Individual entrepreneurs engaged in the most affected industries; – legal entities included on the basis of 2018 tax returns in the register of SMEs, engaged in the most affected sectors of the economy; – legal entities included in the register of SONPOs, which since 2017 are recipients of grants of the President of the Russian Federation, subsidies and grants under special programs; – centralized religious organizations, SONPOs established by them, as well as religious organizations included in the structure of centralized religious organizations; – non-commercial organizations included in the register of those most affected by the spread of a new coronavirus infection |
End of Table 4
Measure Purpose Concept Result Decree No. 434, dated April 3, 2020 “On approval of the list of sectors of the Russian economy, most affected by the deterioration of the situation due to the spread of a new coronavirus infection”11) Support and economic recovery during the COVID-19 pandemic. Economic support for economic entities (especially small and medium-sized enterprises (SMEs)) Direct financial assistance to small and medium-sized organizations and individual entrepreneurs from the most COVID-19-affected sectors of the economy on a non-repayable basis Mitigating the effects of the pandemic on SMEs and supporting the functioning of business entities National project “Small and medium sized businesses and support of individual entrepreneurial initiatives” 1) Federal Law No. 173– adopted by the State Du Available at: http://www. 2) Danilov A. The unnece 2017. Available at: htt (accessed: December 23 3) Federal Law No. 115– financing of terrorism” ( 20, 2001. SPS Konsul’tan 4) Anti-money launderin (accessed: December 22 5) Federal Law No. 376–F Federation Tax Code (in 1 State Duma on Novembe 6) Zozulya T. Dangerous 24.12.2020). 7) Vodchits D. Fake Busin ru/biznes/364015-nenast 8) Federal Law No. 54–F 2020): adopted by the St at: http://www.consultan 9) In 2020, the Federal L legislative acts of the Ru 2020. SPS Konsul’tantPl 10) Federal Law No. 172– on May 22, 2020, appro document/cons_doc_LA 11) Decree No. 434, date the situation due to the cons_doc_LAW_349344 Comprehensive improvement of the business climate in Russia FZ, dated December 10, 200 ma on November 21, 2003: a ssary players. Cleansing of t ps:// , 2020). FZ, dated August 7, 2001 “O ed. December 8, 2020): adopt tPlyus. Available at: http://ww g and currency control. The , 2020). Z, dated November 24, 2014 espect of taxation of the profi r 18, 2014: approved by the F ment/cons_doc_LAW_171241 trends in tax control 2020 ess. How Russia is struggling oyashchiy-biznes-kak-v-rossi Z, dated May 22, 2003 “On th ate Duma on April 25, 2003, a t.ru/document/cons_doc_LAW aw No. 259–FZ, dated July 31 ssian Federation”: adopted by yus. Available at: http://www.c FZ, dated June 8, 2020 “On ved by the Federation Counc W_354470/ (accessed: Decem April 3, 2020 “On approval spread of a new coronavirus i / (accessed: December 22, 20 Its structure includes five federal projects: – expanding SMEs’ access to financial resources, including concessional financing; – improvement of conditions for doing business; – acceleration of SME subjects; – creation of a support system for farmers and the development of rural cooperation; – popularization of entrepreneurship 3 “On Currency Regulation and Curr pproved by the Federation Council ( doc_LAW_45458/ (accessed: Dece he banking sector is a reaction to th nvesticii/341387-lishnie-igroki-chist n countering the legalisation (laund ed by the State Duma on July 13, 20 Bank of Russia: official website. A “On amending Parts I and II of the Ru ts of controlled foreign companies) ( ederation Council on November 19, 2 / (accessed: December 20, 2020). . Klerk. 2020. Available at: https:// with fly-by-night companies. Forbes i-boryutsya-s-firmami-odnodnevkam e use of cash registers for settleme pproved by the Federation Council on _42359/ (accessed: December 20, 2 , 2020 “On digital financial assets, the State Duma on July 22, 2020, a amending Part II of the Russian Fed il on June 2, 2020. SPS Konsul’tan ber 21, 2020). f the list of sectors of the Russian e nfection”. SPS Konsul’tantPlyus. Av 20). The projects are aimed at increasing the number of people employed in small and medium-sized businesses to 25 million by 2024, increasing the share of SMEs in the country’s GDP to 32%, and the share of exports from SMEs to 10% of the total ency Control”. (amended December 8, 2020): on November 26, 2003. SPS Konsul’tantPlyus. ber 21, 2020). e outflow of capital from the country. Forbes, ka-bankovskogo-sektora-eto-reakciya-na-ottok ering) of criminally obtained incomes and the 01: approved by the Federation Council on July _LAW_32834/ (accessed: December 21, 2020). ailable at: ssian amended November 12, 2018): adopted by the 014. SPS Konsul’tantPlyus. Available at: http:// (accessed: , 2018, July 9. Available at: i (accessed: December 24, 2020). nts in the Russian Federation” (ed. October 1, May 14, 2003. SPS Konsul’tantPlyus. Available 020). igital currency and on amendments to certain pproved by the Federation Council on July 24, AW_358753/ (accessed: December 21, 2020). eration Tax Code”: adopted by the State Duma tPlyus. Available at: conomy, most affected by the deterioration of ilable at:
The listed measures are of a concrete practical nature, that is, they are already being carried out today by authorized state bodies and organizations.
With regard to economic support for economic entities (especially small and medium-sized enterprises (SMEs)), measures of economic assistance and tax relief from the state are expanding. This is most clearly seen during the coronavirus pandemic. For example, under Federal Law No. 172–FZ, dated June 8, 2020 “On amendments to Part II of the Tax Code of the Russian Federation” certain categories of taxpayers are exempt from paying taxes11. It seems significant and symbolic that the epidemic has actualized the importance and effectiveness of transparent business conduct, since substantial financial support was provided to those business entities that submitted appropriate reporting of their economic activities.
The affected industries The Russian Government approved by the Decree No. 434, dated April 3, 2020 “On approval of the list of sectors of the Russian economy, most affected by the deterioration of the situation due to the spread of a new coronavirus infection”. The list includes catering, services and entertainment, hospitality, cinemas and other industries12.
It is important to note that most regions have their own measures to support SMEs. For example, in the Kostroma Oblast there is a Decree of the Kostroma City Administration dated September 18, 2019 No. 1721 “On approval of the procedure for granting subsidies from the Kostroma city budget to small and medium-sized businesses that are engaged in priority economic activities for the city of Kostroma for partial compensation of costs”, according to which in case the SME subject may be provided with a tender for a particular area:
-
– partial reimbursement of expenses on payment of interest for the use of funds under credit agreements;
-
– partial reimbursement of expenses for training or advanced training of small and mediumsized businesses and their employees;
-
– partial reimbursement of expenses for participation in exhibitions and fairs13.
In addition, thanks to the efforts of the administration and the business community of the Kostroma Oblast, the production of jewelry, which is one of the main economic activities in the Oblast, was added to the list of affected industries.
Therefore, a set of measures is implemented to counteract the shadow economy and its “whitewashing” both at the national level and at the level of individual regions in particular. At the same time, measures are not limited to coercive, punitive and prohibitive impact. It is encouraging that incentives and financial assistance are also carried out at the state level and prove their effectiveness.
Conclusion
The difference in approaches of the leading economic departments (the Federal State Statistics Service and the Federal Tax Service) to determining the scale of the shadow economy at the macro-and meso-economic levels was actualized, which manifests itself in a significant discrepancy in its volumetric indicators.
An improved method for determining the shadow economy, based on the adjustment of the amount of depreciation of fixed assets indicators of gross profit and gross mixed income of commercial and non-commercial organizations, which increases the objectivity of the assessment of the shadow economy, is proposed. This method has demonstrated its applicability both in assessing the shadow economy at the macro-level (on the national scale) and at the meso-level (five constituent entities of the Russian Federation).
Structured, broken down by institutional set of tools, a set of measures to “whitewash” the shadow economy, as well as consider regional actions that contribute to the exit of the economy “out of the shadows”, considering the features of the pandemic coronavirus.
We have structured a set of measures to “whitewash” the shadow economy, broken down by institutional set of tools, and considered regional actions to facilitate the exit of the economy “out of the shadows”, considering the features of the pandemic coronavirus.
References Shadow Economy in Russia: Economic and Statistical Assessment of Its Scale and the Ways of Its Reduction in the Country and Regions
- Afanas’eva A.O. The features of the shadow economy in groups. Nauchnye zapiski molodykh issledovatelei=Scientific Notes of Young Scientists, 2019, vol. 7, no. 3, pp. 74–82 (in Russian).
- Burov V.Yu. Tenevaya ekonomika i maloe predprinimatel’stvo: teoreticheskie i metodologicheskie osnovy issledovaniya: monografiya [The Shadow Economy and Small Business: Theoretical and Methodological Foundations of Research: Monograph]. Chita: Transbaikal State University, 2014. 204 p.
- Drobot E.V., Makarov I.N. Assessment of factors and stressors of the shadow economy: world experience. Tenevaya ekonomika=Shadow Economy, 2021, vol. 5, no. 1, pp. 53–77. DOI: 10.18334/tek.5.1.112236 (in Russian).
- Zarubinskii V.M., Semerenko K.A. New approaches to determining the level of the shadow economy. Tenevaya ekonomika=Shadow Economy, 2021, vol. 5, no. 2, pp. 95–112. DOI: 10.18334/tek.5.2.112015 (in Russian).
- Kapitonova N.V., Kapitonova A.A. The shadow economy in the context of the pandemic COVID-19 in Russia. Tenevaya ekonomika=Shadow Economy, 2020, vol. 4, no. 4, pp. 193–204. DOI: 10.18334/tek.4.4.111865 (in Russian).
- Kireenko A.P., Fedotov D.Yu., Nevzorova E.N. Tenevaya ekonomika i uklonenie ot uplaty nalogov: monografiya. [Shadow Economy and Tax Evasion: Monograph.]. Irkutsk: Irkutsk State Transport University, 2017. 200 p.
- Kupreshchenko N.P. Teoretiko-metodologicheskie osnovy otsenki tenevoi ekonomiki pri obespechenii ekonomicheskoi bezopasnosti Rossii: monografiya [Theoretical and Methodological Foundations for Assessing the Shadow Economy in Ensuring Russia’s Economic Security: Monograph]. Moscow: ITK “Dashkov i K”, 2019. 215 p.
- Latov Yu.V. Ekonomika vne zakona. Ocherki po teorii i istorii tenevoi ekonomiki: monografiya [Economics outside the Law. Essays on the Theory and History of the Shadow Economy: Monograph]. Moscow: Moscow Public Scientific Fund, 2001. 284 p.
- Men’shikov A.S. Methods for assessing the quantitative component of the shadow economy in the Russian Federation Tenevaya ekonomika=Shadow Economy, 2020, vol. 4, no. 3, pp. 111–126. DOI: 10.18334/tek.4.3.110873 (in Russian).
- Fedotov D.Yu., Nevzorova E.N., Orlova E.N. A tax method to calculate the value of the shadow economy of the Russian Federation. Finansy i kredit=Finance and Credit, 2016, no. 15, pp. 20–23 (in Russian).
- Noven’kova A.Z. Characteristics of the economy informal sector. Tenevaya ekonomika=Shadow Economy, 2017, no. 1. DOI: 10.18334/tek.1.1.37630 (in Russian).
- Ryabushkin B.T., Churilova E.Yu. Metody otsenki tenevogo i neformal’nogo sektorov ekonomiki: monografiya [Methods for Assessing the Shadow and Informal Sectors of the Economy: Monograph]. Moscow: Finansy i statistika, 2003. 142 p.
- Enste D.H. The shadow economy in industrial countries. IZA World of Labor, 2018. Available at: https://wol.iza.org/uploads/articles/457/pdfs/shadow-economy-in-industrial-countries.pdf.
- Schneider F. Shadow economies and corruption all over the world: New estimates for 145 countries. Economics: The Open-Access, Open-Assessment E-Journal, 2007, 1, pp. 1–66.
- Enste D.H., Schneider F. Shadow economies: Size, causes, and consequences. Journal of Economic Literature, American Economic Association, 2000, vol. 38(1), pp. 77–114.
- Friedman E., Johnson S., Kaufmann D., Zoido-Lobaton P. Dodging the Grabbing Hand: The determinants of unofficial activity in 69 countries. Institutional & Transition Economics eJournal, 1999. Available at: https://pages.ucsd.edu/~aronatas/project/academic/unofficial%20economy%20by%20friedman%20et%20al.pdf.
- Eilat Y., Zinnes C. The shadow economy in transition countries: Friend or foe? A policy perspective. World Development, Elsevier, 2002, vol. 30, no. 7, p. 1237.
- Goel R.K., Saunoris J.W., Schneider F. Growth in the shadows: Effect of the shadow economy on U.S. economic growth over more than a century. Contemporary Economic Policy, 2019, vol. 37, issue 1, pp. 50–67.
- Almenar, Vicent, Sánchez J., Sapena J. Measuring the shadow economy and its drivers: The case of peripheral EMU countries. Economic Research-Ekonomska Istraživanja, 2020, vol. 33, pp. 2904–2918.
- Berdiev, Aziz N. & Saunoris, James W. Financial development and the shadow economy: A panel VAR analysis. Economic Modelling, Elsevier, 2016, vol. 57(C), pp. 197–207.
