Shape-Based Wound Localization in Diabetic Foot Ulcer Using Foot Thermograms

Author: Naveen Sharma, Satbir Singh, Ashu Rastogi, Mirza Sarfaraj, Prasant Kumar Mahapatra
Journal: International Journal of Image, Graphics and Signal Processing @ijigsp
Article in issue: 6 vol.16, 2024.
Free access
The early detection of diabetic ulcers using thermal imaging is an important aspect of non-invasive medical instrumentation. An accurate assessment of a diabetic foot ulcer (DFU) using a machine-based approach requires a crystal-clear region of interest (ROI) of the foot ulcer. Different shapes based on automatic contour determination after the segmentation procedure can act as a major guide for the purpose of appropriate localization of the ROI. The purpose of this paper is to present a novel shape-area-based analysis for precisely localizing the ROI from the patient’s foot. The novel data set, which is suitable for Indian healthcare settings, was created at PGIMER hospital Chandigarh with the support of specialized clinicians. A comparison of various cutting-edge segmentation techniques was carried out. The quantitative analysis concluded that the average area (AA) of ROI, derived from different shapes, was extremely close to the ground truth values and thus offered a better prospective to automatically examine the ulcer area.
Diabetes, Foot Ulcer, Thermal imaging, Segmentation, Ulcer shape
Short address: https://sciup.org/15019566
IDR: 15019566 | DOI: 10.5815/ijigsp.2024.06.03
Text of the scientific article Shape-Based Wound Localization in Diabetic Foot Ulcer Using Foot Thermograms
Diabetes is a chronic condition. One out of every six diabetics worldwide resides in India. In the majority of nations, diabetes has been designated a "public health priority" due to its increasing prevalence. In a developing country like India, most of the population with diabetes experiences a substantial cost burden. According to the International Diabetes Federation [1] India is the diabetes capital of the world. With 73 million diabetics in 2017, India had the second-largest diabetic population, behind China. In addition, by 2045, the number is expected to nearly double.
Diabetic foot is one of the most severe consequences of diabetes. The diabetic foot has a significant impact on the patient’s quality of life. There is a 25% chance that a diabetic patient will develop a foot ulcer, which can lead to amputation or even death [2, 3]. In recent years, medical diagnosis has increasingly emphasized the use of noninvasive technologies. A significant reason behind their evolution is that these non-invasive technologies are passive and provide almost no harm to the patient [4]. The imaging technique is also one of the non-intrusive technologies that play a critical role in disease diagnosis. Various types of imaging, such as ultrasonography, and magnetic resonance imaging (MRI), [5, 6] have been used in the medical arena, but these are costly, observer-dependent, and radiative. For these reasons, researchers have vested their interest in another imaging modality known as “thermal imaging”, which captures the body heat radiated by humans. This technique is non-radiative, non-intrusive, and contactless.
Using thermal imaging to find the exact location of a diabetic foot ulcer based on its shape can help in many ways, such as:
Early detection of foot ulcers: thermal imaging can detect temperature changes in the skin caused by inflammation or tissue damage that can indicate the presence of a developing foot ulcer. This can allow for early intervention and treatment, which can prevent the ulcer from progressing to a more advanced stage.
Accurate wound localization: Thermal imaging can provide a clear visualization of the wound and surrounding tissue, allowing for accurate measurement and localization of the ulcer. This can be helpful for treatment planning and monitoring the healing progress of the wound over time.
Non-invasive and painless: Thermal imaging is a non-invasive and painless technique that can be performed quickly and easily without causing any discomfort to the patient. This can make it a good choice for people who don't want to go through more invasive diagnostic tests.
Objective and quantitative measurement: Thermal imaging provides objective and quantitative measurement of the temperature changes associated with diabetic foot ulcers, which can be helpful in determining the severity of the ulcer and tracking the effectiveness of treatment over time.
2. Related Work
According to a large number of studies, unexpected variation in the temperature profile of the human body indicates some abnormality; otherwise, it maintains an inherent temperature profile [7]. Since Hippocrates [8] there has been a link between human body temperature and health. However, because quality equipment and technical know-how were scarce in the beginning, it took some time for an established advancement to take place.
Image segmentation practice facilitates the identification of hot spots and cold spots in thermal images [9-11]. Therefore, analysis of the hotspot as a region of interest (ROI) in an image facilitates automatic disease diagnosis and provides a comprehensive forecast of the situation [9] After the preliminary preprocessing step, ROI segmentation is typically performed in the earliest stages of thermographic analysis. FCM, [10–12] K-means, [11–14] Otsu’s thresholding, [15] and deep convolutional neural network-based Differential Feature Clustering (DFC), [16] are a few widely used segmentation techniques, particularly for thermal imaging-based segmentation to explore the ROI or hotspot in medical counterparts.
Appropriate segmentation always facilitates the identification and extraction of the region of interest, which aids in the eventual development of an automatic disease diagnosis system. However, image segmentation is always a difficult task due to various noises and the blurry nature of images. Some obstacles, such as over-segmentation, undersegmentation, missed segmentation, etc., result in inaccurate diagnosis of diseases associated with the spread of inflammation. Therefore, one must select an appropriate segmentation algorithm to minimize such occurrences. In addition, the nature of the ROI to be extracted is crucial to the segmentation procedure. For complete region segmentation, thresholding and edge detection techniques [17–20] are primarily used, whereas, for specific anatomical regions, feature-based approaches [21–24] utilizing geometric, anthropometric, and local thermal features are primarily developed. In general, clustering and region-based methods, [10, 11, 25–28] are applied to diseased-area segmentation.
In the recent past, numerous techniques have been utilized to extract the ROI from a DFU image. Separately, edge detection and watershed techniques [19] were used to segment ulcers from the foot, and it was determined that edge detection performed more reliably. Nonetheless, Hernandez- Contreras et al. [29] used an obstructive device to provide good thermal contrast during data acquisition to eliminate poor contrast in foot thermal images. C Liu et al. have used active contours without edges and the left-right foot registration method for abnormity detection in the diabetic foot [30]. In addition, the author proposed an asymmetry analysis for ulcer localization [31]. The intensity-based registration, edge detection, and point-to-point mean difference methods were applied to ulcer detection using a smartphone [39]. Several advanced methods, such as image fusion and an active contour process, have been developed to improve diagnosis [18, 30–32].
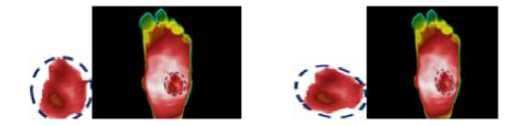
Due to the irregular DFU shape (illustrated in Figure 1), any ROI segmentation method that takes the shape analysis parameter into account can provide a better perspective. To our knowledge, no research study has addressed the impact of shape on DFU ROI detection.
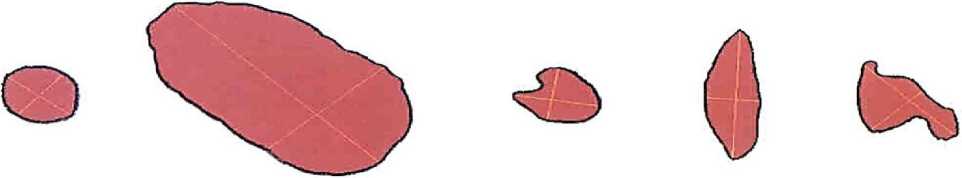
Fig. 1. Irregular ulcer shape
Considering the efforts of researchers in this field, the primary objective of this manuscript is to present a novel shape-area-based method for precisely localizing a diabetic foot ulcer on a patient’s foot. The ROI is evaluated using different geometrical shape parameters, which supports a robust evaluation. The remaining sections of the manuscript include sections on methodology, results, discussion, and conclusion.
3. Work Methodology
The following figure 2 demonstrates the general concept of the proposed methodology. The methodology sections detail how the novel dataset was created from DFU patients and how the foot ulcer area (ROI) was labelled by the medical expert. In addition, appropriate segmentation techniques were studied and used to isolate the region of interest. Various shape parameters were studied considering the various ulcer shapes. In the conclusion, comparative performance was discussed in the results and discussion sections.
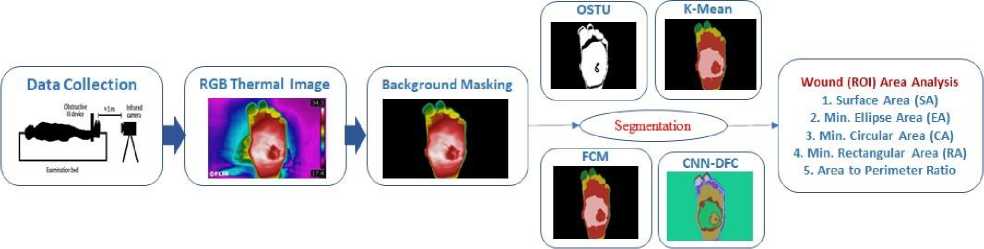
Fig. 2. Block Diagram of proposed methodology
-
3.1. Diabetic foot Ulcer dataset
In order to analyze diabetic foot ulcers (DFU) using thermal images, it is necessary to establish a standard imaging dataset. Ethical approval (Ref. No-2020/000170) was received from the Research Ethics Committee of the Post Graduate Institute of Medical Education & Research (PGIMER) Chandigarh in order to collect the standard dataset of DFU patients.
-
3.2. Expert Labeling of the Ground truth
-
3.3. Techniques used for image segmentation
The DFU images were obtained using the FLIR E60 thermal camera, as shown in figure 3. The image resolution of the camera is 320 × 240 pixels, and the field of vision is 25 × 19 degrees. The wavelength operating range in the infrared spectrum is between 7.5 µm and 13 µm, and the thermal sensitivity is below 0.07oC. A standard data acquisition protocol was followed, consisting of a constant distance between the subject and the imager (1 m), a controlled ambient room temperature between 18-25oC, a stabilization time of 15 minutes for the patient, and minimal infrared interferences such as external IR radiation, non-reflective background, etc.
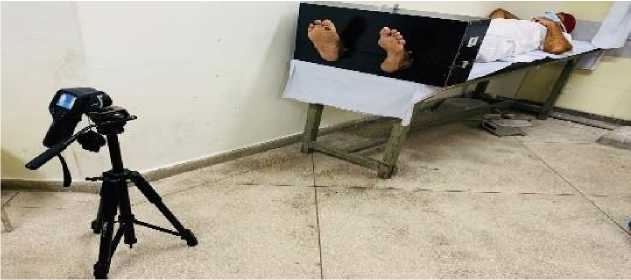
Fig. 3. Data acquisition setup at PGIMER Chandigarh
The medical professional from PGIMER Chandigarh generated the ground truth. The subject matter expert delineated the region of interest (ROI), from which the area of diabetic foot ulcers was determined for various ROI shapes.
Diabetic foot ulcer contour shape analysis using thermal images can be achieved using various image processing and analysis techniques. One approach is to extract the contour of the ulcer region using segmentation techniques, such as Otsu's method or k-means clustering, FCM, and then analyze the shape of the contour using shape descriptors. Shape descriptors are mathematical features that quantify the shape characteristics of the contour, such as the area, perimeter, circularity, elongation, and solidity. Another approach is to use deep learning-based methods, such as convolutional neural networks (CNNs), to directly extract the shape features from the thermal image. CNNs can learn the hierarchical representations of the image features, including the shape features, and provide accurate segmentation and contour detection of the ulcer region.
Once the shape features of the ulcer contour are extracted, they can be analyzed to identify any irregularities or abnormalities that may indicate the severity or progression of the ulcer. For example, a high degree of irregularity or asymmetry in the contour shape may indicate a more severe ulcer or a higher risk of infection. Overall, shape analysis of diabetic foot ulcer contour using thermal images can provide valuable information for the diagnosis, treatment, and monitoring of the ulcer.
A few segmentation techniques were chosen to segment the DFU based on a review of the relevant literature. The chosen methods are OTSU threshold-based, K-Means, Fuzzy C-Means (FCM), and an unsupervised deep convolutional neural network-based Differentiable Feature Clustering (DFC), etc. Intriguingly, all of these methods are independent of training requirements and may be immediately applied to any unknown dataset. There are several variations in the foot’s shape, size, and kind of ulcer, so the data obtained from diabetic foot ulcer patients is also subjective. Consequently, training with the pre-collected data is not an effective and, computation cost-wise, budget-able mechanism. It is well-known in the literature that these conventional techniques, viz. OTSU, K-Means, and FCM, have been widely used for IRT-based segmentation purposes. Finally, the conventional approaches are compared with the deep learning algorithm. Brief descriptions of these algorithms are provided here.
-
3.3.1. OTSU Threshold-based segmentation
-
3.3.2. K-Mean Clustering Algorithm
-
3.3.3. FCM segmentation
Generally, image thresholding is used to segment an image based on its pixel intensity. A grayscale image and a threshold are usually the inputs to such a thresholding algorithm. However, one of the drawbacks of this method is determining the threshold value manually. We may manually test how good a threshold is by experimenting with various threshold values, but this is time-consuming and can fail in the real world. As a result, we’ll need a way to calculate the threshold automatically. Auto thresholding is well-exampled by the Otsu method, named after its founder, Nobuyuki Otsu. Otsu algorithm uses the standard of maximum interclass variance. This method processes the image histograms and minimizes variance among different class segments.
Otsu's method is a thresholding-based segmentation technique that separates the foreground (ulcer region) from the background (healthy tissue) by computing an optimal threshold value that minimizes the intra-class variance of the image. It works well when there is a clear boundary between the foreground and background regions.
The K-means algorithm is one of the most widely used methods of clustering. It is an unsupervised algorithm that is used to separate the area of interest from the surrounding area. K-means is an iterative algorithm that minimizes the sum of distances between each object and its cluster centroid, as per the algorithm in Table 1.
Table 1. K-mean clustering algorithm
|
K-Mean clustering Algorithm |
|
|
Let p(x,y) is the input pixel and ck -cluster center |
|
|
Step 1 |
Define the number of clusters centers ‘k’ |
|
Step 2 |
Calculate the Euclidean distance ‘d’ between the center and each pixel in the image using the correlation. d = | p(xj) - cjl |
|
Step 3 |
Assign all pixels to the nearest center based on the distance ‘d’. |
|
Step 4 |
Recalculate the new position of the center by using the correlation shown below after all pixels were assigned. c=12 2 pXx’y) у ECk XECk |
|
Step 5 |
Continue the process until the tolerance or error value is met. |
|
Step 6 |
Reconstruct image by using the identified clusters |
K-means clustering is an unsupervised machine learning algorithm that partitions the image into k clusters based on the similarity of the pixel intensities. The pixels belonging to the same cluster are considered to be part of the same region. It works well when the ulcer region has a distinct color or intensity.
The conventional hard clustering method assigns each point in the data set to a single cluster. As a result, the segmentation results from this approach are frequently very straightforward, i.e., a pixel can only belong to a particular class. But, in many real-world situations, issues such as overlapping intensities, limited spatial resolution, variation in intensity inhomogeneities, low contrast, and noise complicate this difficult (crisp) segmentation task. The introduction of the partial membership concept in fuzzy set theory gave clustering algorithms a new direction. Among fuzzy clustering methods, the FCM algorithm is the most frequently used in image segmentation due to its robustness to ambiguity and ability to retain significantly more information than the existing segmentation methods. The only difference between the K-means and the FCM method is the concept of partial membership in clusters. This concept makes the FCM (shown in Table 2) more realistic than the other clustering methods. The degree of membership of each pixel in each cluster is represented by a fuzzy membership function. It works well when there is overlap between the ulcer region and the healthy tissue.
-
3.3.4. DFC based unsupervised segmentation using CNN
-
3.4. Shape-based analysis of extracted ROIs
The CNN-based differential feature clustering (DFC) segmentation technique assigns labels to pixels that indicate the cluster to which the pixel belongs. The main advantage of this technique is that it reduces the combination of similarity loss and spatial continuity loss to find the desired solution. The steps for this algorithm are tabulated in Table 3.
Table 2. Fuzzy C-mean clustering algorithm
|
Fuzzy C-Mean clustering algorithm |
|
|
Step 1 |
Set Number of Cluster. |
|
Step 2 |
Minimize objective function. ' N с Jfcm ( U,V,X) = ^ ^ Uyd2(x ,, v^.l < m < ^ i=l j=l Where, V = {v*, v2,... , VW} is center and X = {x * , x2 ,..., xW} consist N pixels , m (m>1) = blur component, d2 (xt, V j ) Euclidean Distance (Cluster center to object хД Щ j is the memberships degree. |
|
Step 3 |
Define the clustering center. |
|
Step 4 |
Initialize the membership matrix (ujj). |
|
Step 5 |
Update the clustering center using matrix. |
|
Step 6 |
Update the membership matrix. _ 1 XL U j X Ul,j 2 , V yW ..m d “ |
|
Step 7 |
Reshape matrix pixel into image. |
Table 3. Unsupervised learning algorithm
|
Unsupervised learning algorithm |
|
|
Step 1 |
Input RGB image fed into the CNN model |
|
Step 2 |
Feature Extraction using the following model: 2D Convo. (3x3, p) ^ ReLU activation function ^ Batch Normalization |
|
Step 3 |
Back Propagation using the following model: 1D Convo. (1x1, q) ^ Batch Normalization |
|
Step 4 |
Normalize Response Map |
|
Step 5 |
Feature similarity loss and Spatial continuity loss are computed and backpropagated. |
|
Step 6 |
Argmax Classification. |
|
Step 7 |
Cluster Labels { Cn }. |
Once the segmented images are obtained using different segmentation approaches, the next task is to analyze the ROI from these images. However, from a comprehensive analysis point of view, it is endorsed to go for different shapebased comparisons rather than the single ROI shape to determine the extracted ROIs’ accuracy. Therefore, the ROIs from the different segmented images are extracted in the form of free-flowing contours, rectangular, circular, and elliptical shapes. The illustration for the ROI extraction in different shapes is presented in figure 4.
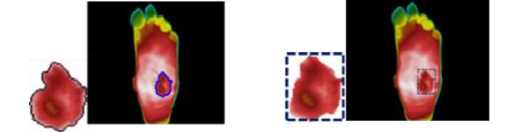
(a)
(b)
(c) (d)
Fig. 4. Illustration of ground truth images and corresponding segmentation outputs for different shapes viz. a) Free form contours-based ROI, b) Rectangular shape-based ROI, c) Circular shape-based ROI, and d) Elliptical shape-based ROI
4. Experimental Results
Experiments were performed to compare the performance of different segmentation techniques and their ability to precisely determine the ROI in case of a foot ulceration condition. The data was acquired from patients suffering from diabetic foot ulcers. Thermal images of diabetic foot ulcer patients are shown in figure 5. The first column of the table contains the input image of the patients, whereas the second column consists of the ground truth images labelled by the medical expert. The output of ROI generation using different segmentation techniques, i.e., OTSU, K- Means, FCM, and CNN-based unsupervised differential clustering algorithm (DFC) [16], is shown in figure 5.
The segmented output is presented in the upper half of each respective column, and in the lower half, the extracted contour is depicted to obtain a statistics-based evaluation. We made use of different shape-based parameters like Contour Surface Area (SA), Minimum Enclosing Ellipse Area (EA), Minimum Enclosing Circle Area (CA), Minimum enclosing Rectangle Area (RA), Average Area (AA), Contour Parameter (CP), and Area to Perimeter Ratio (APR). Parameter SA was the surface area equal to no. of pixels in the area under the ROI contour curve. The area in the form of a minimum enclosing ellipse (EA), circle (CA), and rectangle (RA) were also determined to provide extra insights into the proportional aspects, respectively. To count the number of bounding pixels, the perimeter of the curve (CP) was calculated. The analysis of the performance of segmentation algorithms in the context of ROI extraction. Also, these are the most common shapes that are employed even for manual ROI extraction. Further, it was shown in [33] that the area alone is not a sufficient measure; instead, the ratio of surface area to the perimeter (APR) is a better option when making any comparisons. Several studies [34–38] have opted to use APR. It is believed that APR is a reliable parameter for a different type of shape analysis. The results of these analyses for various DFU images are shown in Table 2.
Moreover, to illustrate the effectiveness of each segmentation approach, a square root error in terms of a Euclidian distance (ED) measure is calculated using the following equation:
ED^ = 7( GTp - Sp )2 (1)
Where, GTP represents the Ground truth value for a particular parameter P (P can be SA, CA, RA, EA, AA, CP, or APR), and SP denotes the same parameter value for any of the segmentation method-based outputs. S can be OTSU, K-Means, FCM or, CNN-DFC. Further, the plots corresponding to the shape area-based parameters have been shown in figure 6. In this figure, the X-axis corresponds to the different shape-based areas, whereas the Y-axis represents the ED value. The different curves are linked with different segmentation algorithms.
For example, the EDOTSU states the ED between the ground truth ROI value and the ROI value obtained by applying the OTSU segmentation method. Similarly, Euclidian distance was calculated for other segmentation methods, i.e., EDKM, EDFCM, and EDDFC. The ED corresponding to the APR parameter for all the images is presented in a bar graph representation shown in figure 7. The lowest values in these plots indicate the best performance.
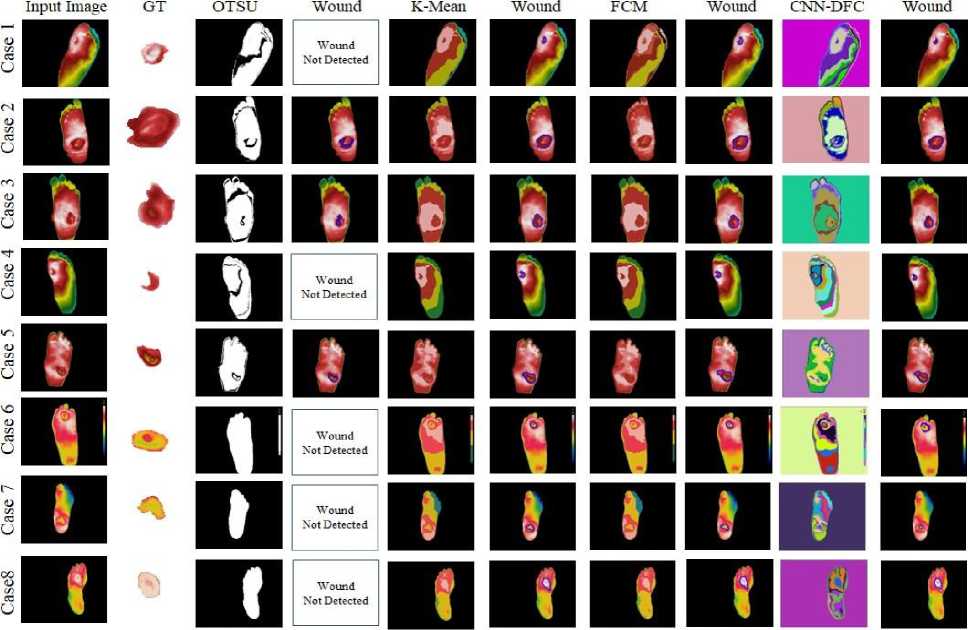
Fig. 5. Results of Segmentation on the Diabetic Foot ulcer
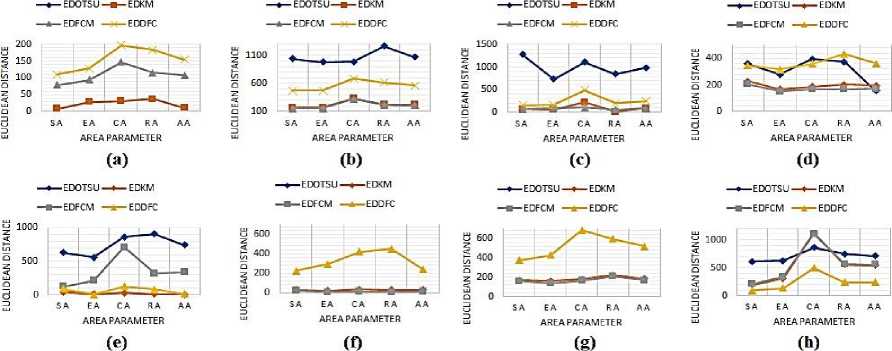
Fig. 6. Plot of Euclidian distance between the ground truth and the individual segmentation approach-based ROI extracted for various shape-based rea parameters in correspondence to the input images: a) Case 1, b) Case 2, c) Case 3, d) Case 4, e) Case 5, f) Case 6, g) Case 7, and h) Case 8.
s
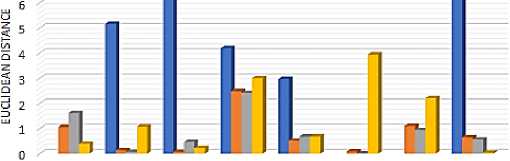
Casel Case 2 Case 3 Case 4 Case 5 Case 6 Case 7 Case 8
IMAGES
OOTSU ИК-Mean ■ FCM ■ DFC
Fig. 7. Euclidian distance between ground truth and the individual segmentation approach-based ROI for various input images’ area to perimeter ratio
Table 4. Values of different shape-based area parameters for the extracted ROI for the various input images
|
Case |
Result |
Ground Truth |
OTSU |
K-mean |
Fuzzy C-Mean |
CNN-DFC |
|
Case1 |
SA |
204 |
- |
196 |
283 |
94 |
|
EA |
235 |
- |
207 |
329 |
107 |
|
|
CA |
387 |
- |
418 |
534 |
189 |
|
|
RA |
316 |
- |
279 |
432 |
133 |
|
|
AA |
286 |
- |
275 |
394 |
131 |
|
|
SP |
104 |
- |
65 |
79 |
40 |
|
|
Ratio |
1.96 |
- |
3.02 |
3.58 |
2.35 |
|
|
Case2 |
SA |
1390 |
350 |
1218 |
1235 |
916 |
|
EA |
1456 |
478 |
1283 |
1303 |
982 |
|
|
CA |
2080 |
1087 |
1747 |
1754 |
1397 |
|
|
RA |
1878 |
611 |
1652 |
1663 |
1261 |
|
|
AA |
1701 |
632 |
1475 |
1489 |
1139 |
|
|
SP |
163 |
104 |
145 |
146 |
123 |
|
|
Ratio |
8.53 |
3.37 |
8.4 |
8.46 |
7.45 |
|
|
Case3 |
SA |
2026 |
749 |
1960 |
2099 |
1876 |
|
EA |
2076 |
1347 |
2013 |
2176 |
1912 |
|
|
CA |
3305 |
2194 |
3084 |
3414 |
2817 |
|
|
RA |
2726 |
1883 |
2716 |
2784 |
2530 |
|
|
AA |
2533 |
1543 |
2443 |
2618 |
2284 |
|
|
SP |
191 |
211 |
186 |
207 |
173 |
|
|
Ratio |
10.61 |
3.55 |
10.54 |
10.14 |
10.84 |
|
|
Case4 |
SA |
494 |
134 |
267 |
289 |
148 |
|
EA |
513 |
235 |
344 |
363 |
196 |
|
|
CA |
653 |
1046 |
466 |
487 |
293 |
|
|
RA |
648 |
274 |
444 |
480 |
216 |
|
|
AA |
577 |
422 |
380 |
405 |
213 |
|
|
SP |
86 |
87 |
82 |
87 |
54 |
|
|
Ratio |
5.74 |
1.54 |
3.26 |
3.32 |
2.74 |
|
|
Case 5 |
SA |
1226 |
594 |
1184 |
1350 |
1142 |
|
EA |
1286 |
724 |
1300 |
1499 |
1282 |
|
|
CA |
2024 |
1160 |
2051 |
2738 |
2149 |
|
|
RA |
1760 |
851 |
1750 |
2079 |
1680 |
|
|
AA |
1574 |
832 |
1571 |
1916 |
1563 |
|
|
SP |
143 |
106 |
147 |
171 |
145 |
|
|
Ratio |
8.57 |
5.6 |
8.05 |
7.89 |
7.88 |
|
|
Case 6 |
SA |
395 |
- |
368 |
376 |
172 |
|
EA |
400 |
- |
381 |
395 |
694 |
|
|
CA |
540 |
- |
505 |
528 |
962 |
|
|
RA |
510 |
- |
483 |
504 |
960 |
|
|
AA |
461 |
- |
434 |
451 |
697 |
|
|
SP |
79 |
- |
75 |
75 |
162 |
|
|
Ratio |
5 |
- |
4.91 |
5.01 |
1.06 |
|
Case 7 |
SA |
508 |
- |
338 |
348 |
132 |
|
EA |
575 |
- |
413 |
436 |
149 |
|
|
CA |
890 |
- |
711 |
724 |
208 |
|
|
RA |
770 |
- |
547 |
563 |
176 |
|
|
AA |
686 |
- |
502 |
518 |
166 |
|
|
SP |
100 |
- |
85 |
84 |
46 |
|
|
Ratio |
5.08 |
- |
3.98 |
4.14 |
2.87 |
|
|
Case 8 |
SA |
610 |
- |
806 |
817 |
710 |
|
EA |
624 |
- |
933 |
964 |
762 |
|
|
CA |
862 |
- |
1972 |
1972 |
1361 |
|
|
RA |
750 |
- |
1306 |
1319 |
988 |
|
|
AA |
712 |
- |
1254 |
1268 |
955 |
|
|
SP |
94 |
- |
138 |
138 |
110 |
|
|
Ratio |
6.49 |
- |
5.84 |
5.92 |
6.45 |
5. Discussion
After applying the OTSU threshold to the grayscale version of the input image, the output shown by the binary segment image does not give the precise regions required to identify the foot ulcer region. Hence, it did not return any valid contour output. It can be seen from the output of the OTSU segmentation for image cases number 1, 4, 6, 7, and 8 in Table 4. On the other hand, after applying K-Means, Fuzzy C-Means, and the DFC, an effective segmentation image was obtained, as shown in the corresponding columns of Table 4. The segmented foot image contour extraction algorithms generated the desired contour output, as shown in Figure 5.
However, it is to be noted that for image case 1, due to over-segmentation by DFC, the contour output is smaller in the area than the original ground truth region. Whereas the K-Means and Fuzzy C- means clustering algorithms could fetch out a bigger region closer to the ground truth. A similar kind of performance was also observed for cases 4, 6, and 7. The DFC again over segments the images, thereby restricting the actual diseased region. However, the performance of the DFC is equally good as of the K-means and FCM for case 8, in which it avoided the superfluous region below the interested region.
The qualitative analysis discussed above is supported by the quantitative analysis of the calculated parameters. The Euclidean distance between the respective parameters for the ground truth and the segmentation algorithms follow the same pattern as discussed earlier for cases 1, 4, 6, 7, and 8.
For cases 2, 3, and 5, all the algorithms provide such a segmented output, from which a reasonable contour can be extracted using a standard technique as presented in Section 2.4. However, it was noticed that the OTSU segmentation incurs an under-segmentation issue; due to this reason, it cannot segment the affected region completely. On the other hand, the rest of the region can be segmented. The corresponding outputs can be visualized in the separate columns in Table 4. The parameter values can also reinforce the above analysis. There is a vast difference between the ground truth parameters and the OTSU outcome parameters, but the difference is less for the other three algorithms, i.e. K- Means, Fuzzy C-Means and DFC. Among these three algorithms, for cases 2 and 3, FCM performs well for almost all the shape-based parameters, whereas the performance of the K-Means clustering algorithm is a little low. On the other hand, the performance of the DFC is also reasonable. However, for case no. 5, the K-Means algorithm performs the best.
Therefore, based on the comprehensive analysis of the results obtained, it can be inferred that the Fuzzy C-means and the K- Mean algorithm performed better overall, followed by the CNN-based clustering method. However, it was also concluded that the performance of the OTSU threshold-based segmentation was not up to the mark for the early detection of the diabetic foot ulcer region using thermal images as a data set. Although the CNN-based method is a powerful image segmentation method, for the present application case, its performance was not on par with that of traditional machine-based clustering algorithms.
6. Conclusion
The crucial component of this research is that we have applied the techniques to a novel data set and have performed a statistical-based evaluation by using different shape parameters, viz. SA, CA, EA, RA, PA, AA, and APR. Following a thorough review of various segmentation techniques used in biomedical thermal imaging, a few suitable (for small data sets) methods for automatic ROI segmentation were chosen. A comparative analysis of the chosen methods, i.e., the thresholding-based OTSU technique, clustering-based K-means, Fuzzy c-means, and CNN-based DFC, shows that the average area (AA) of the desired ROI gives results that are much closer to the ground truth than the area extracted from the single shape. Hence, the analysis of ROI area using different shapes has given a more robust judgement criterion for validating the performance of segmentation algorithms in the context of ROI extraction. To summarize, one can say that shape-based diabetic foot ulcer localization using thermal imaging can provide important benefits in early detection, accurate localization, non-invasiveness, and objective measurement of diabetic foot ulcer. It is a valuable tool for healthcare professionals in providing effective care to diabetic foot ulcer patients.
References Shape-Based Wound Localization in Diabetic Foot Ulcer Using Foot Thermograms
- “http//www.diabetesatlas.org/across-the-globe.html,” (2018).
- A. Rastogi and A. Bhansali, “Diabetic Foot Infection: An Indian Scenario,” J Foot Ankle Surg (2016).
- A. Rastogi, G. Goyal, and R. Kesavan, “Long term outcomes after incident diabetic foot ulcer: Multicenter large cohort prospective study (EDI-FOCUS investigators) epidemiology of diabetic foot complications study: Epidemiology of diabetic foot complications study,” Diabetes Res Clin Pract (2020).
- W. J. Yang and P. Yang, “Literature survey on biomedical applications of thermography,” Biomed Mater Eng (1992).
- S. Bhasin and P. P. Cheung, “The Role of Power Doppler Ultrasonography as Disease Activity Marker in Rheumatoid Arthritis,” Dis. Markers (2015).
- L. Hunt, G. Eugénio, and A. J. Grainger, “Magnetic resonance imaging in individuals at risk of rheumatoid arthritis,” Best Pract. Res. Clin. Rheumatol (2017).
- B. B. Lahiri, S. Bagavathiappan, T. Jayakumar, et al., “Medical applications of infrared ther- mography: A review,” Infrared Phys. Technol (2012).
- E. Ring, “The historical development of temperature measurement in medicine,” Infrared Phys Technol (2007).
- M. K. Bhowmik, S. Bardhan, and K. Das, “Pain related inflammation analysis using infrared images,” Thermosense: Thermal Infrared Applications XXXVIII (2016).
- M. Etehadtavakol, V. Chandran, E. Ng, et al., “Breast cancer detection from thermal images using bispectral invariant features,” Int J Therm Sci (2013).
- M. Etehadtavakol, S. Sadri, and E. Ng, “Application of K- and fuzzy c-means for color seg- mentation of thermal infrared breast images,” J Med Syst (2010).
- M. Diakides, J. Bronzino, and D. Peterson, “Fuzzy C Means Segmentation and Fractal Anal- ysis of the Benign and Malignant Breast Thermograms,” Medical Infrared Imaging (2012).
- U. Snekhalatha, M. Anburajan, and V. Sowmiya, “Automated hand thermal image segmen- tation and feature extraction in the evaluation of rheumatoid arthritis,” Proc Inst Mech Eng Part H J Eng Med (2015).
- S. Shahari and A. Wakankar, “Color analysis of thermograms for breast cancer detection,” 2015 International Conference on Industrial Instrumentation and Control (2015).
- M. S. Jadin and S. Taib, “Recent progress in diagnosing the reliability of electrical equipment by using infrared thermography,” Infrared Phys. Technol (2012).
- W. Kim, A. Kanezaki, and M. Tanaka, “Unsupervised Learning of Image Segmentation Based on Differentiable Feature Clustering,” IEEE Trans Image Process 29, 8055–8068 (2020).
- A. Duarte, L. Carrão, and M. Espanha (2014).
- J. Gauci, O. Falzon, and K. P. Camilleri, “Automated segmentation and temperature extrac- tion from thermal images of human hands, shins and feet,” IFMBE Proceedings (2016).
- G. L. Nandagopan, B. Haripriya, and A, “Implementation and comparison of two image seg- mentation techniques on thermal foot images and detection of ulceration using asymmetry,” International Conference on Communication and Signal Processing (2016).
- N. Selvarasu, S. Vivek, and N. M. Nandhitha, “Performance evaluation of image process- ing algorithms for automatic detection and quantification of abnormality in medical thermo- grams,” Proceedings - International Conference on Computational Intelligence and Multi- media Applications (2007).
- D. Hernandez-Contreras, H. Peregrina-Barreto, and J. Rangel-Magdaleno, “A quantitative index for classification of plantar thermal changes in the diabetic foot,” Infrared Phys Technol (2017).
- J. Singh and A. S. Arora, “A framework for enhancing the thermographic evaluation on char- acteristic areas for paranasal sinusitis detection,” Infrared Phys Technol (2017).
- M. Marzec, R. Koprowski, and Z. Wróbel, “Automatic method for detection of characteristic areas in thermal face images,” Multimed Tools Appl (2015).
- E. Sousa, R. Vardasca, J. Mendes, et al., “Towards the automatic detection of hand fingertips and phalanges in thermal images,” Lect Notes Comput Vis Biomech (2018).
- M. Etehadtavakol, E. Ng, and N. Kaabouch, “Automatic segmentation of thermal images of diabetic-at-risk feet using the snakes algorithm,” Infrared Phys Technol (2017).
- N. Golestani, M. Etehadtavakol, and E. Ng (2014).
- N. Mohiyuddin and P. Dhage, “Rheumatoid Arthritis Detection Using Thermal Imaging and Fuzzy-C-Means algorithm,” Int J Comput Math Sci 3, 46–55 (2014).
- S. Umapathy, S. Vasu, and N. Gupta, “Computer Aided Diagnosis Based Hand Thermal Image Analysis: A Potential Tool for the Evaluation of Rheumatoid Arthritis,” J Med Biol Eng (2018).
- D. Hernandez-Contreras, H. Peregrina-Barreto, and J. Rangel-Magdaleno, “Automatic clas- sification of thermal patterns in diabetic foot based on morphological pattern spectrum,” In- frared Phys Technol (2015).
- C. Liu, F. V. D. Heijden, and M. E. Klein, “Infrared dermal thermography on diabetic feet soles to predict ulcerations: a case study,” Advanced Biomedical and Clinical Diagnostic Systems XI (2013).
- C. Liu, J. J. V. Netten, and J. G. V. Baal, “Automatic detection of diabetic foot complications with infrared thermography by asymmetric analysis,” J Biomed Opt (2015).
- L. Vilcahuaman, R. Harba, and R. Canals, “Automatic analysis of plantar foot thermal images in at-risk type ii diabetes by using an infrared camera,” IFMBE Proceedings (2015).
- H. N. Mayrovitz and L. B. Soontupe, “Wound areas by computerized planimetry of digital images: accuracy and reliability,” Adv Skin Wound Care (2009).
- D. R. Gorin, P. R. Cordts, W. W. Lamorte, et al., “The influence of wound geometry on the measurement of wound healing rates in clinical trials,” J Vasc Surg , 80021–80029 (1996).
- D. Cukjati, S. Reberšek, R. Karba, et al., “Modelling of chronic wound healing dynamics,” Med Biol Eng Comput (2000).
- D. Cukjati, M. Robnik-Šikonja, and S. Reberšek, “Prognostic factors in the prediction of chronic wound healing by electrical stimulation,” Med Biol Eng Comput (2001).
- D. Cukjati, S. Reberšek, and Miklavcˇicˇ, “A reliable method of determining wound healing rate,” Med Biol Eng Comput (2001).
- D. J. Margolis, E. A. Gross, C. R. Wood, et al., “Planimetric rate of healing in venous ulcers of the leg treated with pressure bandage and hydrocolloid dressing,” J Am Acad Dermatol (1993).
- Fraiwan, Luay, Mohanad AlKhodari, Jolu Ninan, Basil Mustafa, Adel Saleh, and Mohammed Ghazal. "Diabetic foot ulcer mobile detection system using smart phone thermal camera: a feasibility study." Biomedical engineering online 16, no. 1 (2017): 1-19.
