SIFT-BZM: Pixel Based Forgery Image Detection Using Scale-Invariant Feature Transform and Block Based Zernike Moments
Author: Kshipra Ashok Tatkare, Manoj Devare
Journal: International Journal of Image, Graphics and Signal Processing @ijigsp
Article in issue: 1 vol.17, 2025.
Free access
New area of image processing termed "digital image forensics" aims to gather quantifiable proof of a digital image's authenticity and place of origin. Detection of forgery images to look for copied and pasted portions; however, depending on whether the copied portion underwent post-processing before being transferred to another party, the detection method may differ. Zernike Moments and Scale-Invariant Feature Transform (SIFT) combined are unique techniques that aid in the identification of textured and smooth regions. But compared to SIFT separately, this combination is the slowest. So in the proposed work, Block based image division and SIFT based key point detection model is developed to detect forgery images. The gathered images are poor visual quality and various dimension, so it is resized and converter grayscale conversion. In addition, pixel values of images are improved using optimal Gaussian filter and adaptive histogram equalization which remove noise and blurring based on sigma value. Then, using the SIFT key point extraction algorithm to extract the image's key point and compute the feature vector of each key-points. In that using a block based matching technique to split the pre-images into blocks, and each blocks are diagonally subdivide. Length of the feature vector is computed using Zernike moments of each blocks. Both SIFT features and Zernike moments features are matched to identify the manipulated image from the given data. The proposed model provides 100% recall, 98.2% precision, and 99.09% F1_score. Thus provide the proposed model was effectively detects forgery image in the given data.
Digital Image Forensics, Scale-Invariant Feature Transform, Key Point, Zernike Moments, Block Based Image Division
Short address: https://sciup.org/15019652
IDR: 15019652 | DOI: 10.5815/ijigsp.2025.01.06
Text of the scientific article SIFT-BZM: Pixel Based Forgery Image Detection Using Scale-Invariant Feature Transform and Block Based Zernike Moments
News is vital because it informs people about happenings both inside and outside of their immediate surroundings [1]. Studies have indicated that most adults now get their news digitally, through search engines and social media, instead of through traditional media. But in the eighteenth century, something happened that would permanently alter news reporting [2]. This was the beginning of fake news. But without the invention of the internet, its current rate of growth would not have been feasible. Even those without sufficient training in photography or digital image processing can now readily change digital images due to the rise in image faking incidents [3]. False photos are frequently used in conjunction with fake news to elicit strong emotions from readers. Discover a plethora of images on digital media in the current digital era. These photos are an important source of information, but they could be altered for amusement or to disseminate false information.
Enhancing a recognizable evidentiary framework to determine an images' reliability and eliminate the possibility of fabrication is the primary goal of digital image forensics [4]. Forensic research and law enforcement rely heavily on images, including those of criminals, crime scenes, and biometrics. Ensuring image integrity is crucial when used as evidence in court. Images serve as proof of a crime, but if their veracity is questioned, it can cause issues. Digital images are commonly used in sensitive applications, such as trial judgments and evidence production. Developing effective and feasible methods for detecting image scams is crucial. Numerous methods of recognition have been developed recently. Researchers prioritize passive techniques over others because they only require the image itself and don't require any prior data. Since forgeries cannot be seen identified, passive tactics examine the digital image's underlying statistical characteristics [5]. To find the fake image, the digital image properties are obtained and analysed during the detecting procedure. One kind of image manipulation among several is copy move forgeries. The technique of copying an object or a digital image's surrounding area and moving it to a different place within the same image is referred to as "copy-move" [6]. This is typically done to hide undesirable portions of the image or alter the message it conveys. Copy-move forgeries that are categorized, including basic copy-move, multiple copy-move, copy-move, and mirrored copy-move with image inpainting.
The technique of copy-move forgery contains pasting and copying an image, which results in nearly identical color, noise level, intensity range, and other features [7]. When all that is known about the attack is the image itself, it becomes more difficult to detect forgeries. Geometric modifications, such as scaling and rotating the duplicated parts before pasting them somewhere else in the same image, are employed in various tactics to mask the footprint of forgery or tampering, making it appear authentic [8]. Certain image processing techniques, such as boosting texture and brightness, are also employed to hide the dishonest intent to alter or falsify an image. A further psychological effect of altered images is the disturbance of previously formed memories, which influences judgments concerning the falsified image. Some techniques were utilized for detecting forgery images like Scale-Invariant Feature Transform (SIFT) [9], Watershed Segmentation, Density-Based Spatial Clustering with Noise [10], Gaussian Pyramid Decomposition [11], CenSurE keypoint detector [12], CNN model and FREAK. Those are not useful for smooth textures or images with dense textures, and it has a poor recognition time and false matching for huge textured photos and is also unstable when scaling changes. To overcome these impacts, the novel technique of block-based image cloning using SIFT and Zernike moments, poses unique difficulties due to its ability to preserve the background information within the image. The key contribution of the proposed approach was illustrated as follows;
• Block-based image cloning and SIFT based key point detection model is developed to detect manipulated or fabricated images.
• Gathered images are pre-processed using dimensional resizing, greyscale conversion, optimal Gaussian filter and adaptive histogram equalization.
• Pre-images are extracted using the local SIFT key point model which weighted the key points matches based on Euclidean distance.
• Block based detection model is utilized to divide the overlapping blocks and diagonally divide each blocks into four sub-blocks.
• Finally compute the Zernike moments for each sub-blocks to detect the manipulated or fabricated part at the given image.
• Combine both SIFT key point extraction and block based Zernike moments extraction to detect forgery image.
2. Literature Review
The remaining portions of the manuscript are divided into the following sections: A portion of the research on manipulated or fabricated image prediction is presented in Section 2. In Section 3, an image forgery detection technique is described. The results and analysis of the proposed work are presented in Section 4, and the general conclusion of the proposed work is defined in Section 5.
In the realm of digital media platforms, individuals have the ability to upload tampered or forged images. Ensuring the security of digital images is a critical issue across various industries. Several approaches were utilized for detecting forgery or manipulated images from the internet. A few approaches that were recently introduced were reviewed as follows,
Rao et al. [13] suggested a deep convolutional neural network (CNN)-based method for detecting and localizing image forgeries that integrates a multi-semantic CRF-based attention model. To boost generalization capabilities, multiscale attention maps with different semantics are used to fully utilize local and global information. A CNN model was then integrated for efficient image forgery localization and detection. The impacts of this model was poor detection accuracy and time consumption.
Song et al. [14] developed a three-step method for detecting image forgeries based on motion blur. Initially, a motion blur kernel reliability estimation based on a CNN. Second, an approach to identify image tampering based on shared motion blur kernels is devised. Third, an effective mechanism for localizing tampered areas is introduced: consistency propagation. It will, however, fail when rotation occurs because it depends directly on the difference in MBKs of neighbouring image patches.
Dua et al. [15] suggested a method for detecting forgeries is presented that takes advantage of artefacts that result from editing JPEG-encoded images. The test image and its cropped variant are subjected to an evaluation of proposed features after a few rows and columns are removed from the upper left corner of the images. However, when the method was used on pictures with vast, identical textured sections, it produced a lot of false matches.
Wu et al. [16] introduced a comprehensive training program to combat the shared forgeries on OSN. While the latter is intended to both finish the former and account for the flaws in the detector itself, the latter simulates the noise created by the OSNs' reported operations. The performance decreases for the resizing and Gaussian blurring are slightly higher, at about 3%. However, it makes it more difficult to apply in practice and dramatically raises the expense of training.
Kasban and Nassar [17] developed image manipulation attacks and sufficient capability to identify even minute image tampering characterize an accurate method for digital image forgery detection. The RGB image is first converted to YCbCr space, and the chrominance-red component Cr is then used to extract features for the Hilbert-Huang Transform (HHT). This approach's specificity may be reduced, but its detection accuracy may increase as a result of the compressed image training.
Wu et al. [18] suggested a straightforward but efficient self-supervised learning task to classify 385 different forms of picture alteration in order to learn robust image manipulation traces. It is not restricted to any one sort of forgery or manipulation since it finds local anomalous features that indicate the presence of faked pixels. If clean pixels are minorities, ManTra-Net will flag them as manufactured. But this conduct needs to be punished.
Rathore et al. [19] represented an Improved Relevance Vector Machine for Copy-Move based image forgery detection and classification. To identify the fake images, the Biorthogonal Wavelet Transform is utilized in conjunction with Singular Value Decomposition-based feature extraction. Clone vector occurrences are detected based on the threshold value and the Minkowski distance. However, the image was impacted by standard image processing techniques like compression, rotation, and noise addition.
Bibi et al. [20] suggested a pre-trained AlexNet and VGG16 are used for the extraction of picture features, while several structures stacked autoencoders are introduced for the detection of forgeries in various image compression schemes. For the categorization of real and fake images, the Ensemble Subspace Discriminant classifier is used. Yet this model needs a large amount of labelled data and takes a long time to process.
Walia et al. [21] represented a combination of deep features extracted from the image's brightness channel and manually created features based on color attributes, patterns essential for precise fraud identification are mined. To extract a 512-D feature vector named "ResFeats" from the final layer of the model's convolutional base section, local binary feature maps are fed into the pre-trained ResNet-18 model. Yet, the main obstacle to this analysis is the large dimensionality of fused features.
Vega et al. [22] developed a digital picture authentication technique based on the Colour Filter Array interpolation pattern's quadratic mean error, which is computed from the examined image. This conversion aims to facilitate colour separation through the use of HSV values. Nevertheless, the key point-based approaches have a visual output issue because the regions that are copied and pasted are made up of lines and points that don't produce an understandable and appealing visual impact.
The above-mentioned techniques are well performance at their specific period, however, it have some impacts like poor detection accuracy, time-consuming [13, 20], failure to detect at rotation [14], false matches [15], increased training cost [16], decrease its specificity [17] and high dimensionality of fused features [21]. To overcome these impacts an advanced forgery detection model is proposed to detect manipulated or fabricated images on social media. The working process with its numerical modelling of the proposed model was discussed in the following section.
3. Proposed Methodology
Digital image forgery detection is an important topic because of how easily digital images may be manipulated. With the sophisticated copy-move forgeries that can be achieved with the most recent image editing programs, it is nearly
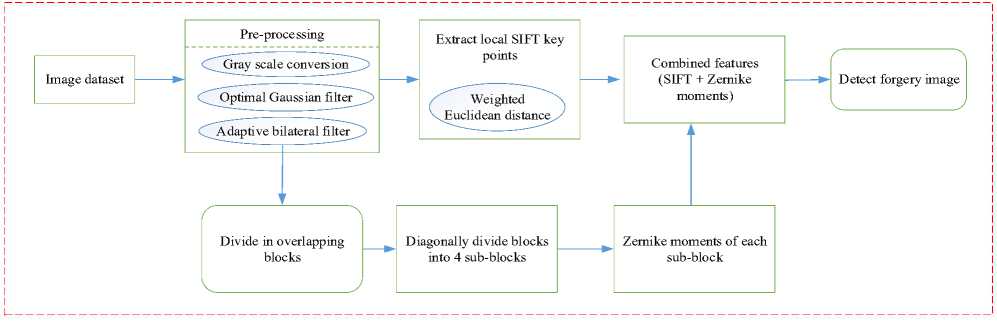
Fig. 1. Architecture of proposed forgery detection model impossible to determine the validity of an image based solely on its appearance. To locate and identify fraud in digital images, a copy-move forgery detection technique must be developed. Fusion of the global Zernike moments features with the local SIFT descriptor in the proposed approach provides several advantageous aspects. Changes in size and rotation do not affect the key points that the SIFT descriptor extracts very much. Also, in Zernike moments on sequent, it is discovered that the amalgamation of these contrasting feature sets exhibits resilience against numerous modifications commonly observed in modified images. Figure 1 shows the proposed system architecture.
The manipulated or fabricated forgery image detection working process was illustrated in Figure 1. It contain images collected from the online source, it has various dimension and poor visual quality. Thus, pre-processing techniques like resizing and grayscale conversion are used on the images to enhance their quality and transform them all into a uniform range. Further, the pixel quality was improved through using an optimal Gaussian filter, and the performance of the filter process was improved through using Harris hawks optimization. Then, extract local SIFT key points from the image based on the weight of each matched key points. The weight of the matches were computed using Euclidean distance. On another hand, the images are divided into overlapping blocks, further these blocks are diagonally divide four sub-blocks. Applying Zernike moments to find the value of each sub-blocks to detect the forgery images. The numerical process of the proposed model was stated as follows,
-
3.1 Pre-processing
The forecasts were inaccurate since the images were taken at a small scale, had low visual quality, and contained little information. Through the use of image processing and image balance procedures, the model generates a picture of exceptional quality. This section discusses image pre-processing in considerable detail.
-
a) Grayscale conversion
The images were obtained in online and are in the x, y, and z dimensions. Grayscale conversion is then used to further transform the images into the x and y dimensions. Grayscale representations are frequently utilized for descriptor extraction rather than directly working on colour images since they simplify algorithms and need less computing power. Due to its primary focus on two spatial dimensions (2D) rather than three, it facilitates easier visualization and allows one to distinguish between an image's highlights and shadow features. The numerical model of grayscale conversion is,
Y = 0.299 R + 0.587 G + 0.114 В (1)
Where, R , G and В denote red, green and blue colours respectively. There is also less complexity in colour. The grayscale conversion photos are next subjected to resizing.
-
b) Resizing
To cut down on processing time, the image must first be cropped and resized to 256 x 256 pixels. The computed term for resizing images is shown by Equation (2) to be,
p ( X , У )=∑Lo ∑ ^aijX^1 (2)
Where, У signifies height in pixel, x represents width in pixel, and a^ denotes the squared area in the image.
-
c) Optimal Gaussian filter
Gaussian low-pass filter is an effective image processing filter that can enhance an image's quality and enhancement. The image is smoothed using a method known as the Gaussian filter, which lowers noise and improves sharpness. The Gaussian function finds widespread application because of its ability to derive a probability distribution for data and as it serves as a smoothing operator. The general mathematical expression for the Gaussian filter can be obtained from Eqn. (3), x2+y2
G ( X , У )=2ТГ67^ (3)
Where, G ( x , У ) represents the Gaussian filter value, a is the standard deviation of the Gaussian distribution, and x and У stand for row and column. Significantly, the standard deviation affects the Gaussian filter's response.
Sigma in a Gaussian filter describes the level of blurring. Large sigma values will only cause significant blurring and have an impact on the sharpening of the image for higher template sizes. To enhance image sharpening, an appropriate sigma selection is necessary. In the proposed model optimal Gaussian filter is employed to improve the prediction process. Using meta-heuristic algorithm nto optimize the sigma parameter in the Gaussian filter thus improves the sharpness of the image. The population-based optimization methodology known as the Harris Hawks Optimization Algorithm (HHO) can be applied to any optimization problem as long as it is properly formulated because it is a gradient-free optimization strategy [23].
i. Steps involved in selecting optimal values of sigma
The Optimal parameter of the Gaussian filter contains sigmoid activation function that are optimally selected to detect the optimum performance of the classifier. The proposed HHO based optimal solution of the Gaussian filter is described step-by-step as follows:
Step 1: Initialization
In HHO, the first stage is to initialize a set of random solutions, from which the global solution the best solution is observed. In the proposed model, initialize the parameter of the Gaussian filter as an input of the total population in HHO.
Xi (к) — ^ ,a2 ,... mm
Where, M denote the overall solution set.
Step 2: Fitness function
An objective function called a fitness function is used to find a solution to a given problem that is almost as good as the perfect solution to the desired problem. Here, the fitness is considered as mean square Error (MSE). Smaller error is closer to the controller system’s desired values.
Fitness — m in(J)
J = ^lyr(t)-Pnl where, yr(t) denotes the reference value, Pn denotes the observed value and J represent MSE.
Step 3: Updation
Update until it reaches the optimal value, and update each iteration value according to the mountaineer position. By using the equation (7), the solutions can be updated.
„ _ {^rand(O-nIXrnnаЮ~2Г1 X(t)| <7 >0.5
(£+15 t(* rnb ыА) — Xm(t) - r^LB + r4( BB - LB )) q < 0.5
Where, X(t + 4 ) denote next iteration position vector, q ,r ,r2 ,r2 and r4 are random numbers. UВ and LВ are upper and lower bound, Xrnnd (f) signifies random select hawk, Xm represent the average position, X (t) signifies the current position vector, Xr n bbt1 (t) signifies rabbit position.
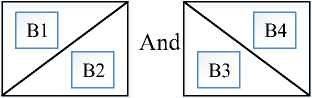
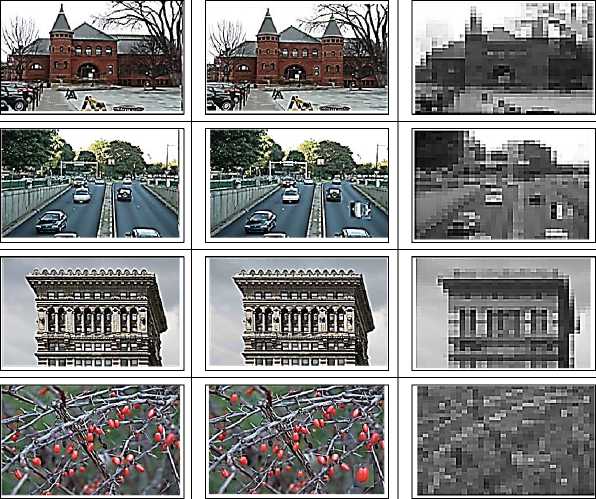
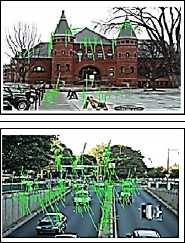
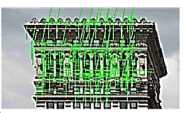
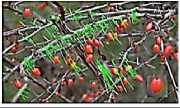
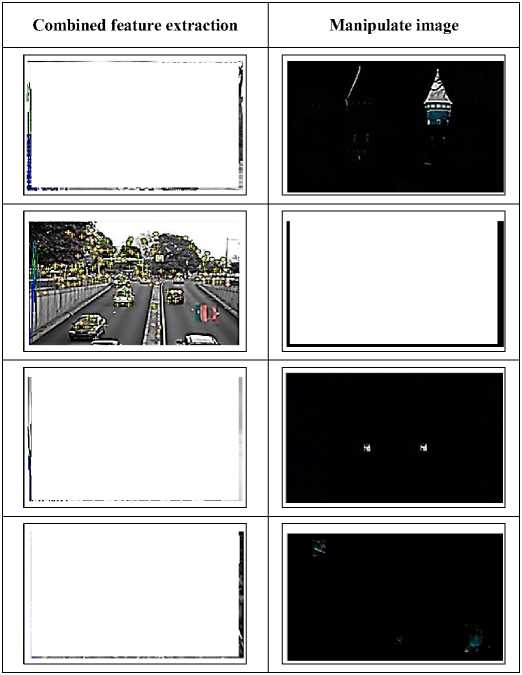
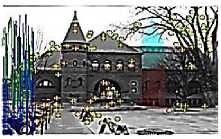
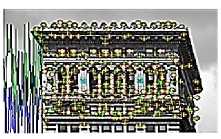
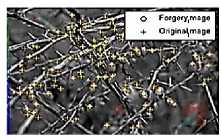
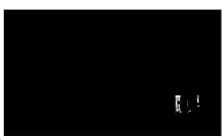
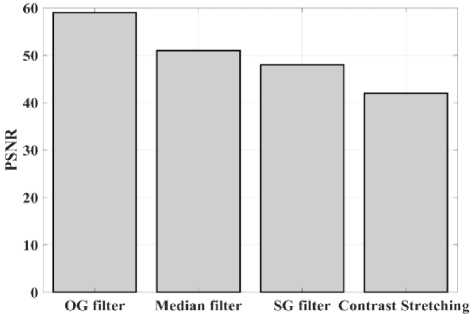
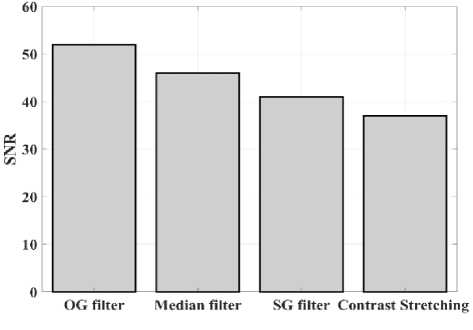
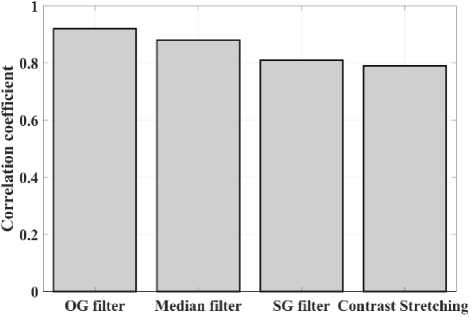
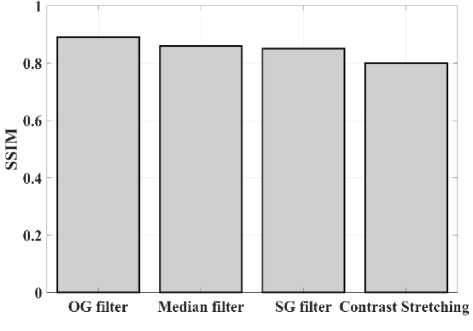
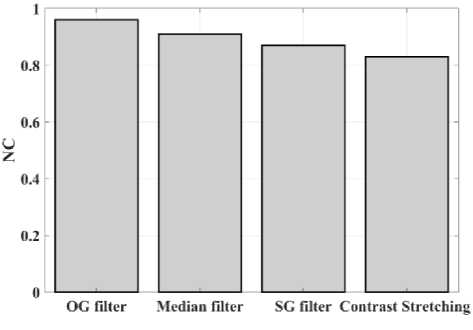
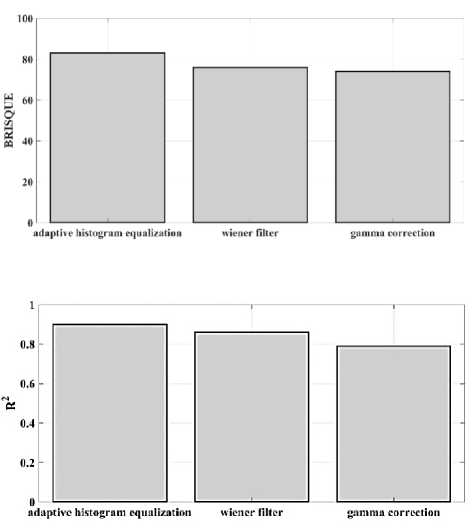
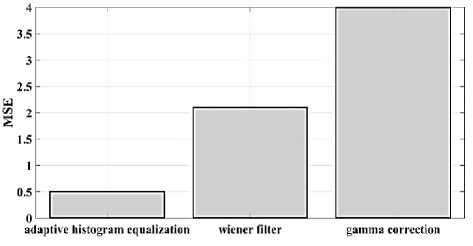
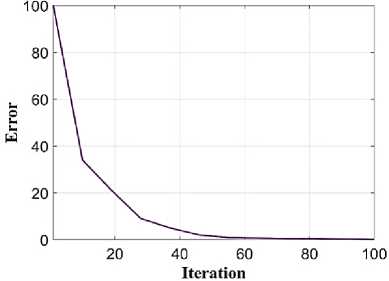
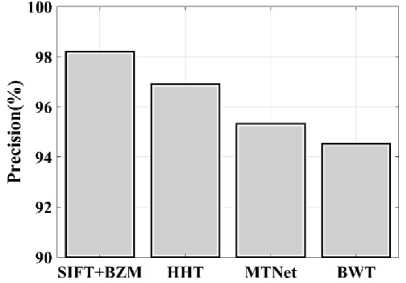
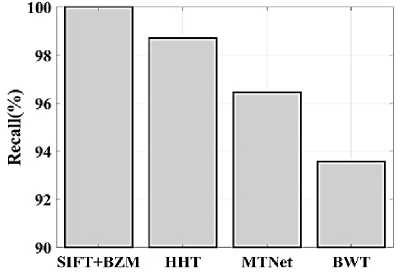
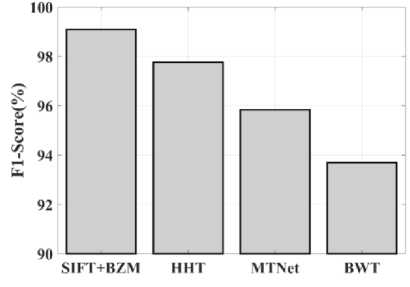
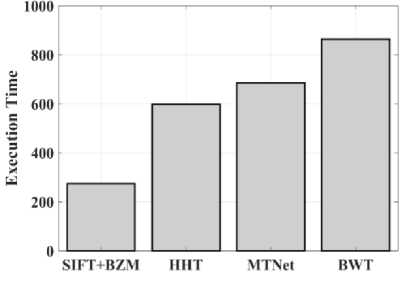
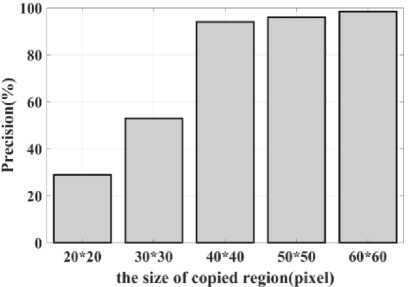
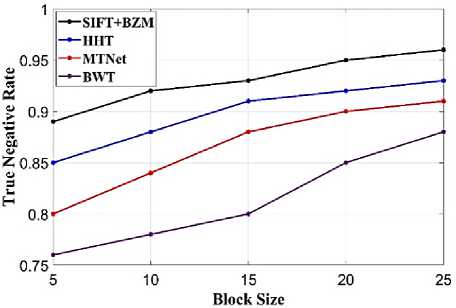
(Y if F(Y) Where, Y denote the next position of hawk, and Z represent levy flight function based patterns. Step 4: Termination After determining the best solution of action that is appropriate for identifying knee disease and grading. After noise removal, the image contrast was improved by using adaptive histogram equalization (AHE) whose explanation is given below. d) Adaptive histogram equalization (AHE) The contrasting qualities of the input images may be further enhanced by using AHE, which is comparable to histogram equalization. Assume that the pixel in the original denoised brain tumor image has the grey value is denoted as r (0 < r < 1) and p(r) specifies the probability of its density. The pixel in the enhanced image has the grey value is specified ass (0 < s < 1), p (s) signifies the probability of its density and s — T (rr represents the mapping function. Every point on the equalized histogram is of the same height, which is evident from the histogram's physics interpretation. ps(s)ds — pr(r)dr (9) Assume that the interval of the monotonically growing function is considered as s = T (r) and its monotonically increasing inverse function is taken as r — T~^s). A pixel in the enhanced image has a grey value, is the next discrete condition, equation (10) gives the mapping connection. ft — (m- 1-)T(r) — (m-1) Zk - о ^ (10) Where q k denote the number of pixels with к til grey level, m specifies the number of grey levels contained in the original image, as well as Q represents the overall number of pixels in an image. If an image has n different grey levels and pi represent the itil gray level occurrence probability, then the entropy of that level can be described as the following equation (11), e (i) = ~Pil о gpt (11) The entropy of the complete image is estimated using equation (12). E = У e^Q = - Z-1pi log pi (12) From equation (12) shows that E will grow to its greatest value if p0 = p12 = •pn-1 = “■ In other words, when the adaptive histogram equalization of the image has a uniform distribution, the entropy of the entire image is at its highest. After improving the contrast of the image, the extraction of the local key point was done using the SIFT model which is briefly discussed in the following section. 3.2 Extract local SIFT key point The SIFT approach transforms the image into a set of local feature vectors. It is desirable for these feature vectors to be independent of image scale, rotation, and translation. First stage feature locations are found using the local extrema of Difference of Gaussians (DOG). The DOG pyramid is implemented by iteratively convolving the input image with a Gaussian kernel. This method is repeated as long as down-sampling is feasible. An octave is a collection of pictures with the same dimensions. The Gaussian pyramid, which is denoted by the 3D function L( x , y, a), is created by combining all of the octaves. L(x,y,a) = G (x,y,a) * I (x,y) (13) Gaussian function is expressed as: 1 - (*2-У2 ) G (x,y,a) = ^e '2 (14) Where, * denote convolution operator, (( x, y) denote input image, G(x,y, a) denote variable scale Gaussian, and a denote scale space. Important aspects of SIFT, the method applied to scale-space extrema in the difference-of-Gaussian operations convolved with the picture, D (x, y, a), can be calculated from the difference of two adjacent scales divided by a multiplicative factor k. This makes possible points that are not varying in scale and orientation identifiable. One method for finding scale-space extrema, D (x,y, a), is the difference of Gaussians. It involves calculating the distinction between two images, one with a scale times the other. D(x,y,a) = (G(x,y,ka) - G(x,y, )r)* *I(x,y) (15) D(x,y,a) == L^x, y, ka) - L(x, y, a) (16) After that, images are arranged into an octave that corresponds to doubling a. After the images are obtained, key locations are identified as the local maxima or minima of the DOG image. This is achieved by comparing every DOG pixel to its corresponding nine neighbours at different scales and eight neighbours at the same scale; if the comparison's value differs from the comparable value, note it as an interesting point. 3.2.1 Keypoint Localization A large number of key point candidates, some of which are unstable, are produced via scale-space extrema discovery. At this moment, only stable key points are kept after important points have been filtered. Once a key point candidate has been identified by comparing a pixel to its neighbours, the correct location, scale, and ratio of primary curvatures are determined by carrying out an extensive fit to the neighbouring data. This data makes it possible to remove points that are poorly positioned along an edge or have low contrast. It is necessary to make the orientation assignment rotation invariant; to do this, construct 36 bin histograms, each with a magnitude of 10 degrees. After that, the key point is given the maximum orientation. This assignment helps produce accurate results and adds to the consistency of matching. For every image sample ( , ) , the gradient magnitude ( , ) and direction ( , ) are determined using pixel differences at the keypoints scale . m(x,y) = J(L(x + 1,y) - L(x - 1,y)f + (L(x,y + 1) - L(x, у - 1)) (17) в (x,y) + tan- 1(^+1) tto г)) (18) (X+1,y)-L(X-1,y) The earlier methods assigned an image position, scale, and orientation to each key point in order to ensure rotation, location, and scale invariance of the images. The next step is to compute distinct descriptor vectors for every key point that can withstand various disruptions, such as illuminations, etc. As an array of orientation histograms on 4x4 pixel neighbourhoods, compute the feature descriptor. The orientation histograms are orientated with respect to the keypoint orientation, and the orientation data is derived from the Gaussian picture with the same scale as the keypoint. Every descriptor has a 4x4 array with sixteen histograms centred on the keypoint; each histogram has eight bins. For the purpose of measuring the similarity between the two irises templates, the template generated during the feature extraction process needs to be matched with an appropriate metric. When comparing templates belonging to the same person, similarity metrics should yield values that are comparable or identical; when comparing templates belonging to different people, however, values that differ depending on the value of the threshold should be reported. Using Euclidean distance (ED), the right choice is ascertained. This is the most commonly used measurement. The square root of the total squares of the vector difference squares is used to calculate Euclidean distance. By comparing the test iris vector (VT) to the specified vector (VC), the ED is determined, ED = /Z(VT — VC)2 (19) The outcome of the SIFT key point detection process is given to the block based forgery image detection performed using Zernike moment which is explained in the upcoming section. 3.3 Block based method The cover image is divided into 3x3 non-overlapping blocks. In the event that the cover image's width and height cannot be divided by three, the boundary region's block subdivision is modified in accordance with the quantity of remaining pixels. After that, the values are converted into the range that corresponds to gray-level pixels in the logistic map matrix. For example, the remainder of xi is multiplied by 256 and then rounded to an integer. Subsequently, the logistic map matrix is split into non-overlapping 3×3 blocks. Lastly, the central pixel for each 3×3 block is utilized to swap out its surrounding pixels. Using the mask matrix results in substantially higher peak points because of the strong correlation between neighbouring pixels in the cover image. Figure 2 shows the Zernike moment calculation of each subblock. Fig. 2. Zernike moment calculation of each sub-block Calculating the Zernike moment is a crucial step in block-based image fraud detection methods. It is employed in the examination and computation of the Zernike moment for every block in the test image. Instead of using the entire original image to calculate the moment, the approximate foreground component will be employed in this proposed method. The mappings of an image onto a collection of complex Zernike polynomials are known as Zernike moments. A set of orthogonal basis functions transferred over the unit circle are called complex Zernike functions. By projecting a pattern onto those functions, one can create its Zernike moments. Three primary attributes exist. The 2D Zernike moment of order n with repetition of m is found by examining a continuous image function f(x,y~) that vanishes outside the unit circle. Znm = ^ Hx2y2^1f(x, y)^(20) Where, (n — |m|) denote non-negative, m signifies integer and n denotes non-negative integer. Zernike basis function Vnm(p, 0) is expressed as, Vnm(p, 0) = Rnm(p)exp(jm0)(21) Where, Rnm(p, д') denote nth order of Zernike radial polynomial which is termed as R (сЛ-Х(n-lml)/2 к-------(n-fc)!---^_nn-2k nnm(p) ^k-0 ( 1) fc,| п-2к+[тУ^п-2к-[т]ур(22) The Zernike moment's magnitude remains constant while the image rotates, just like the rotational and complex moments do. Assume that, up to a certain order m, one knows the moments Znm of f(p, в). It is possible to construct a discretized original image function f(p ,Q ) whose moments are those of f(p ,Q ) up to a specified order. Numerous applications can benefit from the rotational invariance and scale and translational invariance of the Zernike moments. Even when there are comparatively few data points, the Zernike moments serve as reliable descriptors. Zernike moments are superior to other types of moments in terms of visual description because of their three characteristics. Zernike moments have certain drawbacks despite their characteristics. One of these is that calculating them becomes more expensive as their order increases, however, this may be fixed with the help of the suggested technique. The tested MxM size image is split into LxL sub-blocks that overlap. From every block, the Zernike moment Vy of degree n is derived. Following the computation of the Zernike moments, the Euclidean distance will be used to compare each pair of moments, j^(Z^) Nonetheless, blocks that are close to one another could have Zernike moment characteristics. The precise distance between each block is determined as, 7( i - )22 + 0' - 02< D2 Where, Zp = Vy and Zp+1 = Vti. It is determined if the testing blocks are copy-move areas using eqns. (12) and (13). Filtering is then used to lessen the number of incorrect matches. Erroneous fraud detection happens when surrounding pixels have the same brightness. Thus, to address this problem, eight nearby matching blocks are used. A block is considered matched if eight of its neighbouring blocks match; if not, it can be ignored. Finally, both SIFT extraction and Zernike moments are combined to identify the manipulated images from the given input data. The outcome reached through performing the simulation on the proposed model is given in the next section. Pseudocode for proposed manipulate or fabricate image prediction Image dataset = I Begin { For images in the dataset # Pre-processing R= Resizing (I) // change dimension of data G = Gray conversion (R) // covert RGB O = Optimal Gaussian filter (G) // remove noise from the image A = Adaptive bilateral filter (O) // improve pixel brightness # Feature extraction F = SIFT (A) // extract features based on key point B = Block with Zernike moment (A) // extract features based on zernike moment # Feature matching M = F + B // match both feature vectors } End Outcome: Detect fabricated or manipulate image 4. Result and Discussion A systematic algorithmic approach that can be seamlessly integrated into any digital platform to detect manipulated or fabricated images commonly employed for spreading false information. The images are pre-processed to make a clear visible manner which is further proceeded for local SIFT key point generation. It extracts the image based on Euclidean distance and image matching process. Using the block based process to split the images into blocks, then each blocks are diagonally split into sub-blocks using Zernike moments for accurate forgery image detection. The proposed model was implemented in MATLAB R2020b with NVIDIA GeForce RTX 3070 GPU, Intel Core i7 CPU, and 64GB RAM. The dataset which was utilized in the model is discussed below. 4.1 Dataset description The most often used dataset is MICC, it was divided into four subsets: MICC-F220, MICC-F8multi, MICC-F6000, and MICCF2000. There are 110 authentic and 110 fabricated photos in MICC-F220. Out of the 2000 photos in MICC-F2000, 700 are forged while the remaining 1300 are original. MICC-F8multi is made up of eight photos that have been realistically multiple cloned. Out of the 400 images in MICC-F6000, 160 are fake and the remaining 160 are authentic. MICC-F220 is the dataset that is most frequently utilized for study validation out of all four of them. The square or rectangle of the image is randomly selected to create the fake MICC-F220 and MICC-F2000 images [24]. Using this dataset to analyse the proposed model performance. Table 1 demonstrates the parameters with ranges utilized for designing the proposed model. Table 1. Proposed model parameter with its ranges. Parameter Methods Ranges Sigma (o') Gaussian filter 0.5 Filter size 3x3 Peak_thresh SIFT 0.04 Edge_thresh 10 Octaves 4 Levels 2 order of the moment Zernike moments 4 repetition of the moment 2 Particular sequence Block matching 7 MB size 16 Table 1 shows the proposed model was designed as 0.04 peak threshold, 10 edge threshold, 4 octaves, the order and repetition of moments are considered as 4 ad 2, and the mb size of block matching is taken as 16. The original, tampered, block-based division, key-point based, combined feature extracted, and detected forgery are the six sub-images that make up Figures 3, 4, 5 and 6. The original and altered photos are nearly identical, however, the system can identify areas where an image has been manipulated when it runs the forged image through the recommended method. Table 2 shows the Outcome of block-based and keypoint-based approaches Table 2. Outcome of block-based and keypoint-based approaches. Resized image Tampered image Block-based Keypoint based The gathered images are initially analysed through a block block-based model to split the images into separate blocks. After the block-based image division, the key point of the image was analysed which was computed by using Euclidean distance. Then, fuse the features to detect the manipulated image at the input image. Table 3 demonstrates the images of key point based images, combined feature extraction and final manipulated image. Table 3. Outcome of extraction image and manipulate image 4.1.1 Performance analysis for noise removal In the upcoming part, the pre-processing metrics are compared to some other traditional models like the Median filter, savitzky golay filter (SG filter), and contrast stretching. Correlation coefficient (CC), peak signal-to-noise ratio (PSNR), Structural Similarity Index (SSIM), signal-to-noise ratio (SNR) and Normalized correlation (NC) are the metrics used for comparison. Each metrics are individually analysed and the values are observed to analyse the pre-processing approach performance. Fig. 3. PSNR comparison Fig. 4. SNR comparison A comparison of the PSNR of the proposed Optimal Gaussian filter (OG filter) model provides for testing the methodology shown in Figure 3. The PSNR is the ratio of a signal's highest practicable value to the highest possible amount of distorted noise that compromises the accuracy of its representation. The proposed OG filter model provides 59 PSNR, the median filter has 51 PSNR, the SG filter has 49 PSNR and the contrast stretching model has 43 PSNR. Thus, demonstrates the proposed model provides a higher PSNR value than the traditional approaches. Then, the signal-to-noise ratio is analysed and its comparison is shown in Figure 4. The SNR will rise with a larger field of vision because a larger pixel size results in more signals being received by each individual pixel. Large pixels will pick up more signals and result in images with high SNR. The proposed OG filter model provides 52 SNR, the median filter has 46 SNR, the SG filter has 42 SNR and the contrast stretching model has 37 SNR. It demonstrates the proposed model provides a better SNR value than another model. Fig. 5. Correlation coefficient Fig. 6. SSIM comparison Fig. 7. NC Comparison Figure 5 illustrates the CC process, which involves moving a filter mask often referred to as a kernel over the image and computing the total of the products at each location. In the proposed model OG filter pre-processing technique provides 0.9 CC, the median filter has 0.86 CC, the SG filter has 85 CC and the contrast stretching model have 0.80 CC. It verifies the proposed model offers better CC values than another model. Figure 6 illustrates how the SSIM index is calculated for each image in relation to the reference image in order to enhance contrast and image quality. In the proposed model OG filter pre-processing technique provides 0.89 SSIM, the median filter has 0.85 SSIM, the SG filter has 0.84 SSIM and the contrast stretching model have 0.82 SSIM. It provides the proposed model offer better SSIM value than the conventional models. Figure 7 compares the NC for the proposed and existing techniques. The proposed technique OG filter took 0.98 for training but existing techniques such as median filter, SG and contrast stretching took 0.9, 0.85% and 0.82%. It provides the proposed model offer better SSIM value than traditional models. 4.1.2 Performance analysis for contrast enhancement In this sub-part the proposed adaptive histogram equalization performance is compared to some other techniques like wiener filter, and gamma correction. Each metrics are individually analysed and the observed values are shown below. Fig. 8. BRISQUE comparison Figure 8 compares BRISQUE with the suggested and existing methods. The suggested method has a value of 83 BRISQUE, which is higher than that of existing procedures such as the wiener filter, which has 76 BRISQUE, and gamma correction, which has 75 BRISQUE. Figure 9 compares R2 values; it indicates that the suggested solution has an R2 value of 0.87, whereas other existing options, including gamma correction and the wiener filter, have values of 0.86 and 0.8. It provides the proposed model offers a better solution than traditional models. Fig. 9. R2 comparison Fig. 10. MSE comparison A comparison of mean square error (MSE) between recommended and existing approaches is presented in Figure 10. The suggested model's MSE score is 0.05. However, the present approach wiener filter, and gamma correction have respective scores of 2.1 MSE and 4 MSE. It demonstrates the outcome of the proposed techniques has less MSE value than the conventional models. Figure 11 clearly shows the performance of the iteration vs fitness graph. The convergence of optimal parameter selection will increase the quality of the images. Figure 11 shows the error was having in 100 at the 1st iteration, and the error reached 1 at the 70th iteration, which is the lowest value among the population set. Fig. 11. Convergence curve of the proposed model Further, the performance of the proposed model performance metrics are compared to some other models like Hilbert–Huang Transform (HHT), ManTra-Net (MTNet), and Biorthogonal Wavelet Transform (BWT). The performance taken for validation is precision, recall and F1_score. Fig. 12. Precision comparison A comparison of the intended and existing models’ precision is exposed in Figure 12. The quantity of anticipated favourable events is meant by accurate measurement. Compared to other current approaches, such as HHT, MTNet, and BWT, with corresponding precision values of 97%, 95.5%, and 94.3%, the suggested method's precision value was discovered to be 98.2%. It provides the proposed model with offers higher precision value than traditional models. Fig. 13. Recall comparison As demonstrated in Figure 13, recall is computed by dividing the total number of components that correctly fall into the positive category by the total number of true positives. Compared to other existing approaches, such as HHT, MTNet, and BWT, with corresponding recall values of 98.5%, 96.4%, and 93.7%, the proposed method's recall value was discovered to be 100%. Thus the proposed model provides an effective recall value than traditional models. Fig. 14. F1_score comparison After that, the F1_Scores of the suggested and used methods are examined. A statistical study of the F1_ score reveals the binary types of the system and the accuracy level of the data set. A comparison of the expected and actual F1 scores is shown in Figure 14. The F1 Score value for the proposed technique is 99.09%, HHT is 97.76%, MTNet is 95.91%, and BWT is 93.64%. It demonstrates that the suggested model yields superior results to alternative methods. Figure 15 compares the execution times for the proposed and current times. The suggested model takes 280 seconds to execute, which is longer than current models namely HHT, MTNet, and BWT execution times are 600, 690, and 850 seconds, respectively. It is clear from the complete study findings that the suggested model performed better than the earlier method. Fig. 15. Execution time comparison 4.2 Comparative analysis Fig. 16. Precision at various pixel ranges Precision values at various pixel ranges are analysed and provided in Figure 16. The 20*20 pixel range has 29% precision, the 30*30 pixel range has 54% precision, the 40*40 pixel range have 95% precision, the 50*50 pixel range has 96% precision, and the 60*60 pixel range have 99% precision. It shows the large range of pixels have a higher range of precision value. Fig. 17. True negative rate at various block sizes Figure 17 demonstrates the True negative rate (TNR) at various block sizes, in that the size of the block increases the TNR also increases simultaneously. Also, it proves the proposed model offers a better TNR value than the traditional models. The analytical metrics utilized to evaluate the performance of the suggested system with that of traditional approaches include recall, precision, and F1 score. The performance is compared to some of the existing state-of-the-art models like SIFT, JLinkage, Speeded Up Robust Features (SURF), Zernike, Affine transformations [25] and DCT-LBP [26]. Table 4. Performance comparisons of the proposed model. Method Precision Recall F1-Score SIFT 74.19 47.92 58.23 JLinkage 78.95 62.50 69.77 SURF 72.41 43.75 54.55 Zernike 88.37 79.17 83.52 Affine transformations 81.82 93.75 87.38 DCT-LBP 87.23 89.08 85.63 Hybrid System (SIFT + Proposed Zernike Moments) 98.20 100.00 99.09 Table 4 demonstrates the precision value of the proposed model is 98.2%, but SIFT have 74.19%, Jlinkage has 78.95%, SURF has 72.41%, Zernike has 88.37%, and affine transformations have 81.82%. Thus the proposed model provides a better outcome than the state-of-the-art models.
5. Conclusion A novel SIFT extraction and block based Zernike moment fusion was developed to detect the fabricated or manipulated images. Image forging is one of these techniques for altering images; it entails copying and pasting a patch or small portion of an image to different places inside the same image. The copied region in this operation is a part of the same image. Therefore, some of the basic characteristics of the original and forged image, such as dynamic range, colour components, noise conditions, and illumination performance, essentially stay the same. In the proposed work, a combined feature configuration of SIFT extraction and block based Zernike moment was developed to find the forgery part of the image. The information quality of the proposed model was improved through novel pre-processing approaches like grayscale conversion, optimal Gaussian filter, and adaptive histogram equalization. The pre-images were given to the extraction process using the local SIFT extraction process. In this extraction, the key points are captured from the Euclidean distance. The DOG pyramid is implemented by periodically convolving the input image with a Gaussian kernel. An extensive fit to the neighbouring data is used to identify the right scale, location, and ratio of principal curvatures once a crucial point candidate has been identified by comparing a pixel to its neighbours. The grayscale images are divided into blocks and each blocks are diagonally split into blocks using Zernike moments. Identical to the rotational and complex moments, its magnitude remains unchanged as the image rotates to measure the feature vector of each sub-blocks. Both SIFT and Zernike moments feature vectors are matched to identify the forgery image effectively. The proposed SIFT and Zernike moments model provide 100% recall, 98.2% precision, and a 99.09% F1 score. Cybersecurity cases and complicated digital concerns can be effectively addressed by using this proposed method. Exposed to a variety of attacks, including rotation, JPEG compression, scaling, blurring, and brightness manipulation. There are many false matches with a regular background. Aside from the aforementioned constraints, one important issue with these detection techniques is their limited field of application. For example, a system created for copy-move forgery will not work with image splicing or resampling, and vice versa. Despite ongoing research in the topic of image forgery detection, no one detection approach can be used to detect all types of forgeries. As a result, there is a strong need to build a robust, comprehensive counterfeit detection approach that can overcome the aforementioned restrictions. Furthermore, researchers may apply these techniques to detect forgeries in video. The digital image serves as vital evidence in industries such as forensic inquiry, intelligence systems, criminal investigation, insurance claims, medical imaging, and journalism to prove something. Images are reliable sources of information on the internet and social media. However, by utilizing readily available software or editing programs such as Corel Paint Shop, Photoshop, PhotoScape, Pixelmator, PhotoPlus, GIMP, and others, images can be manipulated or used maliciously for personal advantage. So, the proposed image forgery detection model can support these various image authentic applications. Moreover, the distance between features in the original and forgery image is calculated based on the weighted distance metric. In future. Similarity between the images can be calculated using some kind of net model such as a Siamese network. It can effectively calculate the distance between the features in the original and the tampered image. Funding The authors declare that no funds, grants, or other support were received during the preparation of this manuscript. Conflict of Interest The authors declared that they have no conflicts of interest to this work. We declare that we do not have any commercial or associative interest that represents a conflict of interest in connection with the work submitted. Author Contributions The corresponding author claims the major contribution of the paper including formulation, analysis and editing. The co-author provides guidance to verify the analysis result and manuscript editing. Compliance with Ethical Standards This article is a completely original work of its authors; it has not been published before and will not be sent to other publications until the journal’s editorial board decides not to accept it for publication.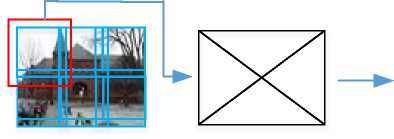
References SIFT-BZM: Pixel Based Forgery Image Detection Using Scale-Invariant Feature Transform and Block Based Zernike Moments
- T.J. Billard, and R.E. Moran, Designing Trust: Design Style, Political Ideology, and Trust in “Fake” News Websites. Digital Journalism, vol. 11, no. 3, pp. 519-546, 2023.
- G. Ruffo, A. Semeraro, A. Giachanou, and P. Rosso, Studying fake news spreading, polarisation dynamics, and manipulation by bots: A tale of networks and language. Computer science review, vol. 47, pp. 100531, 2023.
- T.S. Beck, Image manipulation in scholarly publications: are there ways to an automated solution?. Journal of Documentation, vol. 78, no. 5, pp. 1184-1198, 2022.
- H.M. Elgohary, S.M. Darwish, and S.M. Elkaffas, Improving Uncertainty in Chain of Custody for Image Forensics Investigation Applications. IEEE Access, vol. 10, pp. 14669-14679, 2022.
- S. Bharathiraja, B. Rajesh Kanna, S. Geetha, and G. Anusooya, Unmasking the digital deception-a comprehensive survey on image forgery and detection techniques. Australian Journal of Forensic Sciences, pp. 1-49, 2023.
- P. Gajjar, A. Saxena, H. Shah, N. Kikani, K. Lakhani, P. Shah,... and K. Limbachiya, Copy Move Forgery Detection: The Current Implications and Contemporary Practices. In Journal of Physics: Conference Series (Vol. 2325, No. 1, p. 012050). IOP Publishing, 2022.
- S. Kumar, S. Mukherjee, and A.K. Pal, An improved reduced feature-based copy-move forgery detection technique. Multimedia Tools and Applications, vol. 82, no. 1, pp. 1431-1456, 2023.
- J.S. Sujin, and S. Sophia, Copy-Move Geometric Tampering Estimation Through Enhanced SIFT Detector Method. Computer Systems Science & Engineering, vol. 44, no. 1, 2023.
- M. Shahrokhi, A. Akoushideh, and A. Shahbahrami, Image Copy–Move Forgery Detection Using Combination of Scale-Invariant Feature Transform and Local Binary Pattern Features. International Journal of Image and Graphics, vol. 22, no. 05, pp. 2250048, 2022.
- A. Dixit, and R. Dixit, Forgery detection in medical images with distinguished recognition of original and tampered regions using density-based clustering technique. Applied Soft Computing, vol. 130, pp. 109652, 2022.
- F.I. Rahma, E. Utami, and H. Al-Fatta, Gaussian Pyramid Decomposition in Copy-Move Image Forgery Detection with SIFT and Zernike Moment Algorithms. Telematika, vol. 15, no. 1, pp. 1-13, 2022.
- A. Diwan, D. Kumar, R. Mahadeva, H.C.S. Perera, and J. Alawatugoda, Unveiling Copy-Move Forgeries: Enhancing Detection with SuperPoint Keypoint Architecture. IEEE Access, 2023.
- Y. Rao, J. Ni, and H. Xie, Multi-semantic CRF-based attention model for image forgery detection and localization. Signal Processing, vol. 183, pp. 108051, 2021.
- Song, C., Zeng, P., Wang, Z., Li, T., Qiao, L., and Shen, L. Image forgery detection based on motion blur estimated using convolutional neural network. IEEE Sensors Journal, 19, no. 23, pp. 11601-11611, 2019.
- S. Dua, J. Singh, and H. Parthasarathy, Image forgery detection based on statistical features of block DCT coefficients. Procedia Computer Science, vol. 171, pp. 369-378, 2020.
- H. Wu, J. Zhou, J. Tian, J. Liu, and Y. Qiao, Robust image forgery detection against transmission over online social networks. IEEE Transactions on Information Forensics and Security, vol. 17, pp. 443-456, 2022.
- H. Kasban, and S. Nassar, An efficient approach for forgery detection in digital images using Hilbert–Huang transform. Applied Soft Computing, vol. 97, pp. 106728, 2020.
- Y. Wu, W. AbdAlmageed, and P. Natarajan, Mantra-net: Manipulation tracing network for detection and localization of image forgeries with anomalous features. In Proceedings of the IEEE/CVF Conference on Computer Vision and Pattern Recognition (pp. 9543-9552), 2019.
- N.K. Rathore, N.K. Jain, P.K. Shukla, U. Rawat, and R. Dubey, Image forgery detection using singular value decomposition with some attacks. National Academy Science Letters, vol. 44, pp. 331-338, 2021.
- S. Bibi, A. Abbasi, I.U. Haq, S.W. Baik, and A. Ullah, Digital image forgery detection using deep autoencoder and CNN features. Hum. Cent. Comput. Inf. Sci, vol. 11, pp. 1-17, 2021.
- S. Walia, K. Kumar, M. Kumar, and X.Z. Gao, Fusion of handcrafted and deep features for forgery detection in digital images. IEEE Access, vol. 9, pp. 99742-99755, 2021.
- E.A.A. Vega, E.G. Fernández, A.L.S. Orozco, and L.J.G. Villalba, Passive image forgery detection based on the demosaicing algorithm and JPEG compression. IEEE Access, vol. 8, pp. 11815-11823, 2020.
- A.A. Heidari, S. Mirjalili, H. Faris, I. Aljarah, M. Mafarja, and H. Chen, Harris hawks optimization: Algorithm and applications. Future generation computer systems, vol. 97, pp. 849-872, 2019.
- Dataset 1: https://www.kaggle.com/datasets/mashraffarouk/micc-f220
- C. Lin, W. Lu, X. Huang, K. Liu, W. Sun, H. Lin, and Z. Tan, Copy-move forgery detection using combined features and transitive matching. Multimedia Tools and Applications, vol. 78, pp. 30081-30096, 2019.
- Islam, M. M., Karmakar, G., Kamruzzaman, J., & Murshed, M. (2020). A robust forgery detection method for copy–move and splicing attacks in images. Electronics, 9(9), 1500.
