Significance of source information for text dependent speaker verification

Author: Archita Hore, S. R. Nirmala, Rohan K. Das, Sarfaraz Jelil, S. R. M. Prasanna
Journal: International Journal of Image, Graphics and Signal Processing @ijigsp
Article in issue: 6 vol.10, 2018.
Free access
This work focuses on text dependent speaker verification system where a source feature specifically residual Mel frequency cepstral coefficients (RMFCC), has been extracted in addition to a vocal tract system feature namely Mel frequency cepstral coefficients (MFCC). The RMFCC features are derived from the LP residuals whereas MFCC features are derived from the cepstral analysis of the speech signal. Thus, these two features have different information about the speaker. A four cohort speaker’s set has been prepared using these two features and dynamic time warping (DTW) is used as the classifier. Performance comparison of the text dependent speaker verification model using MFCC and RMFCC features are enumerated. Experimental results shows that, using RMFCC feature alone do not give satisfactory results in comparison to MFCC. Also, the system’s performance obtained using the MFCC features, is not optimum. So, to improve the performance of the system, these two features are combined together using different combination algorithms. The proposed lowest ranking method yields good performance with an equal error rate (EER) of 7.50%. To further improve the efficiency of the system, the proposed method is combined along with the strength voting and weighted ranking method in the hierarchical combination method to obtain an EER of 3.75%.
Mel frequency cepstral coefficients (MFCC), residual Mel frequency cepstral coefficients (RMFCC), dynamic time warping (DTW), Source features
Short address: https://sciup.org/15015971
IDR: 15015971 | DOI: 10.5815/ijigsp.2018.06.05
Text of the scientific article Significance of source information for text dependent speaker verification
Published Online June 2018 in MECS DOI: 10.5815/ijigsp.2018.06.05
A speaker verification (SV) system is one that decides whether to accept or reject the identity claim of a speaker based on his/her voice [1]. This system does a “one-to-one” matching between the target’s voice samples and the speech of the person whose identity is being claimed, as shown in Fig. 1. Its application is found in phone banking, password resetting, accessing customer care services, credit card activation, transactions, phone top-up etc.
During enrollment voice models are generated and stored for later verification. The SV systems can be classified into two types, based on the text to be spoken. One of them is the text dependent (TD) and the other is the text independent (TI). In TD-SV system, the reference and the testing phrase are same. In this case, speakers speak the same text during the training and testing period [2], [3], [4], [5]. On the other hand, in TI-SV system there is no such bound [6].
Different methodologies have been adopted for TD-SV systems, as can be seen from the literature. Several features like MFCC [1], [5], [7], [21], [22] pitch [8], linear prediction coefficients (LPC) [9], perpetual linear prediction coefficients (PLP) [9], [10] etc. are extracted from the speech signal. Various pattern matching and modeling approaches used in this systems are DTW [8], [11], deep neural networks (DNN) [10], [12], Gaussian mixture model (GMM) [13], hidden Markov model (HMM) [5], [20] etc. From the literature survey, it has been observed that combining the features [14], [15], [16] or classifiers [15] together can improve the performance of the system. Also it is observed that, most of the present day systems use mostly the vocal tract system based features which lacks the information present in the excitation source. So, motivated by this, a source based feature i.e. RMFCC [17], [18] is explored in addition to the MFCC features. Apart from this, the two features are combined using different combination algorithms and DTW is used as the classifier.
The rest of the paper is systematized in the following way. Section II describes the development of the baseline system. Section III discusses the various combination algorithms to combine these two features. The experimental results are tabulated and discussed in Section IV. Finally, Section V concludes the paper.
-
II. Baseline System Development
The various steps adopted to build up the baseline system using MFCC and RMFCC features is shown in Fig. 2.
-
A. Speech Signals
A 40 speaker database is taken from Indian Institute of Technology Guwahati, which consists of 31 male speakers and 9 female speakers. There are three different sentences used for this task. These are “Don’t ask me to walk like that”, “Get into the hole of tunnel” and “Lovely pictures can only be drawn”. Each of these three prompts was repeated four times, out of which, three of them are taken for the training session and one for the testing purpose. The duration taken for uttering these prompts is this database, where the first 40 of this list are for genuine around 3-5 seconds. A claim list has been prepared from this database, where the first 40 of this list are for genuine speakers and the next 80 of them are enlisted for imposters. Thus, there are 120 speakers in the claim list.
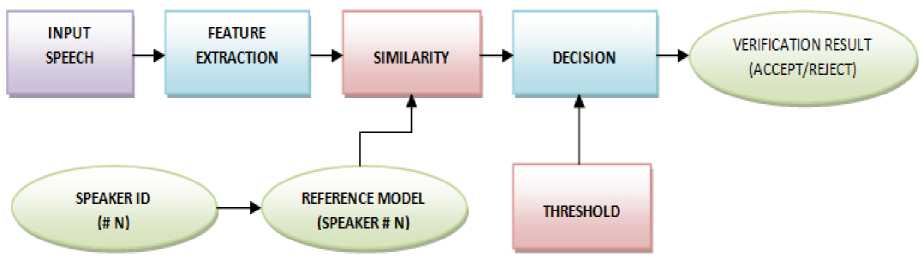
Fig.1. Block diagram of SV system
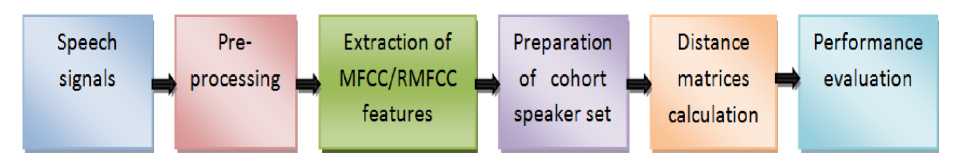
Fig.2. Block diagram of the baseline system to build up the TD-SV Model
-
B. Pre-processing
In this stage, the speech signal is processed with Hamming window function. Then framing is done such that if the frame energy is greater than 6% of the average energy, then that particular frame is retained, otherwise it is discarded. After which, using endpoint detection algorithm, the start and end points are detected.
-
C. Feature extraction
Two features are extracted from the speech signals. One is the MFCC and the other is the RMFCC features.
-
• Mel frequency cepstral coefficients (MFCC):
The MFCCs are the coefficients that collectively make up a Mel frequency cepstrum (MFC) [1]. They are derived from a type of cepstral representation of the audio clip. The shape of the vocal tract system manifests itself in the envelope of the short time power spectrum and the objective of MFCCs is to accurately represent this envelope [19]. The powers of the spectrum, is mapped onto the Mel scale, using the formula
m = 2595 log(1 + f/ygg) (1)
where m is the Mel scale frequency and f represents the frequency of the cepstrum. The difference between the cepstrum and MFC is that in MFC, the frequency bands are equally spaced on the Mel scale, which approximates the human auditory system’s response more closely than the linearly spaced frequency bands used in the normal cepstrum.
-
• Residual Mel frequency cepstral coefficients (RMFCC):
Significant speaker information is present in the subband energies of the linear prediction contains the excitation source based information and is computed from the speech signal s(n) by inverse filtering, given in the time domain as
e(n) = s (n) + ^=1 ak-s(n - k) (2)
where a k represents the LP coefficients and p is the order of the filter. The subband energies extracted using the Mel filter bank followed by cepstral analysis provides a compact representation. The resulting cepstral values are termed as RMFCCs [17].
(a)
(b)
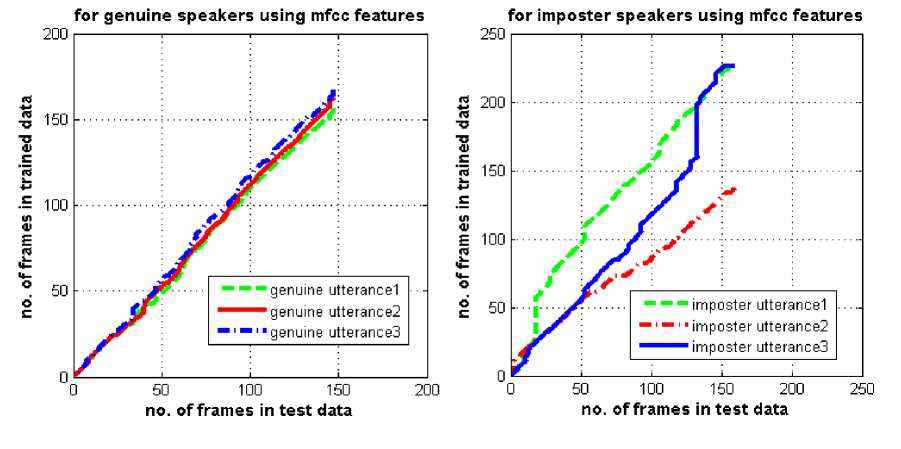
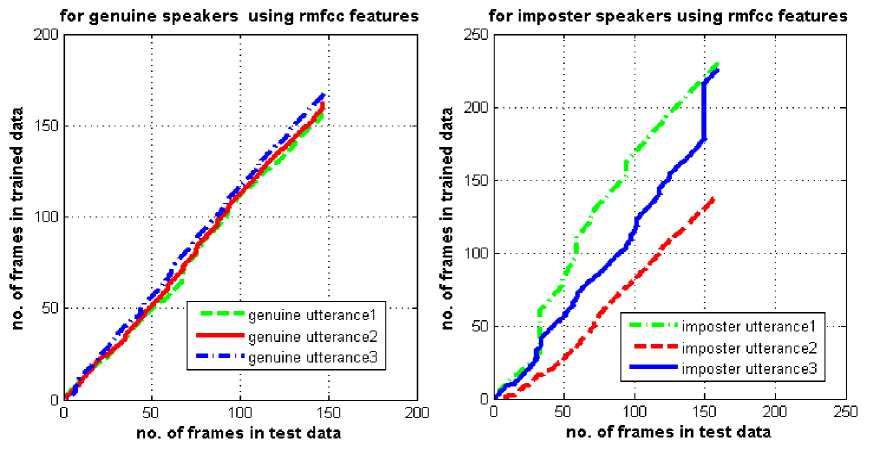
Fig.3. Behavior of the warping paths for genuine and imposters using (a) MFCC features (b) RMFCC features.
-
D. Cohort set preparation
A cohort speaker’s set is one where different speakers utter the same prompt [3]. Here a four cohort speaker’s set is considered.
-
E. Distance matrices calculation
In this case, DTW algorithm is used for finding the Euclidean distance between trained and the test speaker model.
-
F. Performance evaluation
Performance of the TD-SV model using MFCC and RMFCC features is measured in terms of EER. The point where false acceptance rate (FAR) and false rejection rate (FRR) intersect each other is the EER [7].
Based on the claim list, DTW scores are obtained by four cohort speaker method using MFCC and RMFCC features. There are three reference templates for each speaker model, to which the test speech is tested to generate three distance scores. As four cohort speaker’s set is considered, so number of distance scores will be 4×3 = 12. So, for one speaker, total number of distance scores will be 3+12 = 15, using four cohort speaker’s set. Here the 1st three scores represent the distances of the test model from the corresponding train models of a particular speaker and the remaining 12 values represents the distance scores of the four cohort speakers. Since, 120 speakers (1st 40 for genuine and remaining 80 for imposters) are considered in the claim list, so total number of calculated distance scores will be 120×15. From the DTW scores, it was observed that the 1st three distance values, in a row are less than the remaining 12 values, for genuine speakers whereas it is not the case for the imposters.
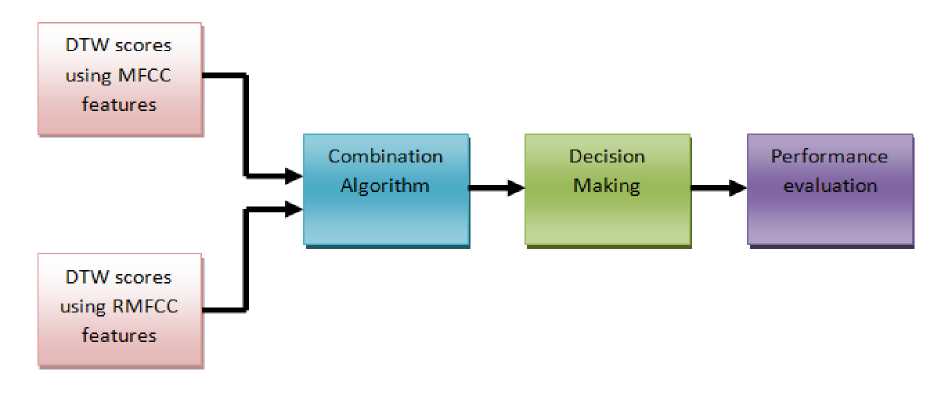
Fig.4. Block diagram of the methodology used for TD-SV system using combination algorithms
The nature of the DTW path shows the mismatch between the relative duration of units in the trained and test utterances. This path is represented by a sequence of points, where the test utterance is represented in the x-axis and that of trained utterances in the y-axis.
From Fig. 3, it has been observed that the warping path obtained by the DTW algorithm using the MFCC or RMFCC features, follows closely to the line of regression for genuine speakers whereas it deviates significantly in case of imposters.
Table 1. Performance of the baseline system using MFCC and RMFCC features.
|
Method used |
EER (%) |
|
MFCC |
17.50 |
|
RMFCC |
31.25 |
Performance of the TD-SV system using MFCC and RMFCC features is tabulated in Table 1.Experimental result shows that, performance obtained using MFCC features is better than the RMFCC one. Since MFCC features contain the information about the whole signal because it is a vocal tract system based feature whereas RMFCC, an excitation source based feature, contains the information of only the LP residuals, obtained from speech signals. But results are not optimum. Also, many genuine speakers are rejected using RMFCC features and many imposters are falsely accepted using MFCC features. So, in order to improve the performance of the system, these two features are combined together using different combination algorithms, as discussed in the next section.
-
III. Combining The Mfcc And Rmfcc Features Using Different Combination Algorithms
To improve the TD-SV performance, these two features are combined together, as shown in Fig. 4. The DTW scores obtained by the two systems using the MFCC and RMFCC features are combined using different algorithms such as weighted method, linear combination of frame ratio, hierarchical combination method etc. The decision is taken based on a threshold value and then performance is evaluated in terms of EER.
The scheme for combining the evidences obtained using the MFCC and RMFCC features can be broadly grouped into three categories, namely, abstract level combination (ALC), rank level combination (RLC) and measurement level combination (MLC) [15]. In the ALC technique, each system outputs the most likely speaker of the test data. It is therefore done at the decision level of each system, to identify the speaker of the test data. In the RLC method, each system produces a rank list of speakers, based on the frame scores of the test data. Then combination is done at the rank level to identify the speaker. In the MLC technique, the frame scores obtained are considered as the measurement level information of the test data. The various algorithms used for combining these two features are discussed below.
-
A. Weighted method (WM)
It is an MLC method. In this method, the normalized DTW scores obtained by the two systems using the MFCC ( Sm ) and RMFCC ( Sr ) features are combined together [14], by the formula
S = aSr + (1 - a)Sm (3)
where a is the weighting factor and is varied from 0 to 1. At an optimum value of a , minimum EER is obtained.
-
B. Linear combination of frame ratio (LCFR)
1
2
3
4
5
3
0.4344
0.4444
0.5073
0.5278
0.6299
4
0.4283
0.4663
05042
05319
0.6209
5
0.3407
0.4499
0.5351
0.5725
0.6294
6
0.4961
0.5005
0.5135
0.5191
0.5499
7
0.5276
0.4440
0.4633
0.4916
0.6124
1
2
3
4
5
41
0.5084
0.5041
0.5142
0.5205
0.5341
42
0.4837
0.4548
0.5130
0.5474
0.5708
43
0.4241
0.4151
0.4814
0.5173
0.6794
44
0.5015
0.4642
0.5064
0.5185
0.5789
45
0.4782
0.4802
0.5199
0.5344
0.5623
It is an MLC method, where the output of the individual system is available as measurement values for combining and making the decision [15]. In this method, the frame scores are generated linearly for all the speakers based on the DTW scores using the formula
Z(j) = G(j) + H(j) (4)
where j represents the speaker number. G and H are the normalized DTW scores obtained using MFCC and
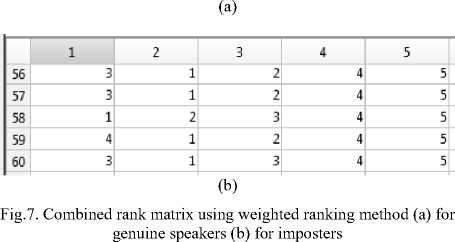
RMFCC features respectively. After combining the scores using equation (4), the 15 DTW scores in a row, are grouped into 5 values by taking the mean of the three consecutive values, as shown in Fig. 5. The 1st value along all the rows is for the target speaker and the remaining four values are for the other four cohort speakers. From Fig. 5(a), if the 1st value is less than the remaining values along all the rows then that genuine speaker is accepted otherwise rejected by the system. And from Fig. 5(b), for imposters, if the 1st value is less than the other values in a row then that imposter is accepted and others are rejected by the system.
(a)
(b)
Fig.5. Combined score matrix using LCFR method (a) for genuine speakers (b) for imposters
-
C. Weighted linear combination of frame ratio (WLCFR)
1
2
3
4
5
4
0.2119
0.2327
0.2520
0.2665
0.3119
5
0.1683
0.2240
0.2686
0.2869
0.3150
6
0.2473
0.2503
0.2569
0.2597
0.2754
7
0.2629
0.2222
0.2319
0.2454
0.3069
8
0.2531
0.1804
0.2290
0.2596
0.3222
1
2
3
4
5
42
0.2412
0.2255
0.2566
0.2746
0.2866
43
0.2097
0.2065
0.2403
0.2587
0.3420
44
0.2497
0.2316
0.2530
0.2593
0.2908
45
0.2380
0.2396
0.2605
0.2678
0.2814
46
0.2707
0.1966
0.2523
0.2639
0.2894
It is an MLC combination method. It is almost the same as that of the LCFR method, only that a weighting factor is used in this case [15]. The weighting factor is given by the ratio of the performance obtained by using each system to the total performance obtained by the systems. The normalized DTW scores, obtained using the MFCC and RMFCC features are combined together, by the formula
K(j) = WmG(D + WTH(j) (5)
where Wm = P1/(P1 +P2) and Wr = P2/(P1 +P2) are the weighting factors obtained by using the performance of MFCC (P1) and RMFCC (P2) features respectively. After obtaining the combined matrix K , shown in Fig. 6, decision is taken in the same way as in LCFR method.
(a)
(b)
Fig.6. Combined score matrix using WLCFR method (a) for genuine speakers (b) for imposters
-
D. Weighted ranking method (WR)
It is an RLC method, where the output of each system is given in terms of rank [15]. In this method, after normalizing and grouping the 15 DTW scores as in LCFR method, ranks are assigned from 1 to 5, using both MFCC and RMFCC features. The lowest DTW score is assigned a rank “1” and consecutively a rank higher. Then the ranks obtained by both these two features are combined by the formula
VMMM+WOW (6)
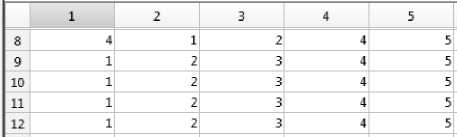
where x represents the speaker number. R x1 and R x2 are the ranks of the speaker using MFCC and RMFCC features respectively. A part of the combined rank matrix (Rx) is shown in Fig. 7. From Fig. 7(a), if the 1st rank is less than the remaining ranks along all the rows then that genuine speaker is accepted otherwise rejected by the system. And from Fig. 7(b), for imposters, if the 1st rank is less than the other ranks in a row then that imposter is accepted and others are rejected by the system.
-
E. Strength voting method (SS)
It is an MLC method. At first, the DTW scores obtained by the MFCC and RMFCC features are normalized. The score grouping is same as that of LCFR. Then the genuine speakers supported by both the systems are identified [15]. Finally, WLCFR method is applied to only those speakers supported by the system.
-
F. Supporting system method (SS)
It is an ALC method, where decision is taken at the output of each system [15]. In this method, voting power is given to all the system based on its performance. The speakers identified by both the TD-SV systems using MFCC and RMFCC features, get the highest number of votes. The other speakers identified by any of the system, are given a vote less.
-
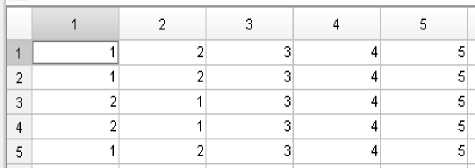
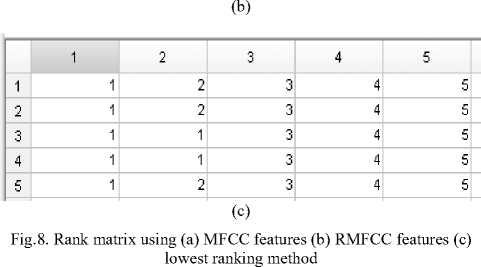
G. Lowest ranking method (Proposed)
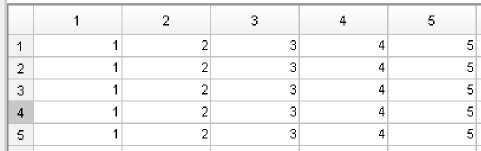
It is an RLC technique. In this method, ranks are assigned in the same way as in WR method using both MFCC and RMFCC features, as shown in Fig. 8(a) and 8(b). The speaker with the lowest score gets a rank “1” and consecutively a rank higher for the other speakers. A new rank matrix is formed by taking the lower rank between the MFCC and RMFCC rank matrices, as shown in Fig. 8(c). Then decision is taken in the same way as in WR method. To further improve the performance of the system, some of the above methods are combined in an order called the hierarchical combination method [15].
(a)
-
H. Hierarchical combination method (HC)
In this method, the DTW scores obtained by using these two features are normalized. First of all, the rejected number of genuine speakers and falsely accepted imposters are obtained using MFCC and RMFCC features individually. There are 6 rejected genuine speakers and 16 number of falsely accepted imposter using MFCC features. Using RMFCC, 23 rejected genuine speakers and 4 falsely accepted imposters, were obtained. Then votes are given to the speakers based on the performance of the TD-SV system using MFCC and RMFCC features. The speaker who gets the maximum number of votes is identified by the SVT system.
After combining the MFCC and RMFCC features using the SVT method, 6 of the genuine speakers are rejected by system and 2 of them are falsely accepted. Then using WR method to these speakers, the number of rejected genuine speakers was same as obtained by the SVT method i.e. 6 but no imposters were accepted. Finally, the proposed lowest ranking method is applied to the remaining rejected genuine speakers and it was reduced to 3.
-
IV. Results and Discussion
It was observed that several genuine speakers were rejected and many imposters were falsely accepted when MFCC and RMFCC features were used alone. So, in order to improve the performance of the system, these two features were combined together using different combination algorithms.
Using the weighted method, for an optimum value a of 0.05, a minimum EER of 15% was obtained. By the LCFR method, after DTW score grouping, it was found that the 1st score is less than the remaining four values for genuine speaker’s case whereas it is not the same for imposters. But if the 1st value is not found to be lower than the other four scores in a row for genuine speakers, then that genuine speaker was rejected by the system. And for imposters, if the 1st value was less than the remaining four values, then that particular imposter is accepted by the system. The number of rejected genuine speakers is found out to be 4 and that of falsely accepted imposter is 15. The EER obtained in this case is 14.37%. In WLCFR method, the scores are multiplied by weighting factor and linearly added in the same way as in LCFR. The performance obtained using WLCFR method is same as LCFR method. By applying the WR method, it is observed that the 1st column in all the rows got the lowest rank for genuine speakers whereas it is not the same for imposters. But wherever the rank in 1st column is not less than the remaining ranks along the rows then that genuine speaker is rejected. On the other hand, if the rank in the 1st column is less in case of imposter, then that particular imposter is accepted by the system. The number of rejected genuine speakers and falsely accepted imposter is found out to be 5 and 6 respectively. The EER in this case is found to be 10%. Using SS method, rejected genuine speakers are 3 and that of falsely accepted imposter is 9 and EER is 9.37%. The SVT method gives an EER of 8.75% with 6 and 2 numbers of rejected genuine speakers and falsely accepted imposter respectively. The proposed lowest ranking method is a simple combination technique where EER is found to be 7.50% with 3 rejected genuine speakers and 6 falsely accepted imposter. In the HC method, the SVT, WR and proposed lowest ranking method are applied one after another. After applying these three methods hierarchically, the number of rejected genuine speakers is found to be 3 and that of falsely accepted imposter is 0 and EER is found to be 3.75%.
The performance in terms of EER, obtained using the different combination algorithms discussed in the previous section is tabulated in Table 2.
Table 2. Performance obtained by TD-SV system using different combination algorithms
|
Method used |
EER (%) |
|
Weighted method |
15.00 |
|
LCFR |
14.37 |
|
WLCFR |
14.37 |
|
Weighted ranking |
10.00 |
|
Supporting system |
09.37 |
|
Strength voting |
08.75 |
|
Lowest ranking (proposed) |
07.50 |
|
Hierarchical method |
03.75 |
From Table 2, it is observed that the use of different combination algorithms yields good performance. The SS, SVT and lowest ranking methods gives an EER of less than 10%. Among all these techniques, the HC method gives the best results with minimum EER of 3.75%.
-
V. Conclusion
This paper presents the TD-SV system using the MFCC and RMFCC features from the speech signals. DTW is used as the classifier and a four cohort based method is used. A comparison is done for the performances obtained using these two features. MFCC is a vocal tract system based feature whereas RMFCC is a source information based feature, so experimental results shows that RMFCC alone do not give satisfactory results, in comparison to MFCC. Also, it is observed that, using any of these two features alone, there were many rejected genuine clients and falsely accepted imposter. So, these two features are combined using different combination algorithms. These combination schemes were grouped under three categories, namely ALC, RLC and MLC. The proposed lowest ranking method is a simple combination method and yields a good performance with an EER of less than 10%. Among all the combination algorithms, performance obtained by the HC method showed the best results with an EER of 3.75%. Some other source features like discrete cosine transform of the integrated linear prediction residual (DCTILPR) [18], Mel power difference of spectrum in the subband (MPDSS) [18] etc. and system based features like LPC, PLP etc. and also different classifiers like GMM, HMM etc., along with suitable combination techniques to combine the features or the classifiers, can be explored in the future work. Also, this work can be evaluated on a larger and a standard database.
References Significance of source information for text dependent speaker verification
- A. Larcher, K. A. Lee, B. Ma and H. Li, “Imposture classification for text-dependent speaker verification,” IEEE International Conference on Acoustics, Speech and Signal Processing (ICASSP), Florence, 2014, pp. 739-743.
- R. K. Das, S. Jelil and S. R. M. Prasanna, “Development of Multi- Level Speech based Person Authentication System,” Journal of Signal Processing Systems, 2016, 1-13.
- H. Khemiri and D. Petrovska-Delacretaz, “Cohort selection for textdependent speaker verification score normalization,” 2nd International Conference on Advanced Technologies for Signal and Image Processing (ATSIP), Monastir, 2016, pp. 689-692.
- A. Larcher, K. A. Lee, B. Ma and H. Li, “Text-dependent speaker verification: Classifiers, databases and RSR2015,” Journal of Speech Communication, vol. 60, pp. 56-77, May, 2014.
- A. K. Sarkar and Z. H. Tan, “Text Dependent Speaker Verification Using Un-supervised HMM-UBM and Temporal GMM-UBM,” INTERSPEECH 2016, San Francisco, USA, September 2016.
- A. Revathi, R.Ganapathy and Y.Venkataramani, “Text Independent Speaker Recognition and Speaker Independent Speech Recognition Using Iterative Clustering Approach,” International Journal of Computer Science and Information Technologies, Vol 1, No 2, November 2009.
- S. P. Choudhury, T. K. Das, P. Saha, R. Hussain and U. Baruah, “Comparative analysis of two different system’s framework for text dependent speaker verification,” International Conference on Circuit, Power and Computing Technologies (ICCPCT), Nagercoil, 2015, pp. 1-5.
- B. Yegnanarayana, S. R. M. Prasanna, J. M. Zachariah and C. S. Gupta, “Combining evidence from source, suprasegmental and spectral features for a fixed-text speaker verification system,” IEEE Transactions on Speech and Audio Processing, vol. 13, no. 4, pp. 575-582, July 2005.
- N. Dave, “Feature Extraction Methods LPC, PLP and MFCC in Speech Recognition,” International Journal For Advance Research In Engineering and Technology, Vol. 1, Issue VI, July 2013.
- E. Variani, X. Lei, E. McDermott, I. L. Moreno and J. Gonzalez- Dominguez, “Deep neural networks for small footprint text-dependent speaker verification,” IEEE International Conference on Acoustics, Speech and Signal Processing (ICASSP), Florence, 2014, pp. 4052-4056.
- T. K. Das, S. Misra, S. P. Choudhury, D. K. Sah, U. Baruah and R. H. Laskar, “Comparison of DTW score and warping path for text dependent speaker verification system,” International Conference on Circuit, Power and Computing Technologies (ICCPCT), Nagercoil, 2015, pp. 1-4.
- S. Dey, S. Madikeri, M. Ferras and P. Motlicek, “Deep neural network based posteriors for text-dependent speaker verification,” 2016 IEEE International Conference on Acoustics, Speech and Signal Processing (ICASSP), Shanghai, 2016, pp. 5050-5054.
- D. A. Reynolds, “Gaussian Mixture Models,” Encyclopedia of Biometric Recognition, Springer, Journal Article, February 2008.
- R. K. Das, Abhiram B., S R M Prasanna and A. G. Ramakrishnan, “Combining Source and System Information for Limited Data Speaker Verification,” INTERSPEECH 2014, Singapore, 2014, pp 1836-1840.
- H. S. Jayanna, “Limited data speaker recognition,” Ph.D. thesis, Indian Institute of Technology, Guwahati, India, 2009.
- D. Hosseinzadeh and S. Krishnan, “Combining Vocal Source and MFCC Features for Enhanced Speaker Recognition Performance Using GMMs,” IEEE 9th Workshop on Multimedia Signal Processing, Crete, 2007, pp. 365-368.
- D. Pati and S. R. M. Prasanna, “Speaker Information from Subband Energies of Linear Prediction Residual,” National Conference on Communications (NCC), Chennai, 2010, pp. 1-4.
- R. K. Das and S. R. M. Prasanna, “Exploring different attributes of source information for speaker verification with limited test data”, The Journal of the Acoustical Society of America, 2016, 140(1), pp. 184-190.
- B. B. Andersen, “The mel frequency scale and coefficients”, Available FTP: http://kom.aau.dk Directory: group/04gr742/pdf File: MFCC worksheet.pdf, 2004.
- H. Rahali, Z. Hajaiej and N. Ellouze, “Robust Features for Speech Recognition using Temporal Filtering Technique in the Presence of Impulsive Noise”, I.J. Image, Graphics and Signal Processing, 2014, vol. 11, pp. 17-24.
- I. Trabelsi, D. B. Ayed and N. Ellouze “Improved Frame Level Features and SVM Super vectors Approach for The Recognition of Emotional States from Speech: Application to Categorical and Dimensional States”, I.J. Image, Graphics and Signal Processing, 2013, vol. 9, pp. 8-13.
- Saloni1, R. K. Sharma, and Anil K. Gupta “Estimation and Statistical Analysis of Physical Task Stress on Human Speech Signal”, I.J. Image, Graphics and Signal Processing, 2016, vol. 10, pp. 29-34.
