Simulation and Experiment of Projectile Penetrate into Steel Target Acceleration Signal Processing

Author: Wen Feng, Zhou zhen
Journal: International Journal of Image, Graphics and Signal Processing(IJIGSP) @ijigsp
Article in issue: 2 vol.3, 2011.
Free access
For a comprehensive and objective understanding of the dynamic overload character of projectile penetrate into a steel target, using the simulating software ANSYS/LS-DYNA, adopting of the corresponding ammunition and target model, and the process of the ammunition penetrate the steel target was simulated and computed, the stress distribution map, mode and some results were got, using ball cartridge experiment, the original overload curves and high speed camera results were got. In this paper, the acceleration signals, which are obtained by the embedded high-overload electronic solid recorder at the experiment of armor-piercing bullet penetrating steel target, was done of wave filtering and integral analysis and so on in time domain, power spectrum was got through FFT in frequency-domain, as well as Wigner-Ville analysis and wavelet analysis in timefrequency. The characteristic signal when armor-piercing bullet penetrates steel target under certain conditions was obtained. Through signal processing and comprehensive analysis, a kind of signal processing method was provided to engineers, by which concerned parameters can be got.
MATLAB, ANSYS, Penetration, Wigner-Ville, Wavelet, Time-frequency analysis, Signal processing
Short address: https://sciup.org/15012095
IDR: 15012095
Text of the scientific article Simulation and Experiment of Projectile Penetrate into Steel Target Acceleration Signal Processing
Published Online March 2011 in MECS
the acquirement of penetration high-overload signals, as well as the analysis and processing signals for extracting signal characters . The first problem can be solved by placing electronic data storage device into projectile, so the authentic penetration overload signals can be obtained at bombardment experiment [1]. Since the end of 70’s of the 20th century, both domestic and foreign scholars have carried out in succession the study on measurement technology of penetration overload of projectile body. Franco, Forrestal and so on in the 90’s, Forrestal and Chinese Ren Hui Qi, Zhang Wendong, etc. after the year 2000, penetration overload curves of different target materials was measured [2-5]. However all of them do not do detailed and deep analysis from the aspects of time domain, frequency domain, time-frequency and wavelet, etc. As for the second problem, projectile penetrate into steel target is a complicated mechanical process, the acceleration signals include many frequency components and are non steady. In classical signal analysis methods, both time-domain and frequency-domain analysis are always relatively independent. Each time-frequency analysis method, which rises in recent years, can better solve the problem of non steady signal analysis. The wavelet analysis is the most successful method. After the year 2000, H. Jeong used wavelet to analyze wave propagation characteristics of plates in inhomogeneous laminated products [6], Professor Jiayong Tian, and so on, of the Peking University adopt wavelet to analyze transient flexural waves of cracked beam [7], and A. Bettella of the University of Padova studied the application of wavelet transform to analyze acceleration signals generated by HVI on thin aluminum plates and all-aluminum honeycomb sandwich panels [8]. In this paper, MATLAB and ANSYS/LS-DYNA as tools to be used for analyzing and processing time domain, frequency domain, Wigner-Ville and wavelet the data which got in the experiment. Important basis for designing of fuse and other equipment was provided and a kind of method which how to get care about signal was also provided for engineers.
-
II. E XPERIMENT
Electronic data sensing overload recorder was fitted inside the projectile, through bombardment experiment to obtain acceleration signals of projectile penetrating steel target. The smoothbore gun of 107 mm was used to penetrate 921A steel target with width 26 mm at 420 m/s, and the steel target was constrained four sides with fasteners. Fig.1 is the profile section of the overall installation structure of warhead, sensor and recorder, in which © is butt stock, © is isolation cover, © is head cover of the recorder, ф is the outside steel shell of the recorder, © is hair felt, @ is the inside steel shell of the recorder, © is bottom felt of the inside steel shell, © is sensor, © is projectile body and @ is foamed aluminum. Threaded connection was adopted between shell and buffer structure. And the sensor is piezoelectric and high overload acceleration transducer with metal packaging. M5 screw connection is the fixed joint on the rigid shell of the recorder. In order to reduce the impact failure of the recorder’s circuit due to the overload of steel target penetrating, recorder is divided into inner and outer steel shell structures, also multi-buffer structure of different materials was adopted, and special measures of potting strengthening was taken on the circuit body.
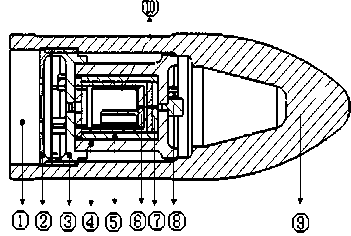
Figure1. Installation profile chart of projectile and sensor recorder high speed camera
steel recovery target plant
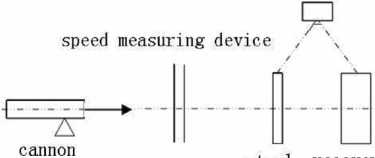
Figure2. Schematic plan of experiment site layout
Fig.2 illustrates how the experiment site layout. After the armor-piercing bullet is fixed well, it is fired by the launching unit. Before launching, the recorder has enabled recording. After the projectile penetrates the steel target and flies several meters, it falls to the ground after hitting recovery plant. After experiment, the recorder is taken out, the data stored in the recorder was read out, the concerned waveform can be drawn through data processing by host computer software, and then data can be further analyzed and processed in detailed by
MATLAB. The velocity can be got by high-speed camera. The come into velocity is 420 m/s and come out velocity is 269 m/s. Fig.3 is the photo of steel target before experiment and after experiment. Form this photo the hole into which penetrated by projectile is regular circular.
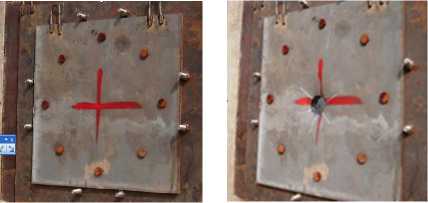
Figure3. The steel target before experiment and after experiment
-
III. NUMERICAL SIMULATION
The model of the projectile penetrates into steel target is built with ANSYS. It is one half models because the original model is symmetrical. The unit is cm-g-us. The volume of the target board, the velocity of the projectile and the constraints of the target are conducted in accordance with the actual situation. The projectile hits target vertically. It makes reasonable approximation in modeling and parameter setting.
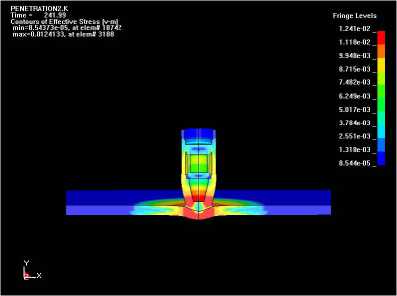
Figure4. The simulation stress distribution map of Projectile penetrate into steel target
It is concluded from the stress distribution map as follow: (1) at the start of the 100us when the projectile penetrates into the target, the location of the sensor is not sensitive to the change of the acceleration. This is pretightening effect time of recorder and projectile.(2)In the process of the sensor begins to feel the change of the acceleration and the value achieves the maximum ,acceleration signal is not a linear relation.(3)When the acceleration signal achieves the maximum value that is the time the warhead ovoid parts completely penetrates into the steel target, the contact remains the friction between shell side and target board.(4)The acceleration in the acceleration-time process curve after 550us changes, which the reason is the shell put tail that is caused by the friction which is different between the shell side and target board.
The vibration during projectile flying and penetrating has an impact to the acceleration signal. In order to simulate the state of the projectile in actual, model is made modal analysis with ANSYS and obtains the vibration frequency and the corresponding vibration model of the projectile in flight and penetration. As shown in table I.
According to the analysis the frequency is 4.07 kHz. The projectile vibration is axial. It has impact on the acceleration signal. In order to eliminate the effect, filter cutoff frequency should be chosen above 11.4 kHz. The whole axial vibration and the bending vibration of the projectile greatly influence the acceleration signal. If the test target is different, the acceleration signal is different and filter cutoff frequency is different. So it should choose Suitable cut-off frequency in the process of data processing according to the model analysis and acceleration signal spectrum in order to obtain the actual frequency. It provides the reference for the projectile structure and the design of the fuse structural strength.
TABLE I.
VIBRATION FREQUENCY AND CORRESPONDING VIBRATION MODEL
|
step |
1 |
2 |
3 |
|
|
mode |
Bending vibration |
Bending vibration |
Torsional vibration |
|
|
Frequency |
0.999kHz |
0.999kHz |
3.06kHz |
|
|
step |
4 |
5 |
6 |
|
|
mode |
Bending vibration |
Bending vibration |
Axial overall vibration |
|
|
Frequency |
3.98kHz |
3.98kHz |
4.07kHz |
|
|
step |
7 |
8 |
9 |
10 |
|
mode |
Bending vibration |
Bending vibration |
Torsional vibration |
Bending vibration |
|
Frequency |
8.02kHz |
8.03kHz |
9.95kHz |
11.4kHz |
(a) (b)
Figure5.
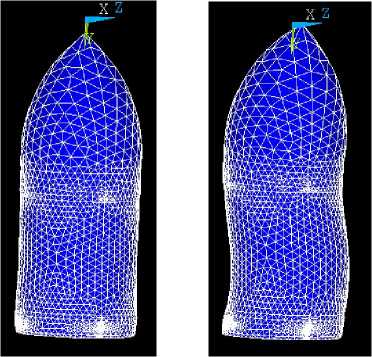
(a) The 6th axial overall vibration mode the resonant frequency is 4.07 kHz
(b) The 10th Bending vibration mode resonant frequency is 11.4 kHz
Fig.5 (a) is the 6th axial overall vibration mode and the frequency is 4.07 kHz.
-
(b) is the 10th Bending vibration mode and frequency is 11.4 kHz.
-
IV. S IGNAL P ROCESSING AND D ISCUSSING
A.Time-Domain Analysis
The data was measured when projectile penetrating 921A steel target with width 26 mm, the initial velocity of the shell when it is ejaculated of the chamber is 420 m/s. The measured original time-domain overload curve is as shown in Fig.7. It can be known from the penetration curve that it takes shell about 0.32ms from touching target to out of target, and it takes the sensor 0.22 ms from its acceleration beginning to change up to the acceleration value arriving at its maximum, whose maximum peak overload arrives at recorder’s range of 3.0 x 10 5 g, and the top signal is partially cut off.
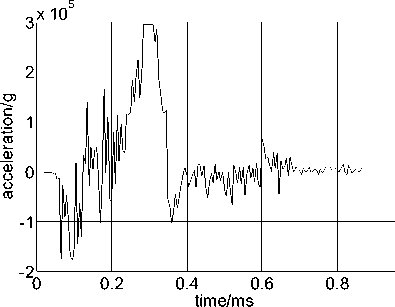
Figure6. The a-t curve of steel target penetration
time(ms)
time(ms)
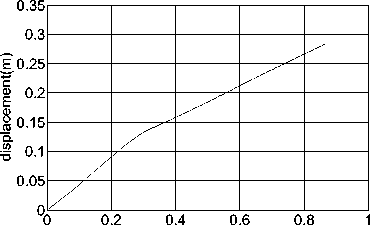
Figure8. The s-t curve of quadratic integral of original signal
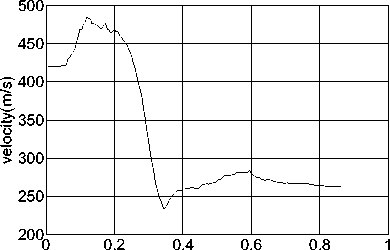
The v-t curve diagram, as shown in Fig.7, can be obtained through the first integral of the original signal overload curve as shown in Fig.6, with initial velocity of 420m/s. It can be known from Fig.7 that the velocity after target penetrating is 261m/s, close to the actually measured 269m/s. And the uprising part of this figure is obtained through the integral of measured negative acceleration as shown in Fig.7, caused by the relative motion of buffering between the threaded connection, which is adopted between the sensor and the projectile body, and a layer of aluminum. The s-t curve diagram as shown in Fig.8 can be obtained through quadratic integral of the overload curve. It can be known from Fig.8 that the axial displacement of the sensor in the shell in this period of time is 28cm, close to the length of the shell head of 30 cm. Analysis of waveform characteristics which are recorded in this experiment, as well as both v-t and s-t curves by integral, it shown that the solid recorder has completely recorded the overload signal in this test, and the test results analyzed in time domain fit close to the practical situation.
B.Frequency-Domain Analysis
The power spectral analysis similar to Fourier transform is also to analyze the frequency spectrum characteristics of the signal. The power spectrum density of stationary random signal is just the discrete Fourier transform of related sequences. But there are random signals in the original signal, and the random signals have not the limited energy. So its Fourier transform do not exist and do not content the conditions of absolutely inferable. But the power spectral analysis does not have this limitation, and can be seen the distribution in every frequency. If the autocorrelation function of the random signal x ( n ) is Rx ( τ ) , the Fourier transform of R x ( τ )
is : Sx ( f ) = +∞ Rx ( τ ) e - j 2 π f τ d τ (1)
x -∞ x
It defined S x ( f ) as the self-power spectral density of x ( t ) or power spectrum. Since the power spectrum
S x ( f )
contains all the information of
Rx ( τ ) . For
discrete random sequence x(n) , the relationship of since the power spectral density S x ( f ) and autocorrelation function R x (m ) is:
+∞
Sx(f)= ∑Rx(m)e-j2πfmTs n=-∞
In which , Ts is the data sampling interval time.
The power spectrum distribution diagram of penetration acceleration signal, as shown in Fig.9, is obtained through power spectrum analysis of the original time-domain signal as shown in Fig.6. From Fig.9, we can make out the frequency distribution characteristic of penetration signal. The main energy of the signal is concentrated below 10 kHz. And there are higher peak values at 38 kHz, 66 kHz, 78 kHz and 92 kHz, which correspond to resonant frequency of the sensor. It can be known from the ANSYS simulation that the whole axis vibration is 4.07 kHz. We select the highest range of frequency near by 4.07 kHz as the actual structural response frequency and it is 6.93 kHz. In addition, during the principle of the Signal and System and Digital Signal Processing, periodic signal amplitude spectrum is a line spectrum, the amplitude spectrum of non-periodic signal is a continuous spectrum and the frequency occupied by the signal is a frequency range or a certain frequency width. On the basis of this principle, it can be known from the Fig.9 that the frequency width of whole axis vibration is 4.62~9.24 kHz. In order to filter the non-rigid overload signals, we select the 4.62 kHz as the cut-off frequency. The original signal and different cut-off frequency was shown as Fig10.
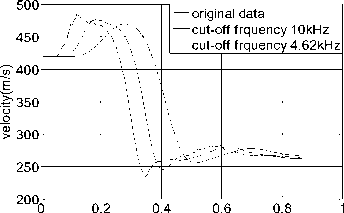
The original signal in different low-pass filter frequencies curves and the corresponding v-t curves is shown in Fig.11.We can know that the method to select the filter cutoff frequency through modal analysis comparing the measured signal spectrum analysis, after filtered, the velocity is coincide the actual velocity.
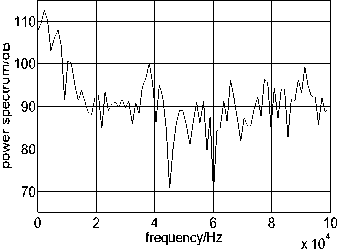
Figure9. The curve of power spectral
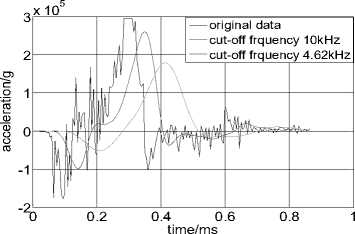
Figure10. The original signal and different cut-off frequency
C.Time-Frequency Analysis
Although power spectral analysis can transform signals from time domain into frequency domain for analysis, but it can not organically combine the two because the time-domain waveform does not include any frequency domain information. Thus, there is a pair of the most fundamental contradiction in signal analysis: the localization contradictions of time domain and frequency domain. And the acceleration signals during the projectile penetrating steel target is a non-steady signal. So it is important to realize its localization characteristics. It does not enough to analyze it only in time or frequency domain. Basic time-frequency analysis methods include short-time Fourier transform, wavelet analysis, Wigner-Ville distribution and time-frequency distribution series, etc. The wavelet analysis is suitable for processing nonsteady signals.
-
1) Wigner-Ville Distribution Analyze Signal
The basic purpose to do the time-frequency analysis is to define a time-frequency function. Make that the energy of time t and frequency f can be improved from the basis of short-time Fourier transform, and then to get the ideal method.
Different from the expression of the time-frequency, the substance of Cohen bilinear is to distribute the signal among the time-frequency plane. The Wigner-ville distribution is the basis expression of it.
W ( t , f )= +∞ S ( t + τ ) S ∗ ( t - τ ) e - j 2 π f τ dτ
-∞ 2 2
In the formula, s(t) emerged twice, so it is called bilinear。 There is no any window function in the formula, so it overcome the contradiction that time resolution ratio and frequency resolution ratio of shorttime Fourier transform pin down. Because of this advantage and some other good characteristics, this distribution has been studied comprehensive. Hilbert transform definition is:
H [ S ( t )] = S ∧ ( t ) = 1 S ( t ) ' dt
π t - t (4)
The analysis signal is:
Z ( t ) = S ( t ) + H [ S ( t )] = S ( t ) + 1 S ( t ) ' dt
π t - t (5)
Because of the negative frequency of the analysis signal does not exist, use it as the analysis object, can avoid the frequency confuse and let the sample frequency halved. The definition of Wigner-ville distribution is:
W z ( t , f ) = +∞ Z ( t + τ ) Z ∗ ( t - τ ) e - j 2 π f τ d τ -∞ 2 2 (6)
Or it is defined in the frequency:
W z ( f , t ) = +∞ Z ( f + v ) Z ∗ ( f - v ) ej 2 πvτdv z -∞ 2 2
Wz(f,t)=Wz(t,f)
Z(f) is the Fourier transform of z(t).
If we define the signal s1(t)’s Fourier transform is S1(f), s(2)’s is S 2 (f), then the joint Wigner-ViIle of s1 (t) and s 2 (t) distribution is defined as:
∫ +∞ τ τ
-∞ s 1( t + 2) s 2 ∗ ( t - 2) e - j 2 π f τ d τ
= ∫ - + ∞ ∞ S 1 ( f + v 2) S 2 ∗ ( f - 2 v ) ej 2 π v τ dv (9)
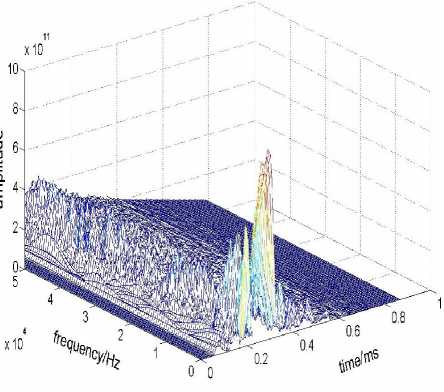
Figure12. Distribution of tfrwv Function of penetration signal in three-dimensional
Fig.12 is the tfrwv function distribution in threedimensional. It is visually showing the distribution relationship corresponding to energy amplitude, time and frequency during the whole penetration, from which we can know that during the time 0.25ms to 0.35ms, its spectrum amplitude is the highest, and the energy of overload signals is mainly concentrated below 10 kHz.
-
2) Wavelet Analysis Signal
The wavelet analysis method bases on time-scale, which has the characteristic of multi-resolution analysis, is able to mark local characteristics of signals in both time and frequency domains, and the size of whose window is fixed, but its form can change. So it is an analysis method of time-frequency localization with changing time window and frequency window. The definition of wavelet function is: supposing ψ(t) is a square integrable function, i.e. ψ (t) ∈ L (R ) , and if its Fourier transform ψ (ω ) meets the admissibility condition of (10):
C ψ = ∫ R
d ω < ∞ ω
( 10 )
ψ ( t ) is called as basic wavelet or wavelet generating function.
After ψ ( t ) has dilatational and translational motions, function ψ ab ( t ) can be obtained, as shown in (11):
1 t - b
ψ ab ( t ) = ψ ( )
J a a
a ⋅ and ⋅ b ⋅ are ⋅ real ⋅ numbers , a ≠ 0
in which a is dilation factor, b is scale factor and
ψ ab ( t ) is wavelet basis function.
For the discrete signal as (12):
∫ ∞ *
-∞ f ( t ) ψ j , k ( t ) dt =< f , ψ j , k >
Its reconstruction formula is (13):
∞∞ f ( t ) = C ∑∑ C j , k ψ j , k ( t ) j =-∞ k =-∞
( 13 )
C is a constant which is nothing to do with signals.
For the measured curve as shown in Fig.6, we use the wavelet toolbox under Matlab, and decompose the signal through db3 wavelet basis. There are 5 layers of the decomposition, the result is as shown in Fig.13, and cfs is discrete wavelet coefficient which is expressed as greyscale map.
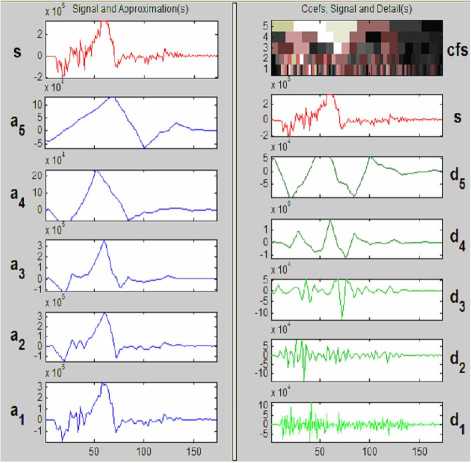
TABLE II.
B ANDWIDTH OF W AVELET DECOMPOSITION A
-
V. CONCLUSION
In order to objectively and comprehensively understand dynamic overload characteristics of armorpiercing bullet penetrate into steel target, through the ANSYS simulation, a comprehensive method of signal processing was adopted in this paper. The conclusion is that under special test conditions of this paper, the low-pass filter cutoff signal frequency range is between 4.62 ~ 9.24 kHz. The distribution of energy varies with the concrete moment of penetrate into target, includes many high-frequency components, structural response signals of sensor itself and structural response signals of system. The signal can be separated according to requirement. The signal processing method is instructive to the staff studying this kind of engineering problems to realize signal extracting. We suggested that through experiment, simulation and signal processing to get the characteristics when armor-piercing bullet penetrate into steel target with different materials and different thickness further studied. Make intensive study of time-frequency analysis for signals, energy of each band signal, corresponding structural response and transitive relation.
References Simulation and Experiment of Projectile Penetrate into Steel Target Acceleration Signal Processing
- Wendong Zhang. Design method of storage measurement and its application. High Education Press of China; 2002.ISBN:7-04-010432-6. p1-8
- Franco R.A, Ingram J.K. A very high shock data recorder. Conference Proceedings-IEEE SOUTHEASTCON, 1991; vol 1, p503-507
- M.J Forrestal, D.E. Grady. Penetration tests for normal impact into geological targets. International Journal of Solids and Structures, 1982;Vol 18, Issue 3, P229-234
- Wendong Zhang, Lujiang Chen, Jijun Xiong, high g deceleration–time measurement for the penetration into steel target, International Journal of Impact Engineering.2007;34, p436–447
- Ren Huiqi, He Xiang, Liu Ruichao. A STUDY ON THE OVERLOAD CHARACTERISTICS OF PROJECTILE PENETRATING CONCRETE. China Civil Engineering Journal, 2005;vol 38, No.1, p110-116.
- H. Jeong. Analysis of plate wave propagation in anisotropic laminates using a wavelet transform. NDT&E International 2001;Vol 34, p185–190
- Jiayong Tian, Zheng Li, Xianyue Su. Crack detection in beams by wavelet analysis of transient flexural waves, Journal of Sound and Vibration. 2003;Vol 261, p715–727
- A.Bettella, A.Francesconi, D.Pavarin. Application of Wavelet Transform to analyze acceleration signals generated by HVI on thin aluminum plates and allaluminum honeycomb sandwich panels. International Journal of Impact Engineering,2008;Vol 35, p1427–1434.
